ISSN online: 1807-1775
DOI: 10.4301/S1807-17752010000300002
_____________________________________________________________________________________ Recebido em/Manuscript first received: 11/08/2009 Aprovado em/Manuscript accepted: 01/06/2010 Endereço para correspondência/ Address for correspondence
André Luiz Pestana de Oliveira, Universidade Municipal de São Caetano do Sul – USCS Campus II – R. Santo Antônio, 50 – Centro – São Caetano do Sul, São Paulo, Brasil - Tel.: 11 4239-3200, E-mail: [email protected]
Marco Antonio Pinheiro da Silveira, Universidade Municipal de São Caetano do Sul – USCS Campus II – R. Santo Antônio, 50 – Centro – São Caetano do Sul São Paulo, Brasil - Tel.: 11 4239-3200 E-mail: [email protected]
ISSN online: 1807-1775
Publicado por/Published by: TECSI FEA USP – 2010
ERP IN THE PRODUCTION AREA: USER’S OPINIONS ABOUT
NEEDS BEING MET
Andre Luiz Pestana de Oliveira
University of Sao Caetano do Sul - USCS, Brazil
Marco Antonio Pinheiro da Silveira
University of Sao Caetano do Sul - USCS, Brazil
__________________________________________________________________________________
ABSTRACT
The study verified the production area’s key user opinions about needs being met by ERP through a survey conducted within industries from the State of São Paulo. The survey instrument is composed of 28 activities related to the production area, using the literature review on production management and ERP as a basis. Also, four dimensions for production activities were defined: Inventory Management Policies, Forecasts, MRP and MRP II. Activities were evaluated according to five different criteria: Needs Being Met, Ease of Use, Parameterization, Customization and Training. The questionnaire was answered by managers from 46 industries, composing a non-probabilistic sample with an accessibility criterion. The research is exploratory. The analysis of the obtained data broadly showed that ERPs meet the expectations of production managers. However, its most noteworthy aspect is the high number of activities that are not used by companies. It was noted that the higher the number of used activities, the higher the level of perception of needs being met.
1. INTRODUCTION
Even after the great expansion of ERP (Enterprise Resources Planning) systems in the 90’s, nearly twenty years have passed by and today, still, ERP is a source of academic studies. The modules linked to production management were the first to be developed and form the “birth place” of ERPs. The interest in this study was developed through the observation that, despite the fact that ERP has already been used for quite a long time, much is still debated over the benefits, difficulties and need for companies to adjust to the system use. Such an observation led to the proposition of verifying user and production manager opinions, as to the use of such an instrument in relation to their needs being met in the execution of production activities as found in the recent academic literature through the functionalities available in these systems.
Business management systems have evolved, from the first MRP (Material
Requirement Planning) to the current ERP. According to Aghazadeh (2003), ERP had a
tough beginning, but it overcame difficulties and showed its capacity to survive and adjust, becoming more apt to provide companies with necessary information. Still, one may consider that its benefit levels are debatable when companies must subject themselves to the business rules of these systems and, therefore, it is relevant to ask user opinions about needs being met. One aspect to be highlighted is that ERPs were made empirically by their suppliers, without any academic development that guided or limited them (Barrella, 2000). There is also the fact that many organizations, by adopting an ERP system, do not have an actual notion of how their own processes will be like after the system is implemented.
Carrying out this study is justified as it is regarded as a contribution to what is already known about ERP. It is suitable to question how much ERP effectively meets the expectations of what it proposes to achieve since this still is a debatable point.
The purpose of this research was to verify user and production manager opinions from industrial companies in the State of São Paulo, about needs being met related to production department activities, through the functionalities available in ERP systems. The study’s guiding question is: What are the user and production manager opinions, from industrial companies from the State of São Paulo, about needs being met related to production department activities, through the functionalities available in ERP systems?
In order to identify production activities, recommendations and references found in recent academic literature were used, from which 28 basic activities were identified, which compose this research instrument’s assertions. For each type of production activity evaluated, the user opinions were verified through five evaluation items: their needs being met through ERP functionalities, functionality ease of use, parameterization performed in functionality, need for functionality customization and training received.
2. CONCEPTUAL FRAMEWORK
order to serve a growing number of service and product consumers. Car production is a good example. The theme is addressed in the book “The Machine that Changed the World”, by Womack, Roos and Jones (1992). It describes the car manufacturing process evolution over the last decades. Production models as well as their end products start to become more complex. A car, for instance, involves thousands of separate items.
Manually managing inventories, suppliers, the manufacturing of semi-finished, intermediate and finished products is no longer a reasonable solution. In order to meet this need, big companies began to invest in information systems to aid this task in their plants.
In the 1960’s, MRP, or Material Requirement Planning, which is a specific functionality in the area of production, emerged and is used to calculate needs and dependent demand material flow time periods (Slack, Chambers and Johnston, 2002). It was initially just an inventory control concept, shifting focus to material planning in the 1970’s (Gupta and Kohli, 2006).
By obtaining new modules and functionalities for the shop floor, it created MRP II (Manufacturing Resources Planning). The evolution continues until other modules were added, which can be operated separately from the productive process. This is the case of Accounting, Finance, etc, thus, resulting in the modern ERP.
ERPs, which are integrated application packages, created to meet most of the information needs of a company, for the first time offered administrators the possibility to control their company’s activities in real time; since information flows in a standardized fashion in a single databank the whole time, no business transactions go unnoticed (Davenport, 2002). They are powerful IT solutions for companies and, if properly implemented, they may offer countless benefits to the companies (Souza, 2000). ERP focus is on the business process and not on functional areas of a company (Corrêa and Gianesi. 1994; Gupta and Kohli, 2006).
A great difficulty presented by Davenport (1998) is that these systems, in addition to being expensive and difficult to implement, impose their own logic, which can tie the hands of managers. This occurs if the company disregards the business models that the market conventionally calls good practices and that are embedded in these systems.
function or need and that parameterization does not address. (v) Locality is the adjustment of an ERP developed in a given country in order to function in another country, considering such aspects as legislation, taxation, or commercial process, for instance. (vi) Updating is the process in which the ERP supplier makes new functionalities available and corrects possible product errors.
One of the most critical points of the ERP implementation process is a possible non-adherence of company processes to the practices embedded in these software packages (Davenport, 1998; Souza and Zwicker, 2000), which leads to parameterization needs and/or customization (Marins and Padilha, 2005; Souza, 2000; Mendes and Escrivão Filho, 2007).
Azevedo Junior and Campos (2008) studied the use of a methodology for the development of business management software and argue that defining requirements for business support software systems is not a simple task due to the dynamics in process changes. The use of a suitable methodology may offer advantages such as: (i) systematic identification of the information needs from the processes linked to the business targets; (ii) systematic identification in an interactive approach of the Business Processes; and (iii) an incorporation of activities which are consistent with the incremental model.
Also, with regards to the same theme, Bervian (2004) studied the criteria for the decision of customizing ERP in the implementation project. The author confirmed that the practices embedded in the ERPs may not comply with the company’s practices. Thus, during the system implementation, it is necessary that some decisions be made aiming to resolve the non-adherence of the system to the organization. Basically, there are two alternatives: a change in the organization’s business processes or an ERP system customization.
In addition to parameterization and customization, there is another point to be highlighted as a factor for higher ERP adherence: training. Silva (2005) studied the importance and influence of training in implementation and in ERP systems acceptance according to some central factors: the perceived usefulness and ease of use and the attitude towards the new technology. The study showed that training positively affects the acceptance of ERP, which, in turn, had a positive impact on ease of use and on the perceived usefulness.
2.1 Production Management
The basic goal of Operations and Production Management (O&PM) is to increase productivity and improve the quality of products and services. Essentially, companies, whether profit or non-profit, exist to create value and it is the production area that is directly involved in the tasks that add value to products and services. (Meredith, 2002).
Creating these products and services is the very reason for any organization's existence (Slack, Chambers and Johnston, 2002).
reviewing recent studies from the academic literature; 12 articles, 5 theses and dissertations, from which relevant activities for the development of the field research were chosen. As a complement, a theoretical construct and support from 6 O&PM textbooks were used, for which references in the work of Bido (2004) were found and used; he did a comparative study of textbooks on this theme and the syllabus of three different universities,.
This work does not intend to exhaust all the possibilities of production activities, but, rather, evaluate the processes and activities that most meet the goals of this research based on literature review and published works
It is important to highlight that the production activities shown in this work have differences in semantic values, from simple consultations, such as “Current Balance” and the “Historical Demand Data”, and business practices, such as “Purchase Order” and “Work Order”, to complex processing, such as MRP and MRP II. One may consider this aspect a limitation of the work. On the other hand, some activities of minor scope were added to the production area list prepared in this work, based on the bibliographic research about Production and about ERP, when it was considered to have greater relevance and recurrence of the activity citation.
In order to better organize the presentation of these processes, they were divided into four main groups that represent functional dimensions: (i) Inventory Management Policies, (ii) Forecasts, (iii) MRP and (iv) MRP II. Table 1 shows what was evaluated in this study for the Inventory Management Policy.
Authors
Activity
Articles Theses and
Dissertations O&PM books
Order Point
Cardoso, Silva Neto and Souza (1999)
Peixoto and Pinto (2006); Santoro and Freire(2008);
Valeretto Junior (2005)
Corrêa and Gianesi (1994)(Cap.4); Martins and Laugeni (1998)(Cap.9); Davis, Aquiliano and Chase(2001)(Cap.14);
Slack, Chambers and Johnston (2002)(Cap.12); Gaither and Frazier (2002)(Cap.9); Ritzman and Krajewski(2002)(Cap.10)
Economic Order Quantity
Cardoso, Silva Neto and Souza (1999)
Peixoto and Pinto (2006); Santoro and Freire (2008);
Valeretto Junior (2005)
Corrêa e Gianesi (1994)(Cap.4); Martins and Laugeni (1998)(Cap.9); Davis, Aquiliano and Chase(2001)(Cap.14); Slack, Chambers and Johnston (2002)(Cap.12); Gaither and Frazier (2002)(Cap.9); Ritzman and Krajewski(2002)(Cap.10);
Safety Stock
Cardoso, Silva Neto and Souza (1999);Peixoto and Pinto (2006); Santoro and Freire (2008); Wanke (2008); Sellitto, Borchardt and Pereira (2008)
Corrêa and Gianesi (1994)(Cap.4); Martins and Laugeni (1998)(Cap.9);
Balances In Stock
Cardoso, Silva Neto and Souza (1999)
Peixoto and Pinto (2006);
Valeretto Junior (2005)
Corrêa e Gianesi (1994)(Cap.4); Martins and Laugeni (1998)(Cap.9); Slack, Chambers and Johnston (2002)(Cap.12); Ritzman and Krajewski(2002)(Cap.12)
ABC Classification
Martins andLaugeni (1998)(Cap.9); Davis, Aquiliano and Chase(2001)(Cap.14); Slack, Chambers and Johnston (2002)(Cap.12); Gaither and Frazier (2002)(Cap.9); Ritzman and Krajewski(2002)(Cap.10)
Just In Time
Philosophy Mesquita and Castro (2008) Lima (2004)
Corrêa and Gianesi (1994)(Cap.3); Martins and Laugeni (1998)(Cap13); Davis, Aquiliano and Chase(2001)(Cap.12);
Slack, Chambers and Johnston (2002)(Cap.15); Gaither and Frazier (2002)(Cap.13); Ritzman and Krajewski(2002)(Cap.13)
Net Requirements Santoro and Freire (2008) Valeretto Junior (2005)
Corrêa and Gianesi (1994)(Cap.4)
Martins and Laugeni (1998)(Cap. 13)
Chart 1 – Conceptual reference for inventory management policy Source: Drawn by the author
Chart 2 shows what was evaluated in this study for Forecasts
Authors Activity Articles Theses and Dissertations O&PM books Sales Forescast
Werner and Ribeiro (2006); Peixoto and Pinto (2006); Silva Filho and Cezarino (2007); Cardoso, Silva Neto and Souza (1999); Wanke (2008)
Barrella (2000); Valeretto Junior (2005)
Martins and Laugeni (1998)(Cap.8); Slack, Chambers and Johnston (2002)(Cap.14); Davis, Aquiliano and Chase(2001) (Cap.6,13,16); Gaither and Frazier (2002)(Cap.3, 8);
Historical Demand Data
Werner and Ribeiro (2006);
Silva Filho and Cezarino (2007)
Gaither and Frazier (2002)(Cap.3);Slack, Chambers and Johnston (2002)(Cap.11); Davis, Aquiliano and Chase(2001)(Cap 6); Ritzman and Krajewski(2002)(Cap.9)
Simulation of Future Orders
Peixoto and Pinto (2006)
Santoro and Freire (2008)
Gaither and Frazier (2002)(Cap.3, 4)
Chart 3 shows what was evaluated in this study for MRP
Authors
Activity
Articles Theses and
Dissertations
Books
MRP
Massote, Maria and Takagochi (2005);Cardoso, Silva Neto and Souza (1999);Mesquita and Castro (2008)Fransoo and Weirs (2008)
Barrella (2000); Berretta (1997)
Corrêa and Gianesi (1994)(Cap.4); Martins and Laugeni (1998)(Cap.9,11); Slack, Chambers and Johnston (2002)(Cap.14); Davis, Aquiliano and Chase (2001) (Cap13,15); Gaither and Frazier (2002)(Cap.10); Ritzman and Krajewski(2002)(Cap.12)
Purchase Orders Cardoso, Silva Neto and Souza (1999)
Valeretto Junior (2005)
Martins and Laugeni (1998)(Cap.9,11); Slack, Chambers and Johnston (2002)(Cap.13); Gaither and Frazier (2002)(Cap.14)
Creation of Work Orders
Massote, Maria and Takagochi (2005);Cardoso, Silva Neto and Souza (1999)
Martins and Laugeni (1998)(Cap.11)
Forecast of Future Inbound and Outbound of Raw Material
Valeretto Junior
(2005)
Corrêa e Gianesi (1994) (Cap.4); Ritzman e Krajewski(2002)(Cap.12)
Production Master Plan
Massote, Maria and Takagochi (2005);Cardoso, Silva Neto and Souza (1999)
Barrella (2000); Valeretto Junior (2005)
Martins and Laugeni (1998)(Cap11,13); Slack, Chambers and Johnston (2002)(Cap.14); Davis, Aquiliano and Chase(2001)(Cap13,15); Gaither and Frazier (2002)(Cap.8); Ritzman and
Krajewski(2002)(Cap.12)
Chart 3 – Conceptual reference for MRP Source: Drawn by the author
Chart 4 shows what was evaluated in this study for MRP II.
Authors
Activity
Articles Theses and
Dissertions
Books
MRP II Mesquita and Castro (2008)
Corrêa and Gianesi (1994) (Cap.4); Martins and Laugeni (1998)(Cap.9,11); Slack, Chambers and Johnston
(2002)(Cap.14)Gaither e Frazier (2002)(Cap.10);
Production Sequencing
Algorithm Massote, Maria and Takagochi
(2005)
Slack, Chambers andJohnston (2002)(Cap10);
Authors
Activity
Articles Theses and
Dissertations
Books
Production Scheduling
Massote, Maria and Takagochi (2005)
Barrella (2000); Valeretto Junior (2005)
Corrêa and Gianesi (1994) (Cap4); Slack, Chambers and Johnston (2002)(Cap.10);
Gaither and Frazier (2002)(Cap.10)
Machine load Gaither and Frazier (2002)(Cap.10);
Gant Chart Massote, Maria and Takagochi
(2005) Gaither and Frazier (2002)(Cap.10);
Lead time in Sales
Orders Peixoto and Pinto (2006) Corrêa and Gianesi (1994) (Cap.4)
Economic Production Quantity
Massote, Maria and Takagochi (2005) Barrella (2000); Valeretto Junior (2005) Production Capacity Calculation Valeretto Junior (2005); Berretta (1997)
Slack, Chambers and Johnston (2002)(Cap.11);
Gaither and Frazier (2002)(Cap.3,8); Ritzman and Krajewski(2002)(Cap.6,12) Gaither and Frazier (2002)(Cap.10);
Shop floor planning and control
Silva Filho and Cezarino (2007): Cardoso, Silva Neto and Souza (1999)
Barrella (2000)
Production Recheduling based on changes in Sales orders
Massote, Maria and Takagochi
(2005) Barrella (2000)
Simulation-based sales forecasting
Peixoto and Pinto (2006); Cardoso, Silva Neto and Souza (1999)
Gaither and Frazier (2002)(Cap.3); Ritzman and Krajewski(2002)(Cap.6,9)
Integration with supervision systems
Bussetti de Paula and Santos (2008); Massote, Maria and Takagochi (2005):Grilo Júnior, Pereira and Villar (2008)
Joaquim (2006) Davis, Aquiliano and Chase(2001)(Cap.3)
Chart 4 – Conceptual reference for MRP II Source: Drawn by the author
Production activities were distributed in functional dimensions as follows:
(i) Inventory Management Policies: Order Point, Economic Order Quantity, Safety Stock, Balances in Stock and ABC Classification are activities or instruments that are usually developed by such departments as purchasing, logistics or supply chain and they aim at the supply of materials so that they are not depleted according to the calculated Net Requirements. The Just-In-Time Philosophy significantly changes the quantities and time of material replenishment.
(ii) Forecasts: Sales Forecasts, their Seasonalities and Trends, which are calculated from Historical Demand Data, as well as the projection and Simulation of Future Orders are vital information for PPC (Production Planning and Control) and are activities that may be developed by such departments as sales, marketing or PPC itself.
(iii)MRP: MRP calculation is performed from the Production Master Plan and calculates the Forecast of Future Inbound and Outbound of Raw Material necessity, and it may (or may not) automatically create Work Orders and Purchase Orders. These activities or instruments are, in general, performed by the Production Planning and Control department and are relatively easy to operate.
(iv)MPR II. MRP II calculation is more comprehensive than MRP, because it calculates not only material needs, but also all productive resources needs. Thus, having a Production Sequencing Algorithm, which takes the Economic Production Quantity into account, is necessary in order to Calculate Production Capacity, and then estimate delivery time (Lead Time) of Sales Orders. This estimate must also be possible from Simulation-based sales forecasting. Next, Production Scheduling must be determined, which is made by Machine Loads, which can be easy visualized in a Gant Chart. With these instruments, it is possible to obtain Shop Floor Planning and Control as well as the possibility to reschedule production based on changes in Sales Orders. Finally, production monitoring must be performed by Integration with Supervisor Systems. These activities are also performed by PCP or PPCP areas; however, they have a high-complexity level operation.
3. METHODOLOGY
This study was developed in phases. The first phase was the definition of the research problem. Next, a conceptual reference was sought for two topics: ERP systems and the activities linked with the production area. The most extensive phase of this research was the one of finding references related to production activities, which are linked to ERP, and which are of common use in the production environment. Then, a research instrument was developed. The assertions were made from the 28 production activities that were evaluated, based on the academic literature review. For each assertion, respondent opinion was asked through five evaluation items evaluated in the references verified for ERP.
collecting the answers, the result analysis was performed, where mean statistics techniques, standard deviation, Shapiro-Wilk test for normality and Kruskal-Wallis h test were performed, which substantiated the answer to this research problem. Although the sample was small (46 respondents), tendencies that suggest indications of the researched theme were verified.
This research is exploratory and its purpose was to verify production manager opinions, from industrial companies in the State of São Paulo, about needs being met in relation to production area activities through the functionalities offered by ERP systems. This was done by mean of a questionnaire sent to the persons in charge of production areas in industries from a variety of sectors in the State of São Paulo, all of which are ERP systems users. The companies surveyed are part of such sectors as basic steel, construction materials, rubber goods manufacturing, medical equipment, electric and electronic materials, pharmaceutical products, chemical products, textile products and furniture manufacturing. According to Babbie (1999), the survey research, despite the fact it uses peculiar and specific techniques, may perfectly fit into the scientific investigation general norms. Also, according to this author, this research method boasts logical, deterministic, general, frugal and specific characteristics. This technique was regarded as suitable for this research since one of his recommendations about the survey method is to use it as a search mechanism when beginning an investigation about a given theme (Babbie, 1999).
The survey was initially sent by e-mail to 2,000 industries in the Greater ABC Region in the State of São Paulo (a highly industrialized area, widely known in Brazil). In order to contact them, a mailing list was obtained from a company called D & P Soluções para Marketing e Eventos Ltda. Due to the very low response, of which only two companies answered the survey, there was an adoption of criterion of accessibility to the employees of a company that develops an industry leading ERP in the Brazilian market and the convenience criterion, which allows the survey to be directly targeted at production managers. The survey was then sent to another 62 companies, with responses from 44 of them. In total, 46 answers were received from production managers from companies that use ERP in the production area. Thus, this research was done with a non-probabilistic convenience sample, which mean that the results cannot be generalized; however, such results point to indications to be proven.
The research instrument was developed with assertions directly associated with the research problem, with 28 assertions linked to production management. For each assertion, respondent opinion was asked according to the 5 evaluation items and an answer to all of them was obligatory: 1- Needs being met through ERP functionalities, 2-Functionality ease of use, 3-Parameterization performed in functionality, 4- need for functionality customization and 5-Training received. In order to verify user opinion about these activities, the Likert Scale was used, with 5 different ratings: 1-Well below expectation; 2- Slightly below expectation; 3-Expectation met, 4 –Slightly above expectation, 5- Well beyond expectation.
The assertions related to the production activities addressed by ERP functionalities and grouped by their functional dimension were:
order point, P02 – To calculate the economic order quantity, P03 – To calculate the safety stock – P04 – To make Balances In Stock available – P05 – To create the ABC classification, P06 – To work according to the Just In Time Philosophy, P07 – To calculate the needs of purchased and manufactured products.
Functional Dimension Forecasts: P08 – To calculate Sales Forecasts, P09 – To consider seasonalities and trends in demand forecasts, P10 – To store historical demand data, P11 – To calculate needs from Simulation-based sales forecasting.
Functional dimension MRP: P12 – To calculate needs from MRP, P13 – To automatically create purchase orders. P14 – To automatically create work orders, P15 – To forecast future inbound and outbound of materials, P 16 – To make the Master Production Schedule.
Functional dimension MRP II: P17 – To calculate production needs, P18 – To allocate work orders on available machines, P19 – To make the production sequencing schedule, P20 – To calculate machines load, P21 – To show the GANT Chart with the work orders sequencing, P22 – To calculate production needs through sales order lead times, P23 – To open work orders through the economic production quantity, P24 – To calculate production capacity, P25 – To plan and control the shop floor, P26 – To reschedule production after changes made in sales orders, P27 – To simulate production needs from sales forecasts, and P 28 – To integrate with the supervisor systems (CIM, SKADA, MES, etc.)
The research instrument, shown in this work’s attachment, was submitted as a pre-test to three production managers from companies that use ERP in the City of São Paulo and who validated and suggested minor adjustments in the content of the assertions.
For data analysis, there was the use of descriptive statistics of the evaluations received through the research instrument. In this work, mean, standard deviation, Shapiro-Wilk test for normality and Kruskal-Wallis h test were employed.
4.RESPONSE ANALYSIS AND DISCUSSION
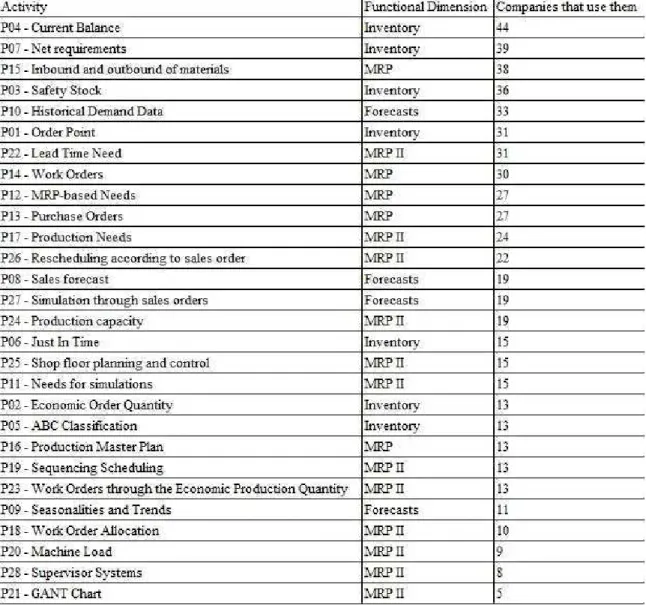
The answers to the 46 questionnaires received were transferred to support spreadsheets. There was the adoption of the criterion that a given activity would only be taken into account if it obtained ratings for all the five evaluation items surveyed. The activities without evaluation obtained a “0” rating on the spreadsheet. For the calculation of the mean and standard deviation, only the activities that obtained ratings were taken into account. The quantity of activities linked to each functional dimension used by the companies was shown.
Table 1 – Quantity of answers per activity Source: Research Data
It is possible to see in Table 1 that the most performed activity for this sample was “Current Balance” with 44 companies and the least performed is the “Gant Chart” with only 5.
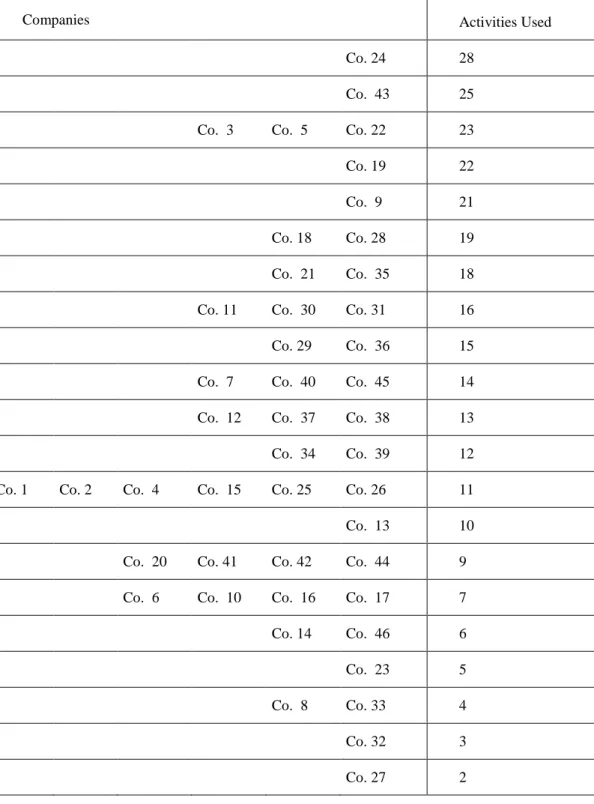
Table 2 – Quantity of activities used by company
Source: Research Data
Table 3 is the crossing of Tables 1 and 2 and by observing Table 3 it is possible to divide it into four quadrants (Q), where the upper-left quadrant consists of the most performed activities and the companies that perform activities in ERP the most. In contrast, the least performed activities and the companies that least perform them in
Companies Activities Used
Co. 24 28
Co. 43 25
Co. 3 Co. 5 Co. 22 23
Co. 19 22
Co. 9 21
Co. 18 Co. 28 19
Co. 21 Co. 35 18
Co. 11 Co. 30 Co. 31 16
Co. 29 Co. 36 15
Co. 7 Co. 40 Co. 45 14
Co. 12 Co. 37 Co. 38 13
Co. 34 Co. 39 12
Co. 1 Co. 2 Co. 4 Co. 15 Co. 25 Co. 26 11
Co. 13 10
Co. 20 Co. 41 Co. 42 Co. 44 9
Co. 6 Co. 10 Co. 16 Co. 17 7
Co. 14 Co. 46 6
Co. 23 5
Co. 8 Co. 33 4
Co. 32 3
ERP are found in the lower-right quadrant.
By extracting the mean per quadrant of the opinion about needs being met by ERP in the evaluations, the following arrangement is obtained:
Chart 5 – Mean per quadrant
Source: Research Data
The mean shown in Chart 5 suggests that when more activities are performed in ERP systems and the more companies use ERP in production, the higher the mean of ratings is (Q1) and that the activities least performed in companies that use ERP least in production show the lowest mean (Q4).
Graph 1 – Distribution of all ratings Source: Research Data
It is possible to verify that the rating that received the most number of answers regarding needs being met through ERP functionalities was a rating 3 with almost 65%, which in this case represents the “met expectation” rating.
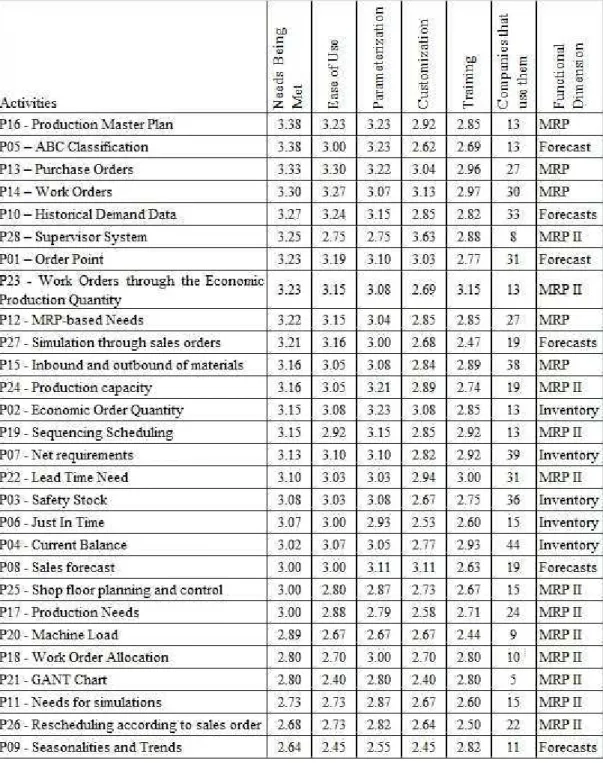
Another possible analysis is the comparative verification of the evaluation mean per production activity. In Table 2, production activities and their individual mean are shown for the five evaluation items, in addition to the number of companies that answered that they used this activity as an ERP functionality and the functional dimension linked to the activity ordered by needs being met through ERP functionalities.
Table 5 – Mean per activity for the 5 evaluation items in mean order of needs being met Source: Research Data
important to highlight that the difference between the extremes found (3.38 maximum and 2.64 minimum) is not big. In this way, no mean was reached for a rating 4 (which mean “Slightly above expectation”) or 2 (which mean “Slightly below expectation”). The mean analysis suggests that, for this type of evaluation criterion, the respondent’s opinion is slightly above “Expectation met”.
The second analysis refers to the functionality ease of use and by analyzing Table 6, 18 production activities received mean that are equal to or greater than 3, while 10 of them where below this value. The difference between the extremes (3.30 maximum and 2.40 minimum) is bigger than the difference found in the needs being met through ERP evaluation item. Thus, the mean analysis suggests that for this evaluation criterion the respondent’s opinion is quite close to “Met expectation”.
For the functionality parameterization evaluation item, by analyzing Table 6, once again it is noted that 18 activities have grades which are equal or greater than 3, and 10 activities with grades which are lower than 3, which suggests that similarly to the ease of use criterion, the respondent’s opinion is quite close to “met expectation”. The difference between the extremes is 3.23 (maximum) and 2.55 (minimum).
For the need for functionality customization evaluation item in the Table 6 analysis, only 6 activities have grades equal to or greater than 3 and had 22 activities with grades lower than 3. The respondent’s opinion is slightly below “Met expectation”. The difference between the extremes is 3.63 (maximum) and 2.40 (minimum).
Finally, the training received evaluation item is analyzed. By analyzing Table 6, it is noted that only 2 activities show notes that are equal to or greater than 3 and 26 activities show grades that are lower than 3. For this criterion, the respondent’s opinion is below “met expectation”, although the differences between the extremes of 2.15 (maximum) and 2.44 (minimum) is not big.
Table 6 summarizes the results of the analyses performed
Mean Needs being
met Ease of use Parameterization Customization Training
3 or above 22 18 18 6 2
Below 3 6 10 10 22 26
Max. Min. Max. Min. Max. Min. Max. Min. Max. Min. Grades
3.38 2.64 3.30 2.40 3.23 2.55 3.63 2.40 3.15 2.44 Table 6 – Summary of the opinions per evaluation item
Source: Research Data
The results show that needs being met through ERP functionalities is the evaluation item with the highest number of production activities, with mean that is equal to or greater than 3, with 22, followed by ease of use and parameterization performed, both with 18, followed by customization needs with 6, and training received with only 2. Thus, it is possible to verify that, in the respondents´ opinions, training received and need for functionality customization are the most critical items in the implementation and use of ERP in the production area, which confirms what is proposed by Azevedo Junior and Campos (2008) and Bervian (2004) regarding customizations and Silva (2005) regarding training.
Also, it is possible to verify that the opinions for the 4 evaluation items surveyed, regarded as independent variables (needs being met through ERP functionalities, functionality ease of use, parameterization performed in functionality, need for functionality customization and training received) have significant differences among themselves. Initially, the mean and standard deviation of each were verified according to what is shown in Table 7.
Ease of use Parameterization Customization Training
Mean 3.04 3.04 2.83 2.81
Standard Deviation 0.82 0.78 0.90 0.80
Table 7- The mean and standard deviation for the 4 evaluation items Source: Research Data
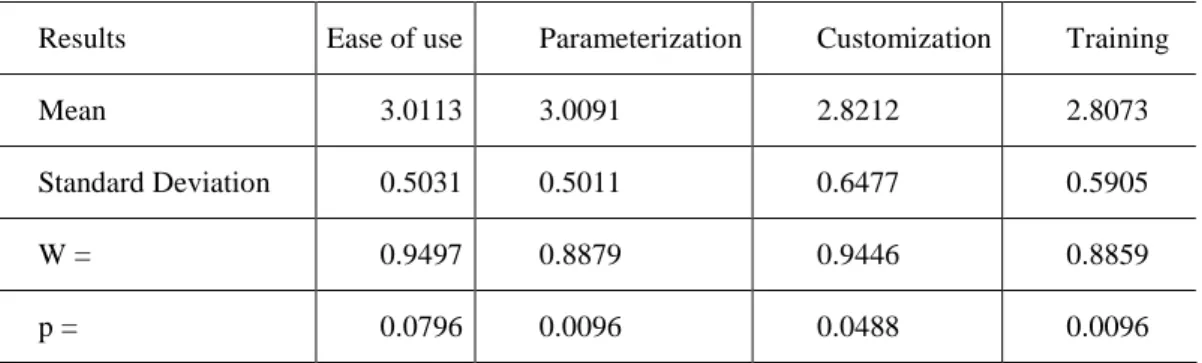
By using more consistent statistical methods, data normality was verified through the Shapiro Wilk test, which is recommended for samples between 2 and 51 respondents.
Results Ease of use Parameterization Customization Training
Mean 3.0113 3.0091 2.8212 2.8073
Standard Deviation 0.5031 0.5011 0.6477 0.5905
W = 0.9497 0.8879 0.9446 0.8859
p = 0.0796 0.0096 0.0488 0.0096
Table 8 - Shapiro Wilk test for the 4 evaluation items Source: Research Data
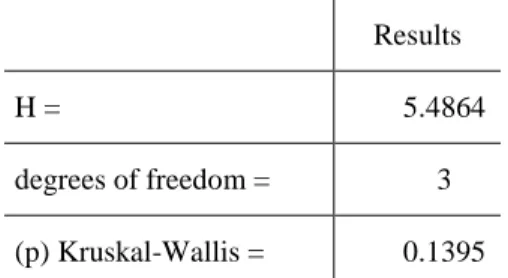
Results
H = 5.4864
degrees of freedom = 3 (p) Kruskal-Wallis = 0.1395
Table 9 - the Kruskal Wallis test for the 4 evaluation items
Source: Research Data
Thus, there are no significant differences verified in the answers for the four evaluation items surveyed for this sample, according to Table 9.
The data collected also allows for another sequence of analyses. Similarly to the evaluation items verified for each production activity, corresponding analyses will be performed this time by grouping the activities in functional dimensions previously defined.
Mean and Standard Deviation
Activity Companies that use them Functional Dimension N ee d s B ei n g M et E as e o f U se P ar am et er iz at io n C u st o m iz at io n T ra in in g
P01 Order Point 31
P02 Economic Order Quantity 13
P03 Safety Stock 36
P04 Current Balance 44
P05 ABC Classification 13
P06 Just In Time 15
P07 Net requirements 39
Inventorys 3.13 0.82 3.08 0.83 3.09 0.76 2.80 0.90 2.82 0.80
P08 Sales Forecasts 19
P09 Seasonalities and Trends 11 P10 Historical Demand Data 33 P11
Simulation through sales
orders 19
Previsões 3.11 0.90 3.06 0.88 3.02 0.79 2.82 1.01 2.70 0.91
P12 MRP-based Need 27
P13 Purchase Orders 27
P14 Work Orders 30
P15
Inbound and outbound of
materials 38
P16 Production Master Plan 13
MRP 3,26
0.69 3.19 0.73 3.11 0.75 2.96 0.82 2.91 0.73
P17 Production Needs 24
P18 Work Order Allocation 10
P19 Sequencing Scheduling 13
P20 Machine Load 9
P21 GANT Chart 5
P22 Lead Time Need 31
P23 W.O. through the Economic Production
Quantity 13
P24 Production capacity 19 P25
Shop floor planning and
control 15
P26
Rescheduling according to
sales order 22
P27 Needs for simulations 15 P28 Supervisor System 8
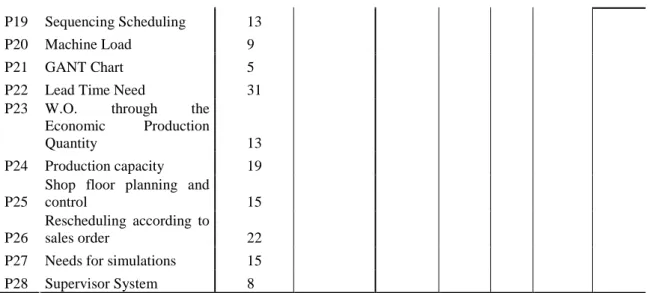
Table 10: Mean and standard deviations of functional dimensions Source: Research Data
Table 10 presents mean and standard deviations for the five evaluation criterion. In order to be easily visualized, a summary is found in Table 11:
Mean Needs being met Ease of use Parameterization Customization Training
MRP 3.26 3.19 3.11 2.96 2.91
Inventory 3.13 3.08 3.09 2.80 2.82
Forecast 3.11 3.06 3.02 2.82 2.70
MRP II 2.99 2.87 2.94 2.78 2.77
Table 11 – Summary of the mean and deviations standards of the functional dimensions Source: Research Data
By analyzing Table 11, MRP functional dimension is the one that shows the best mean, followed by inventory management policy, while forecasts and MRP II show the worst mean.
The best mean was obtained through the needs being met by ERP for the MRP activity (3.26 in Table 20) and the worst mean was obtained in the training item for the forecasts activity (2.70 in Table 20).
again, they best meet the needs of production managers.
Customization and training criteria do not show any mean which is greater than 3, which suggests that, once again, that these could be the points which least meet the needs of production managers.
Another possible verification is analyzing whether the functional dimensions (Inventory Management Policies, Forecasts, MRP and MRP II) show significant differences among themselves, for the needs being met through ERP functionalities evaluation item. Initially, the mean and standard deviations for the four functional dimensions were calculated, for the needs being met through ERP functionalities evaluation item, according to Table 12.
Inventories Forecasts MRP MRPII
Mean 3.06 2.83 3.07 2.68
Standard Deviation 0.56 1.09 0.85 1.04
Table 12: Mean and standard deviation for the 4 functional dimensions Source: Research Data
By using statistical methods, data normality was verified through the Shapiro Wilk test, which is recommended for samples between 2 and 51 respondents, shown in Table 13:
Results Inventories Forecasts MRP MRPII
Mean 3.0618 2.8351 3.0783 2.6857
Standard Deviation 0.5622 1.0966 0.8594 1.0402
W = 0.8405 0.8456 0.7632 0.7953
p = 0.0091 0.0091 0.0082 0.0086
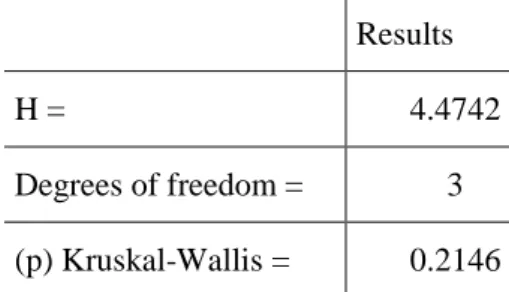
Since the groups do not present normality, as shown in Table 13, the Kruskal Wallis test, or H test, was applied. Thus, the following is obtained:
Results
H = 4.4742
Degrees of freedom = 3
(p) Kruskal-Wallis = 0.2146
Table 14 - Kruskal Walis Test for the general needs being met
Source: Research Data
It is possible to verify, through the results shown in Table 14, that there are no significant differences in the answers for this evaluation criterion in the four functional dimensions studied.
5. CONSIDERATIONS AND RECOMMENDATIONS
The purpose of this work was to identify the production area user opinions about needs being met related to the production area, considering the literature on the functionalities offered by ERP systems. Generally speaking, the result through the companies of the sample studied shows that ERPs meet the needs, according to expectations.
The answers collected were analyzed according to the number of evaluations received for the production activities evaluated in the literature in which a rating 3, which represents “met expectation”, as reflected in approximately 65% of the answers.
During the process of tabulating the data collected, it was possible to note that the companies do not use the same number of ERP functionalities to perform their production activities, where the most used one was the “current balance”, with 44 companies that use this functionality within ERP and the least used was the “Gant Chart”, with only 5 of them. Comparatively, it was noted that only one of the companies surveyed answered that it uses all the production activities asked within ERP, while one of them uses only 2 of these functionalities. Finally, the data organization also suggests that the more the ERP functionalities are used, while companies use ERP the most, the higher the evaluation mean.
Production activities addressed by ERP functionalities were evaluated according to five different evaluation items (needs being met through ERP functionalities, functionality ease of use, parameterization performed in functionality, need for functionality customization and training received).
functionality ease of use and parameterization performed in functionality items obtained 18 mean which is equal to or greater than 3, (iii) the need for functionality customization item obtained 3 mean which is equal to or greater than 3 and (iv) the training received item obtained 2 mean which is equal to or greater than 3. Thus, it is possible to verify that, in the respondent’s opinion, training received and the need for functionality customization are the items with the lowest mean, which suggests that they are the ones worthy of the most attention in ERP implementation and use, confirming the propositions by Azevedo Junior and Campos (2008) and by Bervian (2004) about customization and by Silva (2005) about training.
In general, no activity obtained a rating 4 (which mean slightly above the expected) or a rating 2 (which mean slightly below the expected) in any of evaluation items studied.
The Kruskal-Wallis test suggests that there are no significant differences in the answers among the four evaluation items regarded as independent variables.
The mean obtained was also analyzed for the four functional dimensions (Inventory Management Policy, Forecasts, MRP and MRP II) where it was possible to verify that the MRP followed by inventory management policy are the ones with the best mean for all of the evaluation items surveyed, which suggest that they are more adjusted to the production managers’ needs, while forecasts and MRP II show the worst mean. Similarly to what occurs in the four evaluation items, when it comes to functional dimensions, the Kruskal-Wallis test suggests that there are no significant differences for the functional dimensions studied.
Also, the percentage usage of the activities grouped by functional dimensions by use order was seen as follows: Inventory Management Policies – 59.3%, MRP – 58.7%, Forecasts- 44.5% and MRP II - 33.3%. These data are in agreement with the study by Mesquita and Castro (2008) which showed that most of the companies studied use MRP, but not MRP II.
The analysis of the managers´ opinion about the needs being met through ERP, considering the type of production adopted by the company, suggests that the mean obtained by the companies that produce for stock is greater than the mean obtained by companies that produce for special orders; and the analysis, considering the number of functionalities used by the company, suggests for the sample studied, that the more functionalities the company uses the greater the mean related to the needs being met. It is important to highlight that the result investigated in this research, as to the needs being met, represent exclusively the opinion of production managers from the surveyed companies and in their respective departments.
The most noteworthy result was the low level of execution (less than half) of the activities related to the area of production within the ERP systems. Although Davenport (1998 and 2002), Souza and Zwicker (2000) warn of the difficulty in implementing and using ERPs, it was expected that companies that adopted them could obtain maximum benefit from their functionalities.
their systems, and, as a consequence, they may also improve the opinion of managers in the areas of production and materials from companies that use them.
The number of questionnaires received (a total of 46) limited the use of possible statistical methods for the realization of the result analyses procedure. Since this type of work focused on the manager in the area of production in industrial companies that use ERP in the State of São Paulo, it is believed that the number of answers received occurs due to the difficult access to this professional, in addition to the submission of the survey initially being sent by email. The research instrument may have influenced the high homogeneity occurred in the answers due to its size: 28 assertions related to the production activities, with 5 evaluation criteria in each one of them. It is understood that a possible tendency to repeat the evaluations among the 5 evaluation items questioned may exist. Despite such limitations, this survey´s results present indications to be confirmed in future studies, since the verified data cannot be generalized.
Future studies may verify some of the possible reasons for the low use of ERP functionalities, which may be the lack of preparedness that companies have in relation to the use of ERP (Souza and Zwicker 2000); the unsuitability of the company´s processes to the ERP process (Davenport, 1998), together with the option of not customizing the system (Bervian, 2004, Mendes and Escrivão Filho, 2007, Azevedo Junior and Campos, 2008) or even the lack of proper training for acceptance and use of the system (SILVA, 2005). Also, there is the possibility that the company has not chosen the system that best suits its work system (Mendes and Escrivão Filho, 2007) or even that the production managers are pressed to use ERP not to hurt the systemic integrity, since ERP is based on a single databank throughout the company (Davenport, 1998, souza, 2000, Gupta and Kohli, 2006), and they end up using only part of the system for this purpose, not using other functionalities aimed specifically at production. Another suggestion is that other similar research be done for other functional departments of the company, such as finance, comptrolling, people management, etc.
REFERENCES
Aghazadeh, S.-M. (2003). MRP contributes to a company’s profitability. Assembly
Automation, 23(3): 257–265.
Azevedo, D. P. J., & Campos, R. de. (2008). Definição de Requisitos de Software Baseada Numa Arquitetura de Modelagem de Negócios. Produção, 18(1): 026-048.
Babbie, E. (2003). Métodos de Pesquisa de Survey. Belo Horizonte: Ed. EFMG.
Barrela, W. D. (2000). Sistemas Especialistas Modulados e Abrangentes para a Gestão
de Operações. Tese de Doutorado, Engenharia, Escola Politécnica da Universidade de
São Paulo,São Paulo, Brasil.
Bervian, A. E. (2004). Critérios para a Decisão de Personalização de Processos na
Implantação de Sistemas ERP. Trabalho de Conclusão de Curso, Universidade do Vale
Berretta, R. E. (1997). Heurística para otimização do Planejamento da Produção em
Sistemas MRP. Tese de Doutorado, Engenharia Elétrica, Universidade Estadual de
Campinas, São Paulo, Brasil.
Bido, D. de S. (2004). O Ensino da Administração da Produção e Operações na Cidade
de São Paulo: Um Estudo Comparado de Programas e Livros Didáticos Utilizados nos Cursos de Graduação em Administração de Empresas. Tese de doutorado,
Administração, Faculdade de Economia, Administração e Contabilidade da Universidade de São Paulo, São Paulo, Brasil.
Busetti, M. A. de P., & Santos, E. A. P. (2008, Jan-Abr.). Uma Abordagem Metodológica para o Desenvolvimento de Sistemas Automatizados e Integrados de Manufatura. Produção, 18(1): 008-025.
Cardoso, D., Silva, M. C. N, & Souza, A. A. de . (1999). Administração da Produção através do Sistema de Gestão Integrada SAP R/3: O Caso da Siderúrgica Belgo Mineira.
Anais XIX ENEGEP - Encontro Nacional de Engenharia de Produção, Rio de Janeiro,
RJ. CD-ROM do XIX Encontro Nacional de Engenharia de Produção.
Corrêa, H. L., & Gianesi, I. G. N. (1994). Just In Time, MRPII e OPT – Um Enfoque
Estratégico. São Paulo: Atlas.
Davenport, T. H. (1998, July-August). Putting the Enterprise into the Enterprise System.
Harvard Business Review:121-131.
______. (2002). Missão Crítica – Obtendo Vantagem Competitiva com os Sistemas de
Gestão Empresarial. Porto Alegre: Bookman.
Davis, M. M., Aquilano, N. J., & Chase, J. H. (2001). Fundamentos da Administração
da Produção (3a ed.). Porto Alegre: Bookman.
Fransoo, J. C., & Wiers, V. C. S. (2008). An Empirical Investigation of the Neglect of MRP Information by Production Planners. Production Planning & Control, 19: 781-787.
Gaither, N., & Fraizer, C. (2002). Administração da Produção e Operações (8a ed.). São Paulo: Thomson.
Grilo, T. F. J., Pereira, A. P. T., & Villar, A. de M. (2008). Automação industrial com uso da Manufatura Integrada por Computador (CIM). Anais 5º Congresso Internacional
de Gestão de Tecnologia e Sistemas de Informação – CONTECSI, São Paulo, SP. 5º
Congresso Internacional de Gestão de Tecnologia e Sistemas de Informação - CONTECSI: Centrográfica Gráfica & Editora Ltda.
Gupta, M., & Kohli, A. (2006). Enterprise Resource Planning Systems and its Implications for Operations Function. Technovation: 687–696.
Joaquim, R. C. (2006). Novas Tecnologias para Comunicação entre o Chão de Fábrica
e o Sistema Corporativo. Dissertação de Mestrado, Engenharia Mecânica, Escola de
Engenharia de São Carlos da Universidade de São Paulo, São Paulo, Brasil.
Lima, J. C. S. (2004). Um Estudo Sobre a Reconfiguração da Função Compras em
Empresas do Setor Automotivo. Tese de Doutorado, Escola Politécinca da Universidade
Martins, P. G., & Laugeni, F. P. (1998). Administração da Produção. São Paulo: Saraiva.
Marins, F. A. S., & Padilha, T. C. C. (2005, Jan-Abr). Sistemas ERP: características, custos e tendências. Produção, 15(1):102-113.
Massote, A. A., Maria, G. B. A., & Takagochi, V. (2005, Out-Nov). Modelo de Integração de Sistemas de Gestão ERP com a Produção. Anais XXV Encontro Nac. de
Eng. de Produção, Porto Alegre, Brasil.
Mendes, J. V., & Escrivão, E. (2007, Maio-Ago). Atualização Tecnológica em Pequenas e Médias Empresas: Proposta de Roteiro para Aquisição de Sistemas Integrados de Gestão (ERP). Gestão e Produção, 14(2): 281-293.
Mesquita, M. A. de, & Castro, R. L. de. (2008). Análise das práticas de planejamento e controle da produção em fornecedores da cadeia automotiva brasileira. Gestão e
Produção, 15(1): 33-42.
Meredith, J. R., & Shafer, S. M. (2002). Administração da Produção para MBAs. Porto Alegre: Bookman.
Peixoto, E. C., & Pinto, L. R. (2006, Set-Dez). Gerenciamento de Inventorys via Forecasts de Vendas Agregadas Utilizando Simulação. Produção, 16(3): 569-581.
Ritzman, L. P., & Krajewski, L. J. (2002). Administração da Produção e Operações. São Paulo: Prentice-Hall.
Santoro, M. C., & Freire, G. (2008, Jan-Abr). Análise Comparativa entre modelos de Inventory. Produção, 18(1): 89-98.
SEllitto, M. A., & Bochardt, M., & Pereira, G. M. (2008). Medição de Tempo de Atravessamento e Inventário em Processo em Manufatura Controlada por Ordens de Fabricação. Produção, 18(3): 493-507.
Silva, A. L. M. R. da. (2005). A influência do Treinamento de Usuários na Aceitação de
Sistemas ERP em Empresas no Brasil. Dissertação de Mestrado, Administração,
Universidade Federal do Rio de Janeiro, Rio de Janeiro, Brasil.
Silva, O. S. F., & Cezarino, W. (2007, Maio-Ago). Gestão de Planos de Produção via Otimização Subótima. Gestão e Produção, 14(2): 239-252.
Slack, N., Chambers, S., & Johnston, R. (2002). Administração da Produção. São Paulo: Atlas.
Souza, C. A., & Zwicker, R. (2000). Implementação de Sistemas ERP: um estudo de casos comparados. Anais. Encontro Nacional de Pós-Graduação em Administração, Florianópolis, Brasil. Rio de Janeiro: ANPAD.
______. (2000). Sistemas Integrados de Gestão Empresarial: Estudos de Caso de
implantação de Sistemas de ERP. Dissertação de Mestrado, Faculdade de Economia,
Administração, e Contabilidade da Universidade de São Paulo, São Paulo, Brasil.
Brasil.
Wanke, P. (2008). Forecasts top-down ou bottom-up? Impacto nos níveis de erro e de Inventorys de segurança. Gestão e Produção, 15(2): 231-245.
Werner, L., & Ribeiro, J. L. D. (2006). Modelo Composto para Prever Demanda Através da Integração de Previsões. Produção, 16(3): 493-509.