ADILSON CARLOS YOSHIKUNI [email protected] Professor da Fundação Getulio Vargas, Escola de Administração de Empresas de São Paulo – São Paulo – SP, Brazil
ALBERTO LUIZ ALBERTIN [email protected]
Professor da Fundação Getulio Vargas, Escola de Administração de Empresas de São Paulo – São Paulo – SP, Brazil
FORUM
Submitted 06.29.2016. Approved 02.08.2017
Evaluated by double blind review process. Scientiic Editors: Adriana Roseli Wünsch Takahashi, Sergio Bulgacov, Claudia Cristina Bitencourt and Hale Kaynak
IT-ENABLED DYNAMIC CAPABILITY ON
PERFORMANCE: AN EMPIRICAL STUDY OF
BSC MODEL
Capacidade dinâmica de TI e desempenho: Um estudo empírico do modelo BSC
Capacidad dinámica de TI y desempeño: Estudio empírico del modelo BSC
ABSTRACT
Few studies have investigated the inluence of “information capital,” through IT-enabled dynamic capability, on corporate performance, particularly in economic turbulence. Our study investigates the causal relationship between performance perspectives of the balanced scorecard using partial least squares path modeling. Using data on 845 Brazilian companies, we conduct a quantitative empirical study of irms during an economic crisis and observe the following interesting results. Operational and analytical IT-enabled dynamic capability had positive efects on business process improvement and corporate performance. Results pertaining to mediation (endogenous variables) and moderation (control variables) clarify IT’s role in and beneits for corporate performance.
KEYWORDS | Corporate performance, information technology, dynamic capability, business process improvement, economic turbulence.
RESUMO
Poucos estudos já investigaram a influência do “capital de informação”, através da capacidade dinâmica de TI, sobre o desempenho corporativo, particularmente em uma turbulência econômica. Nosso estudo investiga a relação causal entre perspectivas de desempenho do balanced scorecard, utilizando modelagem de caminho pelos mínimos quadrados parciais. Utilizando dados sobre 845 empresas brasileiras, desenvolvemos um estudo empírico quantitativo com empresas durante uma crise econômica, e observamos os seguintes resultados de interesse: a capacidade dinâmica de TI operacional e analítica teve efeitos positivos na melhoria dos processos de negócios e no desem-penho corporativo; os resultados relacionados à mediação (variáveis endógenas) e à moderação (variáveis de controle) esclarecem o papel da TI e seus benefícios para o desempenho corporativo.
PALAVRAS-CHAVE | Desempenho corporativo, tecnologia da informação, capacidade dinâmica, melho-ria de processos de negócios, turbulência econômica.
RESUMEN
Pocos estudios han investigado la influencia del “capital de la información”, a través de la capacidad dinámica posibilitada por TI, sobre desempeño corporativo, especialmente en turbulencia económica. Nuestro estudio investiga la relación causal entre perspectivas de desempeño del balanced scorecard usando el modelado path de mínimos cuadrados. Utilizando datos sobre 845 empresas brasileñas, conducimos un estudio empírico cuantitativo de firmas durante una crisis económica y observamos los siguientes resultados interesantes. La capacidad operativa y analítica posibilitada por TI tuvo efectos positivos en la mejora de procesos empresariales y desempeño corporativo. Los resultados referentes a mediación (variables endógenas) y moderación (variables de control) aclaran el papel de TI y beneficios en el desempeño corporativo.
PALABRAS CLAVE | Desempeño corporativo, tecnología de la información, capacidad dinámica, mejora de procesos empresariales, turbulencia económica.
INTRODUCTION
The resource-based view (RBV) and information technology (IT)
business alignment approaches dominate IT literature (Schwarz,
Kalika, Kei, & Schwarz, 2010). RBV theory (Barney, 1991) has a static aspect, characterized by inability to obtain resources to enable sustainable competitive advantage (Barney & Clark, 2007).
Dynamic capability (DC) arises from the RBV on environmental prospects that have a high change rate, enables
complementary resources (Ambrosini & Bowman, 2009;Helfat
et al., 2009; Wade & Hulland, 2004), and reconigures resources to meet requirements and changes in external and internal environments (Teece, 2009, 2014; Teece, Pisano, & Shuen, 1997). Since 2015, Brazilian companies have faced political and economic crises. Economic turbulence was negative (−3.8%) in 2015
(Instituto Brasileiro de Geograia e Estatística [IBGE], 2016), and the forecast for 2016 shows no change. In 2015, 580,000 companies ceased activity (IBGE, 2016) and listed companies’ revenues fell by 5.4% from 2014 to 2015 according to the Economatica System. In 2015, IT spending increased to 7.6% of Brazilian
companies’ revenues (GVCia, 2015). Per Albertin and Albertin
(2016), during the economic crisis, IT investments were made to achieve eiciency and eicacy and promote productivity.
Per Augier and Teece (2009), managers must build dynamic capabilities to sense and seize opportunities, transforming and reconiguring as opportunities and competitive forces dictate.
Raschke (2010) suggests that IT-enabled dynamic capability (ITDC) allows organizations to design and reconigure processes
to improve eiciency, enabling new business forms (Anderson,
Banker, & Ravindran, 2006), and to influence corporate performance (Brynjolfsson & Hitt, 1996; Stoel & Muhanna, 2009) and react to changing business conditions and corporate strategies under economic pressure (Kim, Shin, Kim, & Lee, 2011; Weill, Subramani, & Broadbent, 2002).
Since the 1990s, most corporate performance studies
have increased used the balanced scorecard (BSC) of Kaplan
and Norton (1992). As of May 2016, their paper, “The balanced scorecard: Measures that drive performance” (Kaplan & Norton, 1992), has been cited more than 1,945 times, per the Web of Science’s Scholarly and Scientiic Research. Some studies (Bento, Bento, & White, 2013) estimate that 60–70% of large organizations in the private, public, and nonproit sectors have adopted the BSC. Kaplan (2010) highlights future opportunities to statistically investigate causal relationships among BSC perspectives and objectives, helping irms understand and use dynamic causal models efectively to guide strategies and operations.
This study investigates the relationship between ITDC, business process improvement (BPI), customer performance
(CP), and inancial performance (FP), using the BSC model to help managers understand ITDC’s role in corporate performance during economic turbulence. We validate analytical and operational ITDC as a irst-order construct, analyzing the mediation of all endogenous variables and checking the inluences of control variables (sector and irm size) on the relationships between all latent variables. Figure 1 depicts our ITDC model of corporate performance measured using the BSC method.
Figure 1.
Proposed ITDC model of corporate performance
Control variables
IT-enabled dynamic capability
Business process improvement
Customer
performance performanceFinancial
THEORY AND HYPOTHESIS
DEVELOPMENT
This section describes dynamic capability, IT-enabled dynamic capability, operational IT, analytical IT, and the BSC model.
Dynamic capability
DC originates in RBV theory (Wang & Ahmed, 2007), encouraging eicient resource management to improve business processes
(Grant, 2010) by choosing an activity set with a unique value combination (Kaplan & Norton, 2000). Per the RBV, sustained competitive advantage comes from unique, distinguishing resources that may be valuable, rare, non-replicable, and non-substitutable
(Birkinshaw & Goddard, 2009; Wade & Hulland, 2004).
The heterogeneity and immobility of certain resources make it diicult to obtain DC in volatile environments and conditions
(Wade & Hulland, 2004).
Several studies have highlighted irm-level DC development relating to challenging external and internal environments (Augier & Teece, 2009; Eisenhardt & Martin, 2000; Helfat & Peteraf, 2009; Helfat & Winter, 2011; Teece et al., 1997). This capability includes the ability to react dynamically through internal activities
2005; Wang & Ahmed, 2007; Zahra, Sapienza, & Davidson, 2006), allowing an organization to reconigure resources and organizational capability (Ambrosini & Bowman, 2009; Helfat & Peteraf, 2009;Meirelles & Camargo, 2014; Teece, 2014).
We deine DC as a irm’s ability to develop or maintain competitive advantage using its essential competence and collective ability to innovate, coordinate, and reconigure internal resource skills. Thereby, the irm improves business processes, meets market challenges, and inluences corporate performance under economic turbulence.
IT-enabled dynamic capability
Most IT research deines IT resources and their relationship with competitive advantage, business strategy, and corporate performance (Davenport & Harris, 2007; Davenport, Harris, & Morison, 2010; Helfat & Winter, 2011; Kim et al., 2011; Wade & Hulland, 2004). Bharadwaj (2000) claims that IT enables DC, promoting BPI. IT integrates, builds, and reconigures internal competencies in value chain activities (Davern & Wilkin, 2010; Kim et al., 2011; Raschke, 2010). Its beneits lead to competitive advantage (Bhatt & Grover, 2005; Schwarz et al., 2010;Stoel & Muhanna, 2009).
IT use leads to operational (Bhatt & Grover, 2005;Melville, Kraemer, & Gurbaxani, 2004; Schwarz et al., 2010) and analytical beneits (Arnott & Pervan, 2014; Davenport & Harris, 2007; Davenport et al., 2010;Nudurupati, Bititci, Kumar, & Chan, 2011; Ramdani, 2012; Wade & Hulland, 2004), and inluences BPI and corporate performance (Kohli, Devaraj, & Ow, 2012; Melville, Kraemer, & Gurbaxani, 2004; Nudurupati, Bititci, Kumar, & Chan, 2011).
We deine ITDC as a irm’s ability to change (improve, adapt, or reconigure) a business process better than competitors by integrating activities, reducing cost, and capitalizing on business intelligence/learning (Schwarz et al., 2010).
Operational IT
Operational IT is categorized into technological infrastructure
and transactional applications (Chuang, 2004; Maçada,
Beltrame, Dolci, & Becker, 2012; Sobol & Klein, 2009) and automates activities (Otim, Dow, Grover, & Wong, 2012; Shang & Seddon, 2002).
Technological infrastructure enables connections between companies, information sharing, and data structuring, and deploys IT business value across an enterprise (Bhatt & Grover, 2005; Weill et al., 2002). Communication enabled by IT infrastructure among functions generates DC, which provides integration, lexibility, standardization, and business agility, and reduces IT cost.
IT transactional applications automate operational tasks and generate information, which ellucidates the activities through
which a irm makes and delivers business value (O’Brien &
Marakas, 2007; Ravichandran & Lertwongsatien, 2005; Shang & Seddon, 2002). DC enabled by IT business value uses technology to process and automate basic repetitive transactions and create information availability for business management (Raschke, 2010). IT in material requirement planning (MRP) designs, monitors, and controls loor shop routines, generating agility, lexibility, simulation power, and control, thereby recommending “what, when, and how” for production and “what, when, and where” for supplies and raw materials purchasing.
Analytical IT
Analytical IT enables tactical and strategic decision-making. Per Davenport and Harris (2007) and Davenport et al. (2010), management uses IT to provide analyses, data, and systemic knowledge for organizational processes and decision-making.
Tactical IT capability improves information quality, deined by accessibility, accuracy, and lexibility (Chuang, 2004; Maçada et al., 2012; Sobol & Klein, 2009). IT provides and uses information for the planning, execution, and control of activities (Arnott & Pervan, 2005, 2014;Singh, Watson, & Watson, 2002). IT provides information to run a irm and achieve objectives and targets
(Arnott & Pervan, 2014), enabling analysis and measurement of time variations, and redirecting actions that contribute to operational productivity (Kaplan & Norton, 2008).
Strategic IT capability contributes to competitive advantage
development (Melville et al., 2004) and helps increase market
share. Strategic IT applications relate to a irm’s core business, enabling a irm to competitively diferentiate by aligning to
customer needs (Ramdani, 2012).
Organizations react to external environments and create performance management models to understand and adapt
(Kaplan & Norton, 1996). The relationship between external factor stimuli and strategy development is relevant to acquisition and creates IT capabilities (Kaplan & Norton, 2000). The performance
management model of BSC proposed by Kaplan and Norton
(1996, 2000, 2004, 2008) shows that IT enables organizations to respond to external and internal challenges through operational business processes, such as innovation, operation, and post-sale.
Lertwongsatien, 2005; Sen, Bingol, & Vayvay, 2017) to enable operational dynamic capability in the BSC model.
H1: Operational IT-enabled dynamic capability is positively associated with business process improvement.
External factors’ impact on competitive advantage and irm performance depends on how irms develop dynamic capabilities for using management resources (Augier & Teece, 2009). Through information systems, IT enables managers to use performance
management models (O’Brien & Marakas, 2007) such as the
BSC systems to develop dynamic capabilities for responding to external changes (Sen et al., 2017). Per Kaplan and Norton (2000, 2008), strategic maps, dashboards, cockpits, and performance reports provide information to develop knowledge and provide intelligence to managers for decision-making. Organizational IT resources transform and create ways to run business processes
(Henderson & Venkatraman, 1999) by developing new products and services or making eiciency gains (Maçada et al., 2012). IT is used in strategic processes to generate DC, which diagnoses, plans, formulates, and implements business strategies with lexibility, thus adapting, transforming, and achieving business process improvement in the BSC model (Arnott & Pervan, 2014; Ramakrishnan, Jones, & Sidorova, 2012).
H2: Analytical IT-enabled dynamic capability is positively associated with business process improvement.
We describe ITDC’s principal contributions (Schwarz et
al., 2010) and BSC (Kaplan & Norton, 1996), presenting IT as a resource that enables dynamic capabilities in business process improvement to achieve performance. We focus on the inluence of “information capital provided by the BSC” because analytical and operational ITDC runs across all activities in the value chain. We concentrate on technology beneits ofered and delivered by IT (Henderson & Venkatraman, 1999; Kohli & Grover, 2008; Otim et al., 2012; Poelmans, Rejers, & Recker, 2013; Tallon, 2008) to enable DC to achieve BPI (Helfat & Winter, 2011; Kim et al., 2011; Melville et al., 2004; Raschke, 2010; Schwarz et al., 2010); to respond to market challenges and develop internal competencies
to innovate, coordinate, and reconigure processes (Ambrosini
& Bowman, 2009; Teece et al., 1997); and to inluence multiple corporate performance perspectives (Devaraj & Kohli, 2000, 2003; Henderson, Kobelsky, Richardson, & Smith, 2010; Kohli, Devaraj, & Ow, 2012;Santos, Zheng, Mookerjee, & Chen, 2012; Teece, 2009).
Balanced scorecard model
The BSC is an integrated framework to track inancial and nonfinancial indicators, helping an organization align its
initiatives with strategy and achieve corporate performance
(Bento et al., 2013; Brito & Brito, 2012; Kaplan, 2010; Sen et al., 2017;Yoshikuni & Albertin, 2014). Corporate performance is
measured from the multidimensional prism perspective (Najmi,
Etebari, & Emami, 2012), through inancial and noninancial measures (Ouakouak & Ouedraogo, 2013; Santos-Vjande, López-Sánchez, & Trespalacios, 2012) of causal relations, within and between strategy objectives that culminate in FP.
Senior managers have focused on understanding how FP is created by identifying, measuring, and managing long-term shareholder value drivers (Brito & Brito, 2012; Bryant, Jones, & Widener, 2004; Jordão & Novas, 2013; Sen et al., 2017). Increased proitability results from revenue growth and spending
reduction (cost, expenses, and asset use) (Atkinson, Kaplan,
Matsumura, & Young, 2011). Revenue growth is necessary to satisfy clients; managerial actions and decisions can increase productivity. Proits could increase indirectly through production, increasing market share and generating higher
revenues and lower operational spending (Kaplan & Norton,
2008; Papke-Shields, Malhotra, & Grover, 2006). To achieve BPI, an organization must develop intangible asset capability in information capital, human capital, and organization capital
(Kaplan & Norton, 2004).
The BSC model describes causal relationships between performance measures by considering strategic business goals from four perspectives: inancial, customer, business processes,
and learning and growth. We draw on Kaplan and Norton (2008)
to describe the BSC model’s perspectives.
FP includes the primary objective of sustained shareholder value creation and sub-objectives of revenue growth, productivity, and risk management (Kaplan, 2010). FP relates to the ability to create long-term value for shareholders (Atkinson et al., 2011; Kaplan & Norton, 2008; Kohli et al., 2012;Ouakouak & Ouedraogo, 2013; Santos-Vjande et al., 2012; Yoshikuni & Albertin, 2014).
The conditions that create value for clients impact CP (Kaplan & Norton, 1996;Santos-Vjande et al., 2012). CP is measured by objectives relating to (a) attributes of goods and services, such as price, quality, time, availability, functionality, claims rate, and delivery reliability; (b) relationships with indicators, such as customer retention and partner satisfaction; and (c) image or brand (Kaplan & Norton, 2008; Sila & Ebrahimpour, 2005). CP is the organization’s ability to fulill attributes requested by clients, execute the business value chain’s internal activities (Kaplan & Norton, 2008), and create customer satisfaction, loyalty, and retention (Kaplan, 2010).
end, and identiied inputs and outputs. A business process comprises the value chain’s internal activities, leading to inancial productivity, success, and satisied customers (Jordão & Novas, 2013; Sen et al., 2017). The generic view of the internal business process perspective encompasses the entire internal value chain, decomposed into three processes: innovation, operations, and post-sales (Kaplan & Norton, 2008). Innovation activities focus on identiied markets and customer needs; products and services
meet those needs. Kaplan and Norton (2008) conclude with
post-sales services for operational activities in which the value proposed (products and services) is crafted and delivered to meet customer needs; if needs are unmet, corrective actions are applied to satisfy customers.
Achieving BPI requires learning and growth to develop the organization; employee capabilities and skills, constituting intangible assets; information systems capabilities (IT); and
an enabling corporate climate (Kaplan & Norton, 1996). An
organization must provide employees with opportunities for growth and learning, creating a good work place (Jordão & Novas, 2013). We concentrate “information capital” on ITDC.
H3: Business process improvement is positively associated with customer performance.
H4: Business process improvement is positively associated with inancial performance.
H5: Customer performance is positively associated with inancial performance.
RESEARCH METHODOLOGY
In this section, sample, pilot test, data treatment, and statistical techniques are described.
Sample
The target population comprised organizations from several
sectors, following Ouakouak and Ouedraogo (2013). We used
research methods for business (Sekaran, 2000) and the
recommendation of Tallon, Kraemer, and Gurbaxani (2000) to
measure IT business value through executives’ perceptions. This method has been used in IT studies (e.g., Kim et al., 2011; Papke-Shields et al., 2006; Powell & Dent-Micallef, 1997), and the key informants were professionals with decision-making ability, including chief executive oicers, vice presidents, directors,
managers, supervisors, coordinators, and business executives involved in management.
We designed a firm-level sample, and respondents were employed professionals taking classes to fulill Master of Business Administration (MBA) degrees (D’Arcy & Devaraj, 2012)
at a university in southwestern Brazil. The high-quality sample consisted of executives with eight to 30 years of experience in executive management.
To evaluate organizations’ aspects accurately, we provided informants a 20-day period to validate survey information with other executives. During this period, respondents could call, email, or consult with us regarding the questionnaire, thereby increasing answer quality. Incomplete questionnaires were invalidated.
The questionnaire contained two sections: demographic and speciic information. The demographic section sought data characterizing the irm and validating participation, including a direct search for secondary data. The speciic information section assessed perception of the research constructs. Demographic information included control variables of sector and irm size (number of employees), incorporated as a moderating variable. The questionnaire’s interval scale contained ive choice categories for each manifest variable, evaluated along a Likert scale: (1) strongly disagree, (2) disagree, (3) neither agree nor disagree, (4) agree, and (5) strongly agree.
Pilot test
Manifest variables were obtained from the literature, as was guidance concerning variables’ content validity, number of
categories for items, and other issues (Hair, Black, Babin,
Andersen, & Tatham, 2009; Sekaran, 2000).
Experts (researchers and professors with more than 12 years of experience) in business strategy and technology pretested the questionnaire. The results were positive and conirmed the questionnaire’s quality. The questionnaire was applied to a sample of 40 organizations, fulilling the minimum
pretesting recommendation of 15 respondents (Malhotra, 2006).
Respondents rated format, ease of understanding content, and other aspects, most of which were acceptable. We incorporated evaluators’ suggestions.
Data treatment
We tested for nonresponse bias, comparing assessments of the pilot test respondents (early) and MBA respondents (late) for all variables. All t-test comparisons between the means of early
and late respondents showed no signiicant diferences (D’Arcy
& Devaraj, 2012). We tested the model with a dummy variable indicating whether a respondent was a pilot test case (40 cases) or MBA. The path from the dummy variable to irm performance was not signiicant (CP β = 0.022, n.s. and inancial performance
β = 0.001, n.s.) (Nitzl & Hirsch, 2013).
The sample size accorded with partial least squares path modeling (PLS-PM) literature (Henseler, Ringle, & Sinkovics, 2009; Sosik, Kahai, & Piovoso, 2009; Urbach & Ahlemann, 2010), which considers the minimum sample size to be 10 times the number of structural paths arriving at a particular relective construct. The minimum sample size was 20. For a more rigorous minimum sample size, we evaluated statistical power using the G*Power 3.1.9.2 software (Faul, Erdfelder, Lang, & Buchner, 2007). We observed two parameters: test power (power = 1 – β error prob. II) and the efect size (f2). Cohen (1988) and Hair, Hult, Ringle, and Sarstedt (2013) recommend a power of 0.80 and median f2 of 0.15.
They note that CP and FP constructs should have two predictors. The minimum sample size suggested by the software was 43, but to increase model consistency, doubling or tripling this value is beneicial (Ringle, Silva, & Bido, 2014). We used a sample of 845, complying with the empirical rule.
Statistical technique
PLS-PM calculates the maximum explained variance of all manifest variables, evaluates the reliability and validity of latent constructs,
and estimates relationships between them (Hair et al., 2013).
PLS-PM addresses situations observed in IT research (Ringle,
Sarstedt, & Straub, 2012): the absence of symmetric variable distributions (or those with little “consolidation”) measured by a still-nascent theory, large data amounts, or limited data amounts. PLS-PM can demonstrate the model’s applicability and robustness
(Ringle et al., 2014).
The PLS-PM technique does not adhere to the normal distribution of data, a set number of data observations and independence, or metric uniformity of the variable (Chin, 1998; Hair et al., 2013). Despite this, we proceeded with caution
and followed the recommendations of Chin (1998) and Hair et
al. (2013) while preparing missing values and checking data distribution and multicollinearity. We used the SmartPLS 2.0 M3 program for PLS-PM (Ringle, Wende, & Will, 2005).
The sample was deined by sector and irm size (number
of employees), following Ray, Wu, and Konana (2009). Table 1
summarizes the sample proile and respondents.
Table 1.
Demographic research
Sector Firm size
Type % (Numbers of employees) %
Agribusiness 4 Up to 250 32
Commerce 10 251 to 500 15
Finance 8 501 to 3000 12
Manufacturing 38 3001 and more 41
Services 40
Measurement model
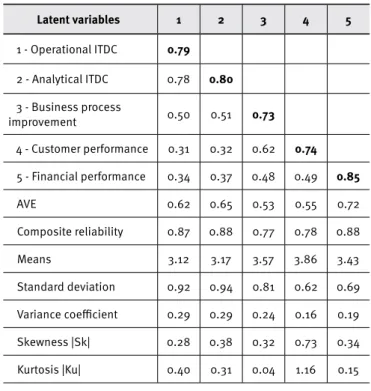
We observe convergent validities by measuring the model’s average variance extracted (AVE). Per the Fornell–Larcker criterion
(Henseler et al., 2009), AVE should exceed 0.50 (Hair et al., 2013; Ringle et al., 2014). Table 2 presents results.
Composite reliability (CR) is the most appropriate measure for PLS-PM because it prioritizes variables by reliability (Ringle et al., 2014). We considered CR values between 0.70 and 0.90 satisfactory (Hair et al., 2013). Table 2 shows that CR values are adequate. We evaluated the variables’ normality by coeicients of skewness (Sk) and kurtosis (Ku), and univariate and multivariate variables showed no severe violation of the normal distribution assumption (|Sk| < 3 and |Ku| < 10) (Marôco, 2010).
Table 2.
Pearson correlation and descriptive statistics of
latent variables
Latent variables 1 2 3 4 5
1 - Operational ITDC 0.79
2 - Analytical ITDC 0.78 0.80 3 - Business process
improvement 0.50 0.51 0.73
4 - Customer performance 0.31 0.32 0.62 0.74 5 - Financial performance 0.34 0.37 0.48 0.49 0.85
AVE 0.62 0.65 0.53 0.55 0.72
Composite reliability 0.87 0.88 0.77 0.78 0.88
Means 3.12 3.17 3.57 3.86 3.43
Standard deviation 0.92 0.94 0.81 0.62 0.69
Variance coeicient 0.29 0.29 0.24 0.16 0.19
Skewness |Sk| 0.28 0.38 0.32 0.73 0.34
To check the model’s discriminant validity, we analyzed cross loads. Table 3 shows that indicators have higher loads for some constructs and lower loads for others, indicating discriminant validity, per Ringle et al. (2014) and Urbach and Ahlemann (2010).
Table 3.
Cross loads to assess discriminant validity
First latent variables Items 1 2 3 4 5
1 - Analytical ITDC
AITDC_1 0.761 0.600 0.378 0.272 0.253
AITDC_2 0.781 0.607 0.377 0.244 0.275
AITDC_3 0.814 0.652 0.411 0.240 0.272
AITDC_4 0.799 0.603 0.424 0.234 0.274
2 - Operational ITDC
OITDC_1 0.604 0.793 0.376 0.284 0.281
OITDC_2 0.619 0.826 0.391 0.245 0.269
OITDC_3 0.641 0.798 0.432 0.207 0.290
OITDC_4 0.639 0.800 0.427 0.298 0.350
3 - Business process improvement
BPI_1 0.389 0.391 0.724 0.399 0.415
BPI_2 0.336 0.318 0.780 0.603 0.360
BPI_3 0.387 0.415 0.676 0.332 0.269
4 - Customer performance
CP_1 0.124 0.128 0.449 0.777 0.403
CP_2 0.214 0.237 0.494 0.806 0.387
CP_3 0.380 0.367 0.442 0.626 0.279
5 - Financial performance
FP_1 0.223 0.242 0.336 0.361 0.830
FP_2 0.328 0.344 0.440 0.427 0.838
FP_3 0.302 0.346 0.437 0.436 0.873
Table 3 shows results generated for cross loads. The indicators have signiicant loads (p-value < 0.001) in their constructs, conirming convergent validity. Discriminant validity is revealed when a load has the highest indicators in its latent variables. We estimated signiicance using the bootstrap method with 845 cases and 2,000 repetitions.
Structural model
To check for multicollinearity, we analyzed variance inlation factors (VIFs) for the FP and CP. The highest VIF is 1.897 for the “Operational ITDC” construct; there is no evidence of multicollinearity among the indicators per the limit recommended (< 5) by Marôco (2010).
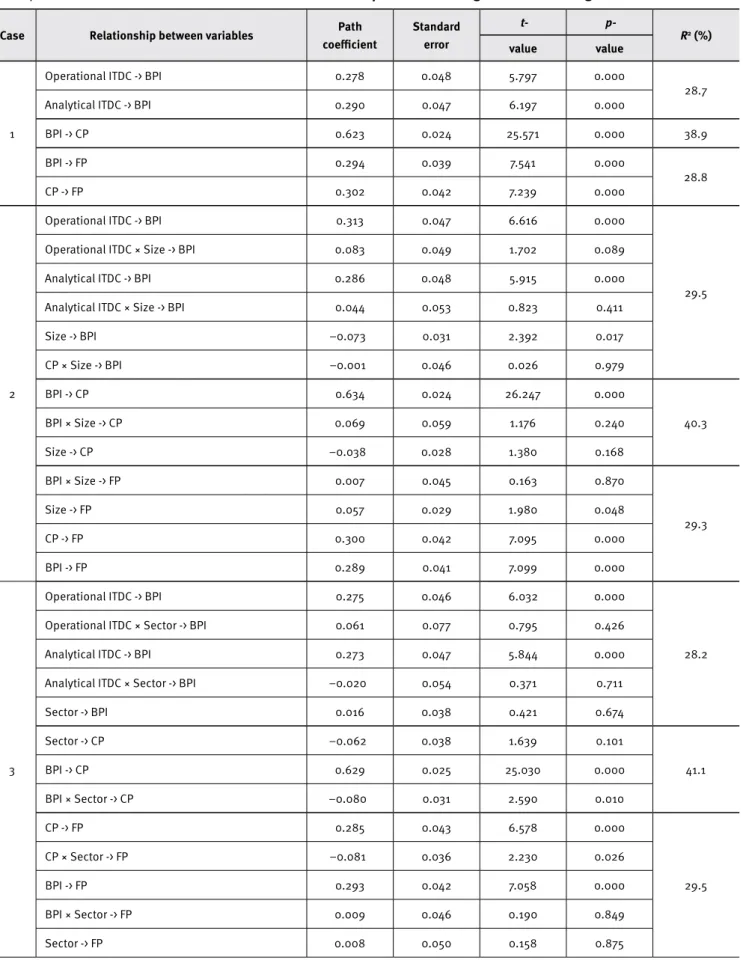
Table 4.
Efects of latent and control variables in relationships between exogenous and endogenous variables
Case Relationship between variables Path coeicient
Standard error
t-
p-R2 (%)
value value
1
Operational ITDC -> BPI 0.278 0.048 5.797 0.000
28.7
Analytical ITDC -> BPI 0.290 0.047 6.197 0.000
BPI -> CP 0.623 0.024 25.571 0.000 38.9
BPI -> FP 0.294 0.039 7.541 0.000
28.8
CP -> FP 0.302 0.042 7.239 0.000
2
Operational ITDC -> BPI 0.313 0.047 6.616 0.000
29.5
Operational ITDC × Size -> BPI 0.083 0.049 1.702 0.089
Analytical ITDC -> BPI 0.286 0.048 5.915 0.000
Analytical ITDC × Size -> BPI 0.044 0.053 0.823 0.411
Size -> BPI −0.073 0.031 2.392 0.017
CP × Size -> BPI −0.001 0.046 0.026 0.979
BPI -> CP 0.634 0.024 26.247 0.000
40.3
BPI × Size -> CP 0.069 0.059 1.176 0.240
Size -> CP −0.038 0.028 1.380 0.168
BPI × Size -> FP 0.007 0.045 0.163 0.870
29.3
Size -> FP 0.057 0.029 1.980 0.048
CP -> FP 0.300 0.042 7.095 0.000
BPI -> FP 0.289 0.041 7.099 0.000
3
Operational ITDC -> BPI 0.275 0.046 6.032 0.000
28.2
Operational ITDC × Sector -> BPI 0.061 0.077 0.795 0.426
Analytical ITDC -> BPI 0.273 0.047 5.844 0.000
Analytical ITDC × Sector -> BPI −0.020 0.054 0.371 0.711
Sector -> BPI 0.016 0.038 0.421 0.674
Sector -> CP −0.062 0.038 1.639 0.101
41.1
BPI -> CP 0.629 0.025 25.030 0.000
BPI × Sector -> CP −0.080 0.031 2.590 0.010
CP -> FP 0.285 0.043 6.578 0.000
29.5
CP × Sector -> FP −0.081 0.036 2.230 0.026
BPI -> FP 0.293 0.042 7.058 0.000
BPI × Sector -> FP 0.009 0.046 0.190 0.849
Case 1 shows that relationships between all latent variables are statistically signiicant (p-value < 0.001). Case 2 demonstrates that all efects of irm size moderation on the relationship between exogenous and endogenous variables are not statistically signiicant (p-value < 0.05); irm size has a small direct inluence on BPI (−0.073) and FP (0.057). Case 3 demonstrates that the efect of sector moderation on the relationship between ITDC
(operational and analytical) and BPI is not statistically signiicant
(p-value < 0.05). Sector moderation has a small effect on
relationships between BPI and CP and between CP and FP, which were statistically signiicant (p-value < 0.05).
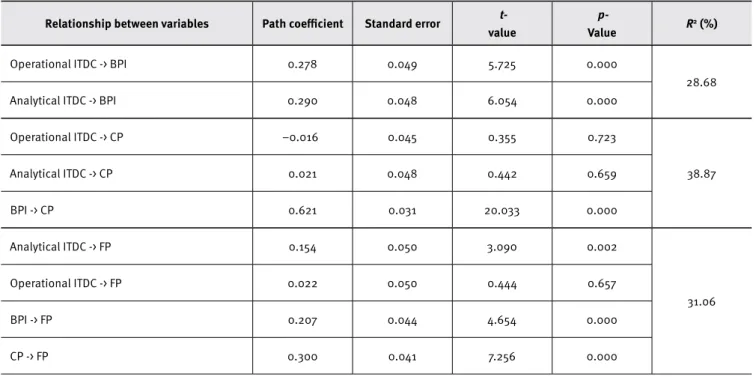
We checked ITDC’s direct effect on all endogenous variables, inding that the analytical ITDC inluences FP (p-value < 0.05; Table 5).
Table 5.
Inluence of IT-enabled dynamic capability on endogenous variables
Relationship between variables Path coeicient Standard error t-value
p-Value R
2 (%)
Operational ITDC -> BPI 0.278 0.049 5.725 0.000
28.68
Analytical ITDC -> BPI 0.290 0.048 6.054 0.000
Operational ITDC -> CP −0.016 0.045 0.355 0.723
38.87
Analytical ITDC -> CP 0.021 0.048 0.442 0.659
BPI -> CP 0.621 0.031 20.033 0.000
Analytical ITDC -> FP 0.154 0.050 3.090 0.002
31.06
Operational ITDC -> FP 0.022 0.050 0.444 0.657
BPI -> FP 0.207 0.044 4.654 0.000
CP -> FP 0.300 0.041 7.256 0.000
Coeicients of determination (R2 outcome) measure the
variance of endogenous variables, indicating the structural model’s quality. All coeicients of determination demonstrate large efects, as shown in Tables 4 and 5. Cohen (1988) suggests the following classiication for social and behavioral sciences: R2 = 2% is a small
efect, R2 = 13% is a medium efect, and R2 = 26% is a large efect.
Direct and indirect efects of IT-enabled
dynamic capability and business process
improvement
We checked all mediation analyses to identify direct and indirect efects of ITDC and BPI. We estimated direct efects without the potential mediator variables BPI and CP. Table 6 shows the signiicance analysis of path coeicients without the mediator
(Ringle et al., 2012), using the bootstrapping procedure (845 cases per subsample, 5,000 subsamples, and no sign changes). Both relationships are statistically signiicant (p-value < 0.001).
Table 6.
Path coeicient results estimated without the
potential mediator
Relationship between variables
Path coeicient
t-value
p-value
Operational ITDC -> CP 0.381 14.082 0.000
Operational ITDC -> FP 0.343 11.082 0.000
Analytical ITDC -> CP 0.378 13.410 0.000
Analytical ITDC -> FP 0.377 12.916 0.000
BPI -> FP 0.490 18.174 0.000
We concluded that indirect efects should exist (Zhao,
Table 7.
Results of variance accounted for (VAF)
Relationship between latent variables
Indirect efect
Standard
error t-value
p -value
Direct
efect Total efect VAF (%)
Operational ITDC -> BPI -> CP 0.173 0.007 2.432 0.015 −0.016 0.157 100
Operational ITDC -> BPI -> FP 0.057 0.027 0.822 0.411 0.022 0.079 72
Operational ITDC -> CP -> FP −0.048 0.004 6.282 0.000 0.022 −0.026 0
Analytical ITDC -> BPI -> CP 0.180 0.002 9.577 0.000 0.021 0.201 90
Analytical ITDC -> BPI -> FP 0.060 0.023 6.789 0.000 0.154 0.214 28
Analytical ITDC -> CP -> FP 0.063 0.019 8.171 0.000 0.154 0.217 29
BPI -> CP -> FP 0.186 0.060 3.434 0.001 0.206 0.392 47
Due to signiicant indirect efects, we analyzed the VAF value as it determines the size of the ratio of indirect efect to total efect (Hair et al., 2013). Per the authors, when the VAF is less than 20%, almost no mediation takes place, while a VAF exceeding 80% results in large outcomes, and we can assume full mediation. When the VAF lies between 20 and 80%, we see partial mediation. Our results indicate full mediation by BPI in relationships between operational ITDC and CP, and between analytical ITDC and CP. No mediation by BPI and CP exists in the relationship between operational ITDC and FP. Partial mediation by BPI and FP exists in the relationship between analytical ITDC and FP. Partial mediation by CP exists in the relationship between BPI and FP. Only the mediation by BPI in the relationship between operational ITDC and FP was not signiicant (p-value < 0.05).
Efect size (
f
2) and predictive relevance (
Q
2)
We evaluated the quality of model adjustment using two other indicators’ values: efect size (f2) or Cohen’s indicator, and
relevance or predictive validity (Q2) or Stone–Geisser indicator.
f2 was obtained by including and excluding model
constructs one by one. We evaluated the usefulness of each construct for the adjustment model. We considered values of 0.02, 0.15, and 0.35 small, medium, and large, respectively (Hair et al., 2013). We evaluated f2 in terms of the ratio between the
parts explained and not explained (f2 = R2/ (1 – R2). Table 8 shows
the values of f2 and BPI when the excluded constructs had large
efects on CP.
Table 8.
Results of efect size (
f
)
2Efect of excluded exogenous variable on
endogenous variable R² Included (%) R² excluded (%) f² efects size Explanation
1
Operational ITDC -> BPI 28.7 25.6 0.04 small
Analytical ITDC -> BPI 28.7 25.3 0.05 small
2
Operational ITDC -> CP 38.9 38.9 0.00 small
Analytical ITDC -> CP 38.9 39.1 0.00 null
BPI -> CP 38.9 12.8 0.43 large
3
Operational ITDC -> FP 31.1 31.1 0.00 null
Analytical ITDC -> FP 31.1 30.2 0.01 null
BPI -> FP 31.1 28.2 0.04 small
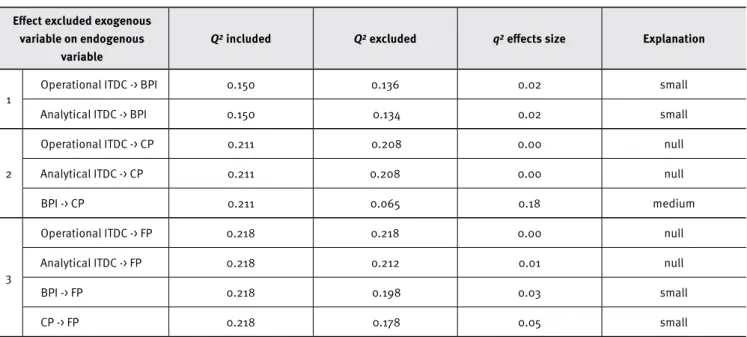
Q2 evaluates the model’s validity or how well the model measures what it was designed to measure (model prediction quality
or accuracy of adjusted model) (Chin, 1998). The values should be greater than zero (Ringle et al., 2014). All Q2 values are higher
than zero (Table 9), supporting the model’s predictive relevance regarding endogenous latent variables. We calculated the predictive relevance of exogenous variables on endogenous variables. In Cases 1 and 3, all exogenous variables show small or null predictive relevance for endogenous variables. The Q2 for CP (Case 2) shows that BPI has medium predictive relevance (Table 9).
Table 9.
Results of predictive relevance (
Q
2) and efect size (
q
2)
Efect excluded exogenousvariable on endogenous variable
Q² included Q² excluded q² efects size Explanation
1
Operational ITDC -> BPI 0.150 0.136 0.02 small
Analytical ITDC -> BPI 0.150 0.134 0.02 small
2
Operational ITDC -> CP 0.211 0.208 0.00 null
Analytical ITDC -> CP 0.211 0.208 0.00 null
BPI -> CP 0.211 0.065 0.18 medium
3
Operational ITDC -> FP 0.218 0.218 0.00 null
Analytical ITDC -> FP 0.218 0.212 0.01 null
BPI -> FP 0.218 0.198 0.03 small
CP -> FP 0.218 0.178 0.05 small
Analyzing heterogeneous data structures by moderating control variables
We checked diferences between sector moderation, split the heterogeneous dataset, and compared sector groups to understand and further diferentiate indings (Table 10).
Table 10.
Efect of sector groups
Sector Relationship between variables Path coeicient
Standard error
t-value
p-value R
2 (%)
Agribusiness
Operational ITDC -> BPI 0.225 0.250 0.898 0.369
26.5
Analytical ITDC -> BPI 0.322 0.279 1.156 0.248
Operational ITDC -> CP 0.460 0.212 2.172 0.030
43.2
Analytical ITDC -> CP −0.245 0.301 0.813 0.416
BPI -> CP 0.489 0.180 2.716 0.007
Operational ITDC -> FP −0.236 0.321 0.735 0.462
25.4
Analytical ITDC -> FP −0.011 0.286 0.039 0.969
BPI -> FP 0.333 0.261 1.273 0.203
CP -> FP 0.335 0.252 1.329 0.184
Sector Relationship between variables Path coeicient
Standard error
t-value
p-value R
2 (%)
Manufacturing
Operational ITDC -> BPI 0.298 0.079 3.768 0.000
27.6
Analytical ITDC -> BPI 0.259 0.082 3.181 0.001
Operational ITDC -> CP 0.075 0.064 1.172 0.241
46.8
Analytical ITDC -> CP −0.052 0.072 0.713 0.476
BPI -> CP 0.671 0.049 13.706 0.000
Operational ITDC -> FP 0.048 0.086 0.561 0.575
36.7
Analytical ITDC -> FP 0.075 0.083 0.898 0.369
BPI -> FP 0.175 0.075 2.331 0.020
CP -> FP 0.410 0.068 6.061 0.000
Commerce
Operational ITDC -> BPI 0.423 0.143 2.959 0.003
28.7
Analytical ITDC -> BPI 0.154 0.136 1.131 0.258
Operational ITDC -> CP −0.193 0.152 1.272 0.203
26.7
Analytical ITDC -> CP −0.008 0.183 0.045 0.964
BPI -> CP 0.593 0.105 5.641 0.000
Operational ITDC -> FP 0.068 0.180 0.379 0.705
24.1
Analytical ITDC -> FP 0.263 0.155 1.699 0.089
BPI -> FP 0.160 0.147 1.089 0.276
CP -> FP 0.172 0.141 1.225 0.221
Services
Operational ITDC -> BPI 0.160 0.074 2.167 0.030
28.7
Analytical ITDC -> BPI 0.389 0.069 5.677 0.000
Operational ITDC -> CP −0.086 0.069 1.260 0.208
26.7
Analytical ITDC -> CP 0.119 0.072 1.650 0.099
BPI -> CP 0.586 0.049 11.953 0.000
Operational ITDC -> FP −0.002 0.076 0.020 0.984
24.1
Analytical ITDC -> FP 0.229 0.075 3.052 0.002
BPI -> FP 0.223 0.069 3.227 0.001
CP -> FP 0.251 0.065 3.861 0.000
Finance
Operational ITDC -> BPI 0.498 0.138 3.604 0.000
41.5
Analytical ITDC -> BPI 0.166 0.155 1.074 0.283
Operational ITDC -> CP 0.036 0.208 0.175 0.861
45.4
Analytical ITDC -> CP 0.011 0.177 0.061 0.951
BPI -> CP 0.643 0.117 5.499 0.000
Operational ITDC -> FP −0.062 0.205 0.303 0.762
29.6
Analytical ITDC -> FP 0.336 0.178 1.890 0.059
BPI -> FP 0.128 0.193 0.663 0.507
CP -> FP 0.246 0.188 1.308 0.191
Agribusiness data show significant effects only for relationships between operational ITDC and CP, and between BPI and CP (p-value < 0.05). The manufacturing data exert no signiicant efects for relationships between operational ITDC and CP, and between analytical ITDC and CP (p-value < 0.05). The commerce data show no signiicant efects for relationships between operational ITDC and BPI, and between BPI and CPE (p-value < 0.010). The services data indicate no signiicant efects for relationships between operational ITDC and BPI, between analytical ITDC and BPI, and between operational ITDC and FP (p-value < 0.05). The inance data exert signiicant efects only for relationships between operational ITDC and BPI, and between BPI and CP (p-value < 0.05).
We compared all data groups to verify diferences in path coeicients by PLS multigroup analysis (PLS-MGA) (Hair et al., 2013). We did not ind statistically signiicant (p-value < 0.05) diferences in the path coeicients between the datasets of inance and manufacturing, inance and commerce, and inance and agribusiness. Signiicant (p-value < 0.10) diferences exist in path coeicients between the datasets of manufacturing and services, manufacturing and agribusiness, manufacturing and commerce, services and agribusiness, services and commerce, and services and inance. We veriied signiicant (p-value < 0.05) diferences in path coeicients between the datasets of commerce and agribusiness.
DISCUSSION AND CONCLUSION
This study provides empirical evidence regarding the efect of ITDC on corporate performance in economic turbulence. The results of a conceptual BSC model (Kaplan, 2010) evidence linkages between ITDC, BPI, CP, and FP in economic turbulence.
Large irm size decreases BPI and small companies perform better at innovation, operation, and post-sales activities. Large irm size increases FP, and these companies earn better revenue by creating customer satisfaction, loyalty, and retention. The results of our control variables (sector and irm size) testing show that sector moderates the relationships between BPI and CP, and between CP and FP.
We conduct a detailed analysis of heterogeneous data by comparing data groups’ results and ind interesting diference efects in relationships between operational ITDC and CP. ITDC has strong efects on understanding customer needs, making timely delivery (products and services), and retaining clients. Comparing representative datasets for manufacturing (339 cases) and services (317 cases) shows a strong diference efect (0.160) between CP and FP (i.e., the manufacturing sector has a higher path coeicient than the services sector).
Hypotheses H1 (operational ITDC -> BPI) and H2 (analytical ITDC -> BPI) show strong signiicance efects (p-value < 0.05) of path coeicients, conirming that IT creates many operational and analytical beneits (Melville et al., 2004; Tallon, 2008), enabling DC to build and reconigure internal competencies in value chain activities and achieve corporate performance. Operational and analytical ITDC have the same efect on BPI for innovation, operations, and post-sales (i.e., there are no diferences in path coeicients).
We examine the process in which ITDC positively afects CP through increased proiciency by changing BPI. Relationships between operational and analytical ITDC and CP are fully mediated by BPI, consistent with other studies (Kaplan, 2010; Kaplan & Norton, 2008; Melville et al., 2004; Tallon, 2008). The results highlight dynamic process management capabilities’ importance in enhancing irm-level performance (Kim et al., 2011).
We examine the possible direct relationship between operational and analytical ITDC and FP. Operational ITDC -> FP shows no statistically signiicant efects. Analytical ITDC -> FP demonstrates signiicant efects. We identify partial mediation by BPI and CP for analytical ITDC (Q2 > 0). We check the direct
efects in these relationships without the mediator, and all results are statistically signiicant (p-value < 0.05). Although signiicant causality between the variables of ITDC and FP might exist, achieving consistent empirical indings is diicult when
modeling based on the black box approach (Kim et al., 2011).
Some studies using the black box approach cannot explain how IT investment and organizational performance are associated
(Brynjolfsson, 1993; Brynjolfsson & Hitt, 1996).
Hypotheses H3 (BPI -> CP) and H4 (BPI -> FP) conirm the causal relationship conceptualized in the BSC framework
(Kaplan, 2010). BPI has a stronger efect (0.623) on CP than on FP (0.294). We conclude that innovation, operations, and post-sales value chain activities focus more on generating value to satisfy customers than on reducing spending. We moderate BPI to conirm that IT enables DC to create beneits and improve business process performance (Schwarz et al., 2010). This is accomplished by understanding, analyzing, manufacturing, delivering (products and services), and improving client relationships, resulting in
sustainable competitive advantage (Kaplan & Norton, 2008;
Ramdani, 2012) in the uncertain Brazilian environment. Hypothesis H5 (CP -> FP) conirms the causal relationship of the BSC framework (Kaplan & Norton, 1996). The empirical study conirms that delivery of market attributes promotes customer satisfaction, leading to client retention and added value to customers. It inds higher variation in FP (R2 = 28.8%) and that
We identify operational and analytical ITDC’s beneits for corporate performance using survey-based research supported by empirical evidence. Our sample comprises Brazilian irms under economic turbulence (GDP = −3.8%); most previous studies use data from stable economies in North America and Europe. Few studies pertaining to Brazil explicitly model and empirically test the efects of ITDC on corporate performance using the BSC model in economic crisis.
LIMITATIONS AND FUTURE
OPPORTUNITIES
This study’s weakness is its latent variables, which require assumptions regarding measurement and may not reflect the realities of executive ITDC perceptions, business process improvement, customer performance, or inancial performance.
Future research opportunities include qualitative research, speciically how and why control variables such as sector, irm size, and environmental challenge inluence the ITDC regarding corporate performance. The study could be repeated using the following constructs: (1) impacts of IT resource adoption on corporate performance and (2) other efects of ITDC use on corporate performance. Researchers may compare structural efects to identify diferent inluences and uses of IT adoption.
AUTHORS’ NOTE
The PLS-MGA data group comparisons’ questionnaire, tables of cross-group data by sector, and results are available from the irst author.
REFERENCES
Albertin, A. L., & Albertin, R. M. M. (2016). Information technology and corporate performance: The IT use dimension and benefits to business (3rd ed.). São Paulo, Brazil: Atlas.
Ambrosini, V., & Bowman, C. (2009). What are dynamic capabilities and are they a useful construct in strategic management? International Journal of Management Reviews, 11(1), 29-49. doi:10.1111/j.1468-2370.2008.00251.x
Anderson, M. C., Banker, R. D., & Ravindran, S. (2006). Value implications of investments in information technology. Management Science, 52(9), 1359-1376. doi:10.1287/mnsc.1060.0542
Arnott, D., & Pervan, G. (2005). A critical analysis of decision support systems research. Journal of Information Technology, 20(2), 67-87. doi:10.1057/palgrave.jit.2000035
Arnott, D., & Pervan, G. (2014). A critical analysis of decision support systems research revisited: The rise of design science. Journal of Information Technology, 29(4), 269-293. doi:10.1057/jit.2014.16
Atkinson, A. A., Kaplan, R. S., Matsumura, E. M., & Young, S. M. (2011).
Management accounting: Information for decision-making and strategy execution (6th ed.). Englewood Clifs, USA: Prentice Hall.
Augier, M., & Teece, D. J. (2009). Dynamic capabilities and the role of managers in business strategy and economic performance. Organization Science, 20(2), 410-421. doi:10.1287/orsc.1090.0424
Barney, J. (1991). Firm resources and sustained competitive advantage. Jour-nal of Management, 17(1), 99-120. doi:10.1177/014920639101700108
Barney, J. B., & Clark, D. N. (2007). Resource-based theory: Creating and sustaining competitive advantage. New York, USA: Oxford University Press.
Bento, A., Bento, R., & White, L. F. (2013). Validating cause-and-efect relationships in the balanced scorecard. Academy of Accounting and Financial Studies Journal, 17(3), 45-55.
Bharadwaj, A. S. (2000). A resource-based perspective on information technology capability and irm performance: An empirical investigation. MIS Quarterly, 24(1), 169-196. doi:10.2307/3250983
Bhatt, G. D., & Grover, V. (2005). Types of information technology capabilities and their role in competitive advantage: An empirical study. Journal of Management Information Systems, 22(2), 253-277.
Birkinshaw, J., & Goddard, J. (2009). What is your management model? MIT Sloan Management Review, 50(2). Retrieved from http:// sloanreview.mit.edu/
Brito, R. P. de., & Brito, L. A. L. (2012). Vantagem competitiva, criação de valor e seus efeitos sobre o desempenho. RAE-Revista de Administração de Empresas, 52(1), 70-84. doi:0.1590/S0034-75902012000100006
Bryant, L., Jones, D. A., & Widener, S. K. (2004). Managing value creation within the irm: An examination of multiple performance measures. Journal of Management Accounting Research, 16(1), 107-131. doi:10.2308/jmar.2004.16.1.107
Brynjolfsson, E. (1993). The productivity paradox of information technology. Communications of the ACM, 36(12), 66-77.
Brynjolfsson, E., & Hitt, L. (1996). Paradox lost? Firm-level evidence on the returns to information systems spending. Management Science, 42(4), 541-558. doi:10.1287/mnsc.42.4.541
Chin, W. W. (1998). The partial least squares approach for structural equation modeling. In G. A. Marcoulides (Ed.), Modern methods for business research (pp. 295-336). London, UK: Lawrence Erlbaum Associates.
Chuang, S. (2004). A resource-based perspective on knowledge management capability and competitive advantage: An empirical investigation. Expert Systems with Applications, 27(3), 459-465. doi:10.1016/j.eswa.2004.05.008
Cohen, J. (1988). Statistical power analysis for the behavioral sciences
(2nd ed.). New York, USA: Psychology Press.
D’Arcy, J., & Devaraj, S. (2012). Employee misuse of information technology resources: Testing a contemporary deterrence model. Decision Sciences, 43(6), 1091-1124. doi:10.1111/j.1540-5915.2012.00383.x
Davenport, T. H., Harris, J. G., & Morison, R. (2010). Analytics at work: Smarter decisions, better results. Cambridge, USA: Harvard Business Press.
Davern, M. J., & Wilkin, C. L. (2010). Towards an integrated view of IT value measurement. International Journal of Accounting Information Systems, 11(1), 42-60. doi:10.1016/j.accinf.2009.12.005
Devaraj, S., & Kohli, R. (2000). Information technology payof in the healthcare industry: A longitudinal study. Journal of Management Information Systems, 16(4), 41-67.
Devaraj, S., & Kohli, R. (2003). Performance impacts of information technology: Is actual usage the missing link? Management Science, 49(3), 273-289.
Eisenhardt, K. M., & Martin, J. A. (2000). Dynamic capabilities: What are they? Strategic Management Journal, 21(10-11), 1105-1121. doi:10.1002/1097-0266(200010/11)21:10/11<1105::aid-smj133>3.0.co;2-e
Faul, F., Erdfelder, E., Lang, A. G., & Buchner, A. (2007). G*Power 3: A lexible statistical power analysis program for the social, behavioral, and biomedical sciences. Behavior Research Methods, 39(2), 175-191. doi:10.3758/BF03193146
Grant, R. M. (2010). Contemporary strategy analysis and cases: Text and cases. New York, USA: John Wiley & Sons.
GVCia. (2015). Annual research on management and IT use in business
(26th ed.). Sao Paulo, Brazil: FGV-EAESP-CIA.
Hair, J. F., Black, W. C., Babin, B. J., Anderson, R. E., & Tatham, R. L. (2009). Análise multivariada de dados. São Paulo, Brasil: Bookman Editora.
Hair, J. F., Jr., Hult, G., Ringle, C., & Sarstedt, M. (2013). A primer on partial least squares structural equation modeling (PLS-SEM). Thousand Oaks, USA: Sage.
Helfat, C. E., Finkelstein, S., Mitchell, W., Peteraf, M., Singh, H., Teece, D., & Winter, S. G. (2009). Dynamic capabilities: Understanding strategic change in organizations. John Wiley & Sons.
Helfat, C. E., & Peteraf, M. A. (2009). Understanding dynamic capabilities: Progress along a developmental path. Strategic organization, 7(1), 91-102. doi:10.1177/1476127008100133
Helfat, C. E., & Winter, S. G. (2011). Untangling dynamic and operational capabilities: Strategy for the (n)ever-changing world. Strategic Management Journal, 32(11), 1243-1250. doi:10.1002/smj.955
Henderson, B., Kobelsky, K. W., Richardson, V. J., & Smith, R. (2010). The relevance of information technology expenditures. Journal of Information Systems, 24(2), 39-77. doi:10.2308/jis.2010.24.2.39
Henderson, J., & Venkatraman, N. (1999). Strategic alignment: Leveraging information technology for transforming organizations. IBM Systems Journal, 32(1), 472-484. doi:10.1147/sj.382.0472
Henseler, J., Ringle, C. M., & Sinkovics, R. R. (2009). The use of partial least squares path modeling in international marketing. Advances in International Marketing, 20, 277-319.
Instituto Brasileiro de Geograia e Estatística. (2016). Study of gross domestic product of 2015. Retrieved from http://www.ibge.gov.br/ home/estatistica/indicadores/pib/defaultcnt.shtm
Jordão, R. V. D., & Novas, J. L. C. (2013). A study on the use of the balanced scorecard for strategy implementation in a large Brazilian mixed economy company. Journal of Technology Management & Innovation, 8(3), 98-107.
Kaplan, R. (2010). Conceptual foundations of the balanced scorecard [Working Paper No 10-074]. Harvard Business School Accounting &
Management Unit, Boston, USA.
Kaplan, R., & Norton, D. P. (1992). The balanced scorecard: Measures that drive performance. Harvard Business Review, 70(1). Retrieved from https://hbr.org/
Kaplan, R., & Norton, D. P. (1996). The balanced scorecard: Translating strategy into action. Boston, USA: Harvard Business Press.
Kaplan, R., & Norton, D. P. (2000). The strategy-focused organization: How balanced scorecard companies thrive in the new business environment. Boston, USA: Harvard Business Review Press.
Kaplan, R., & Norton, D. P. (2004). The strategy map: Guide to aligning intangible assets. Strategy & Leadership, 32(5), 10-17. doi:10.1108/10878570410699825
Kaplan, R., & Norton, D. P. (2008). The execution premium: Linking strategy to operations for competitive advantage. Boston, USA: Harvard Business Review Press.
Kim, G., Shin, B., Kim, K. K., & Lee, H. G. (2011). IT capabilities, process-oriented dynamic capabilities, and irm inancial performance. Journal of the Association for Information Systems, 12(7), 487-517.
Kohli, R., Devaraj, S., & Ow, T. T. (2012). Does information technology investment inluence a irm’s market value? A case of non-publicly traded healthcare irms. MIS Quarterly, 36(4), 1145-1163.
Kohli, R., & Grover, V. (2008). Business value of IT: An essay on expanding research directions to keep up with the times. Journal of the Association for Information Systems, 9(1), 23-39.
Maçada, A. C. G., Beltrame, M. M., Dolci, P. C., & Becker, J. L. (2012). IT business value model for information intensive organizations. BAR-Brazilian Administration Review, 9(1), 44-65. doi:10.1590/S1807-76922012000100004
Malhotra, N. K. (2006). Pesquisa de marketing: Uma orientação aplicada
(4th ed.). Porto Alegre, RS: Bookman.
Marôco, J. (2010). Análise de equações estruturais: Fundamentos teóricos. Software e aplicações. Sao Paulo, SP: Pêro Pinheiro.
McKelvie, A., & Davidsson, P. (2009). From resource base to dynamic capabilities: An investigation of new irms. British Journal of Management, 20(1), S63-S80. doi:10.1111/j.1467-8551.2008.00613.x
Meirelles, S. D., & Camargo, Á. A. B. (2014). Capacidades dinâmicas: O que são e como identiicá-las? RAC-Revista de Administração Contemporânea, 18(7), 41-64. doi:10.1590/1982-7849rac20141289
Melville, N., Kraemer, K., & Gurbaxani, V. (2004). Information technology and organizational performance: An integrative model of IT business value. MIS Quarterly, 28(2), 283-322.
Najmi, M., Etebari, M., & Emami, S. (2012). A framework to review performance prism. International Journal of Operations and Production Management, 32(10), 1124-1146. doi:10.1108/01443571211274486
Nitzl, C., & Hirsch, B. (2013). When do managers trust their management accountants? [SSRN Working Paper, pp. 1-46]. Bundeswehr University, Munich, Germany.
Nudurupati, S. S., Bititci, U. S., Kumar, V., & Chan, F. T. (2011). State of the art literature review on performance measurement. Computers & Industrial Engineering, 60(2), 279-290. doi:10.1016/j. cie.2010.11.010
Otim, S., Dow, K., Grover, V., & Wong, J. (2012). The impact of information technology investments on downside risk of the irm: Alternative measurement of the business value of IT. Journal of Management Information Systems, 29(1), 159-194. doi:10.2753/MIS0742-1222290105
Ouakouak, M. L., & Ouedraogo, N. (2013). The mediating role of employee strategic alignment in the relationship between rational strategic planning and irm performance: A European study. Canadian Journal of Administrative Sciences, 30(3), 143-158. doi:10.1002/cjas.1259
Papke-Shields, K. E., Malhotra, M. K., & Grover, V. (2006). Evolution in the strategic manufacturing planning process of organizations. Journal of Operations Management, 24(5), 421-439. doi:10.1016/j. jom.2005.11.012
Pavlou, P. A., & Sawy, O. A. El. (2011). Understanding the elusive black box of dynamic capabilities. Decision Sciences, 42(1), 239-273. doi:10.1111/j.1540-5915.2010.00287.x
Poelmans, S., Rejers, H. A., & Recker, J. (2013). Investigating the success of operational business process management systems. Information Technology and Management, 14(4), 295-314. doi:10.1007/s10799-013-0167-8
Powell, T. C., & Dent-Micallef, A. (1997). Information technology as competitive advantage: The role of human, business, and technology resources. Strategic Management Journal, 18(5), 375-405. doi:10.1002/ (sici)1097-0266(199705)18:5<375::aid-smj876>3.0.co;2-7
Ramakrishnan, T., Jones, M. C., & Sidorova, A. (2012). Factors inluencing business intelligence (BI) data collection strategies: An empirical investigation. Decision Support Systems, 52(2), 486-496. doi:10.1016/j.dss.2011.10.009
Ramdani, B. (2012). Information technology and organisational performance: Reviewing the business value of IT literature. In Y. K. Dwivedi, M. R. Wade, & S. L. Schneberger (Eds.), Information systems theory: Explaining and predicting our digital society (Vol. 1, pp. 283-301). New York, USA: Springer.
Raschke, R. L. (2010). Process-based view of agility: The value contribution of IT and the efects on process outcomes. International Journal of Accounting Information Systems, 11(4), 297-313. 10.1016/j. accinf.2010.09.005
Ravichandran, T., & Lertwongsatien, C. (2005). Efect of information systems resources and capabilities on irm performance: A resource-based perspective. Journal of Management Information Systems, 21(4), 237-276.
Ray, G., Wu, D., & Konana, P. (2009). Competitive environment and the relationship between IT and vertical integration. Information Systems Research, 20(4), 585-603. doi:10.1287/isre.1080.0202
Ringle, C., Sarstedt, M., & Straub, D. (2012). A critical look at the use of PLS-SEM in MIS Quarterly. MIS Quarterly, 36(1), 3-14
Ringle, C., Silva, D., & Bido, D. S. (2014). Modelagem de equações estruturais com utilização do Smartpls. Revista Brasileira de Marketing, 13(2), 54-71. doi:10.5585/remark.v13i2.2717
Ringle, C., Wende, S., & Will, A. (2005). SmartPLS 2.0 M3. Retrieved from http://www.smartpls.de
Santos, B. L. dos, Zheng, Z., Mookerjee, V. S., & Chen, H. (2012). Are new IT-enabled investment opportunities diminishing for irms?
Information Systems Research, 23(2), 287-305.
Santos-Vjande, M. L., López-Sánchez, J. Á., & Trespalacios, J. A. (2012). How organizational learning afects a irm’s lexibility, competitive strategy, and performance. Journal of Business Research, 65(8), 1079-1089. doi:10.1016/j.jbusres.2011.09.002
Schwarz, A., Kalika, M., Kei, H., & Schwarz, C. (2010). A dynamic capabilities approach to understanding the impact of IT-enabled business processes and IT-business alignment on the strategic and operational performance of the irm. Communications of the Association for Information Systems, 26(1), 57-84.
Sekaran, U. (2000). Research methods for business: A skill-building approach (3rd ed.). New York, USA: John Wiley.
Sen, D., Bingol, S., & Vayvay, O. (2017). Strategic enterprise management for innovative companies: The last decade of the balanced scorecard. International Journal of Asian Social Science, 7(1), 97-109. doi:10.18488/journal.1/2017.7.1/1.1.97.109
Shang, S., & Seddon, P. B. (2002). Assessing and managing the beneits of enterprise systems: The business manager’s perspective. Information Systems Journal, 12(4), 271-299. doi:10.1046/j.1365-2575.2002.00132.x
Sila, I., & Ebrahimpour, M. (2005). Critical linkages among TQM factors and business results. International Journal of Operations & Production Management, 25(11), 1123-1155. doi:10.1108/01443570510626925
Singh, S., Watson, H. J., & Watson, R. (2002). EIS support for the strategic management process. Decision Support Systems, 33(1), 71-85. doi:10.1016/S0167-9236(01)00129-4
Sobol, M. G., & Klein, G. (2009). Relation of CIO background, IT infrastructure, and economic performance. Information & Management, 46(5), 271-278. doi:10.1016/j.im.2009.05.001
Sosik, J. J., Kahai, S., & Piovoso, M. J. (2009). Silver bullet or voodoo statistics? A primer for using the partial least squares data analytic technique in group and organization research. Group & Organization Management, 34(1), 5-36. doi:10.1177/1059601108329198
Stoel, M. D., & Muhanna, W. A. (2009). IT capabilities and irm performance: A contingency analysis of the role of industry and IT capability type. Information and Management, 46(3), 181-189. doi:10.1016/j.im.2008.10.002
Tallon, P. P. (2008). A process-oriented perspective on the alignment of information technology and business strategy. Journal of Management Information Systems, 24(3), 227-268. doi:10.2753/ MIS0742-1222240308
Tallon, P. P., Kraemer, K. L., & Gurbaxani, V. (2000). Executives’ perceptions of the business value of information technology: A process-oriented approach. Journal of Management Information Systems, 16(4), 145-173. doi:10.1080/07421222.2000.11518269
Teece, D. J. (2009). Dynamic capabilities and strategic management: Organizing for innovation and growth. New York, USA: Oxford University Press.
Teece, D. J. (2014). A dynamic capabilities-based entrepreneurial theory of the multinational enterprise. Journal of International Business Studies, 45(1), 8-37. doi:10.1057/jibs.2013.54
Teece, D. J., Pisano, G., & Shuen, A. (1997). Dynamic capabilities and strategic management. Strategic Management Journal, 18(7), 509-533. doi:10.1002/(sici)1097-0266(199708)18:7<509::aid-smj882>3.0.co;2-z
Urbach, N., & Ahlemann, F. (2010). Structural equation modeling in information systems research using partial least squares. Journal of Information Technology Theory and Application, 11(2), 5-39.
Wang, C. L., & Ahmed, P. K. (2007). Dynamic capabilities: A review and research agenda. International Journal of Management Reviews, 9(1), 31-51. doi:10.1111/j.1468-2370.2007.00201.x
Weill, P., Subramani, M., & Broadbent, M. (2002). Building IT infrastructure for strategic agility. MIT Sloan Management Review,
44(1). Retrieved from http://sloanreview.mit.edu/
Winter, S. G. (2003). Understanding dynamic capabilities. Strategic Management Journal, 24(10), 991-995. doi:10.1002/smj.318
Yoshikuni, A. C., & Albertin, A. L. (2014). Model analysis of the relationship between strategic organization knowledge and the use of information systems in irm performance in Brazil. Chinese Business Review, 13(5), 301-319.
Zahra, S. A., Sapienza, H. J., & Davidsson, P. (2006). Entrepreneurship and dynamic capabilities: A review, model and research agenda. Journal of Management Studies, 43(4), 917-955. doi:10.1111/j.1467-6486.2006.00616.x
Zhao, X., Lynch, J. G., & Chen, Q. (2010). Reconsidering Baron and Kenny: Myths and truths about mediation analysis. Journal of Consumer Research, 37(2), 197-206. doi:10.1086/651257