Article
J. Braz. Chem. Soc., Vol. 27, No. 9, 1626-1635, 2016. Printed in Brazil - ©2016 Sociedade Brasileira de Química 0103 - 5053 $6.00+0.00
*e-mail: [email protected]
Determination of Pesticides in Grape Juices by QuEChERS and Liquid
Chromatography-Tandem Mass Spectrometry
Deise F. Souza,a,b Edson L. Souzaa and Endler M. Borges*,a,c
aNúcleo Biotecnológico, Universidade do Oeste de Santa Catarina, UNOESC, Rua Paese, 198,
Bairro Universitário-Bloco K, 89560-000 Videira-SC, Brazil
bLaboratório da Tecnologia de Bebidas, LATEB, Núcleo de Metrologia Gestão e Processo Produtivo,
Sistema FIESC-SENAI/SC Videira, Rua Julio Pretti, 270, 89570-000 Pinheiro Preto-SC, Brazil
cDepartamento de Química, Universidade Regional de Blumenau, FURB, Campus 1,
Rua Antônio da Veiga, 140, Victor Konder, 89012-900 Blumenau-SC, Brazil
In this study, we describe a liquid chromatography-tandem mass spectrometry (LC-MS/MS) method for quantifying 25 pesticides in grape juice. This method was optimized and validated according with INMETRO (Instituto Nacional de Metrologia Qualidade e Tecnologia) for the simultaneous determination of pesticide, which are widely used in grape culture in Brazil. The method was based on the QuEChERS (quick, easy, cheap, effective, rugged and safe) methodology. We used AOAC Official Method 2007.01 and Standard Method EN 15662 for sample preparation, both methods presented statistically equivalent recoveries and coefficients of variation. At 0.005 and 2 mg L-1, fortified blank grape juices had average recoveries of 101 and 112% and average coefficients of variation of 16 and 11%, respectively. The repeatability was tested in three concentrations 0.005, 0.1 and 2 mg L-1, affording coefficients of variation 16.4, 20.7 and 10.8%, respectively.
Keywords: pesticide residue, grape juice, QuEChERS, sample preparation, LC-MS/MS
Introduction
During production, processing, storage, and transport of food a variety of residues and contaminants may enter the food chain. Crops are treated with pesticides and against pests and may leave residues in products of plant.1 Thus, determination of pesticide residues in food matrices has become a necessity in view of the toxicity and stability of these xenobiotics.2
Due to the low detection levels required by the regulatory bodies and the complex nature of the matrices, which the target compounds are present, the trace level detection and identification with prior efficient sample preparation are important aspects in the analytical method.3
Liquid chromatography-tandem mass spectrometry (LC-MS/MS) is the most powerful techniques for the analysis of pesticides in a variety of complex matrices.3 Nowadays, liquid chromatography-mass spectrometry
(LC-MS) is preferred over gas chromatography (GC) because currently used pesticides are quite polar, thermally labile or not easily vaporized.4 Therefore, there are several LC-MS/MS methods for multi pesticide analyses.3,5
Despite of multiresidue analysis of these compounds at trace levels has been carried out since the 70s, analysis of pesticides still remains a challenge because different chemical classes are present at low concentrations in complex matrices. Thus, it is necessary to continue developing multi-residue analytical methods with higher recoveries and lower limits of detection as well as incorporating the ultimate innovations to them.6
The determination of pesticide residues in food matrices is a formidable challenge mainly because of the small quantities of analytes and large amounts of interfering substances which can be co-extracted with analytes and, in most cases, adversely affect the results of an analysis. However, safety concerns require that pesticides of the wide range of chemical properties (including acidic, basic and neutral) should be monitored.
Extraction and purification of samples is required prior to residue determination.3 Because of the wide variety of food matrices, the sample must initially be cleaned up before final analysis. That is why the analytical chemist is faced with the need to develop new methodologies for determining such residues in a single analytical run. To accomplish the goal, “quick, easy, cheap, effective, rugged and safe” QuEChERS methodology has been developed. It is a streamlined and effective extraction and cleanup approach for the analysis of diverse analyte residues in food matrices.2 Thus, it was used in this study.
It is widely recognized that the QuEChERS method is relevant in pesticide residue analysis. Many official laboratories around the globe are routinely using it due to the advantages encapsulated in its name. However, the frontiers of the application of QuEChERS are not yet established. González-Curbelo et al.9 had shown that this method is effective for the analysis of other groups of compounds, including pharmaceuticals, mycotoxins, and polycyclic aromatic hydrocarbons, in a wide variety of complex matrices.
The LC-MS/MS in MRM mode has been widely used for quantitative and qualitative pesticide analysis.10-12 Dynamic multiple reaction monitoring (DMRM) is an alternative to the use of MRM; this mode avoids the need to define segments of timeframe for the selected group of transitions, based on retention time, number of target species, and dwell time. In fact, “virtual” time segments are automatically constructed by the software during the analysis (as a timeframe of continuous movement during the analysis time), improving the shape of the peak and increasing the sensitivity.10
Brazil is the third largest fruit producer worldwide and an important exporter of tropical and subtropical fresh and processed fruits, mainly to European countries and the United States.11
Results from Brazilian pesticide monitoring programs have shown that almost half of the 13,556 samples of 22 different crops analyzed tested positive for at least one pesticide.12,13 Thus, pesticides analysis for food security is need to assure population health.
There are several multi-residue methods, however, there were few methods developed for pesticides widely used in
specific culture and region. For example, Rebelo et al.14,15 developed a LC-MS/MS multi-pesticide method, for pesticides which were widely used for rice culture in Brazil. Thus, there is a need for methods which could be applied for specific situations.
For those reasons the aim of the present study was to develop a multi-residue method for pesticides, which were widely used in grape culture in Brazil. In addition, this method is full validated according with INMETRO (Instituto Nacional de Metrologia Qualidade e Tecnologia) that is the institution responsible for quality assurance in Brazil. Thus, the present method could be direct used to assure the security of Brazilian grape juice.
Experimental
Reagents and chemicals
A mix with all pesticides (Table 1) was purchased from SPEX CertiPrep Group (Metuchen, NJ, USA), this mix had the pesticides at 1000 mg L-1 concentration. Formic acid (≥ 99.8%) was purchased from Sigma-Aldrich (Sigma-Aldrich, St. Louis, USA). Methanol HPLC grade was purchased from JT Baker® (Phillipsburg, NJ, USA). Kit QuEChERS AOAC-2007.01 and EN 15662:2008 were purchased from Agilent (Agilent Technologies, Santa Clara, CA, USA).
There are two tubes in QuEChERS kits, tube 1, with 50 mL of volume, used for extraction and tube 2, with 2 mL of volume, used for cleanup.
In AOAC-2007.01 QuEChERS kits, tube 1 had 6 g anhydrous magnesium sulfate (MgSO4) and 1.5 g anhydrous sodium acetate (50 mL of volume, tube 1), and tube 2 had 150 mg of MgSO4 and 50 mg of PSA (primary secondary amine). It was purchased from Agilent Technologies (Santa Clara, CA, USA).
In EN 15662:2008 QuEChERS kits, tube 1 had 4 g MgSO4, 1 g NaCl, 1 g citrate, 0.5 g disodiumcitrate sesquihydrate and tube 2 had 150 mg of MgSO4 and 25 mg of PSA. It was purchased from Agilent Technologies (Santa Clara, CA, USA).
Stock solutions were prepared by dissolving the standards in methanol at a concentration of 100 mg L-1. Two intermediate mixture solution C and D at concentrations of 5 and 1 mg L-1, respectively. Calibration solutions were prepared via the dilution of solutions C and D in methanol at 0.0025, 0.005, 0.01, 0.05, 0.1, 0.5, 1, 2, e 5 mg L-1 concentration levels.
LC-MS/MS analysis
The analyses were carried out in the LC-MS/MS system: it consist of a LC system 1260 Infinity Quaternary LC coupled to a triple quadrupole mass spectrometer (QqQ) 6430 detector. Both were from Agilent Technologies (Santa Clara, CA, USA). The chromatographic separations were carried out using a poroshell 120 EC-C18, 100 × 2.1 mm internal diameter (i.d.) and 2.7 µm particle size (Agilent Technologies, Santa Clara, CA, USA). Before the separation column, a pre-column was installed, guard 3PK-poroshell 120 EC-C18, 5 × 2.1 mm i.d. and 2.7 µm particle size (Agilent Technologies, Santa Clara, CA, USA). Chromatographic analysis was carried out using gradient elution and mobile phase consisted of formic acid 0.1%/methanol (95:5, v/v) (A), and formic acid 0.1%/methanol (5:95, v/v). The ultrapure water used to prepared formic acid solution was obtained from a Milli-Q® water system (Millipore; Bedford, USA). The gradient program started at 30% B, with linear gradient until 95% B in 7.5 min and, then, linear gradient until 100% in 15 min
and constant for 2 min. The re-equilibrium time (post time) was 4.5 min. The flow remained constant at 0.3 mL min-1, the column temperature was fixed at 40 °C, and the injection volume was 1 µL.
All pesticides were analyzed in the positive ionization mode, parent ions were detected as [M + H].
It was used a Quadruple Triple 6430 mass spectrometer as detector. The optimized conditions were gas flow of 11 L min-1; gas nebulizer at 15 psi, gas temperature at 300 °C, and capillary voltage of 4000 V. Nitrogen 99.99% was used as nebulizer and 99.9999% as collision gas. For data acquisition, the software Agilent Mass Hunter was used. For the detection in the MS/MS, we used the DMRM mode.
For the selection of the precursor and product ion, 2 µL of the standard solution of pesticide (2 mg L-1) was injected in the LC-MS/MS. Different fragmentation energies (20-160 V), different collision energies (0-60 V) and acceleration energies (1-7 V) were investigated for each compound.
Table 1. Molecular weight, precursor ion, quantifier and qualifier. Average retention times (tR), fragmentation energy, collision energy (CE) of quantifier
(CE1) and qualifier transitions (CE2) for detected pesticide residues in grape juices
Pesticide Molecular weight Precursor ion Quantifier ion Qualifier ion tR / min
Fragmentation
energy / V CE1 / V CE2 / V
Acephate 183.17 [M + H]+ 184 143 95 1.11 50 25 0
Azoxystrobin 403.39 [M + H]+ 404 372 344 7.72 80 25 10
Boscalid 343.21 [M + H]+ 343 307 271 7.97 100 35 20
Carbendazim 191.19 [M + H]+ 192 160 132 1.67 90 35 15
Carbofuran 221.25 [M + H]+ 222 123 165 6.25 80 5 20
Carbosulfan 380.54 [M + H]+ 381 118 160 12 90 10 20
Cymoxanil 198.18 [M + H]+ 199 128 110 4.06 50 15 5
Ciproconazol 291.78 [M + H]+ 292 70 125 8.32 100 20 30
Chlorpyrifos 350.59 [M + H]+ 349 198 293 10.3 90 10 19
Clothianidin 249.68 [M + H]+ 250 131 169 2.59 70 5 10
Difenoconazol 406.26 [M + H]+ 406 251 337 9.32 130 15 25
Dimethoate 229.26 [M + H]+ 230 198 171 3.2 70 10 5
Dimetomorfe 387.86 [M + H]+ 388 301 165 8.08 130 35 20
Diuron 233.09 [M + H]+ 233 72.1 159 7.32 90 30 15
Fenamidone 311.4 [M + H]+ 312 92 236 7.87 80 10 30
Fenarimol 331.2 [M + H]+ 331 268 81 8.4 130 35 25
Fenpyroximate 421.49 [M + H]+ 422 366 135 10.8 110 35 15
Imidacloprid 255.66 [M + H]+ 256 208 175 2.42 80 15 15
Indoxacarb 527.83 [M + H]+ 528 150 203 9.33 100 25 40
Iprovalicarb 320.43 [M + H]+ 321 119 202 8.29 80 5 15
Metalaxmetalaxyl 279.33 [M + H]+ 280 220 160 7.26 80 20 10
Tebuconazole 307.82 [M + H]+ 308 70 124 8.88 80 40 15
Tetraconazole 372.15 [M + H]+ 372 159 70 8.4 110 20 45
Thiametoxam 291.71 [M + H]+ 292 211 181 1.7 100 20 10
Triadimefon 293.75 [M + H]+ 294 197 225 8.13 90 10 10
Triadimenol 295.76 [M + H]+ 296 70 99 8.29 80 20 5
The most intense transition was used as the quantifying ion and the second most intense transition used as the qualifying ion for confirmation of the analysis.
Extraction
The sample preparation method of QuEChERS AOAC-2007.01 and EN 15662:2008 were used for samples of grape juice. 15 mL of grape juice was transferred to tube 1 (kit QuEChERS). Then, we added 1% acetic acid in acetonitrile and the samples were shaken vigorously (by hand) for 1 min. Next, the extract was centrifuged at 3500 rpm for 5 min in a Fanem® Excelsa 2206 (Fanem® Ltda). We removed 1 mL of the supernatant and transferred it to tube two (kit QuEChERS). The extract was shaken manually for 30 seconds and centrifuged again for 5 min at 3500 rpm. In EN 15662:2008, 5 µL of 5% formic acid was added in tube 2, after centrifugation. Prior to injection, samples were filtered with 0.45 µm nylon syringe filter (Millex-HN, Millipore, Bedford, MA, USA). Matrix-matched standards were prepared using blank samples that were extracted according to the sample preparation procedure mentioned above.
Results and Discussion
Optimization of LC-MS/MS analysis
All pesticides were analyzed in the positive ionization mode, precursor ions were detected as [M + H].
The procedure used for the identification of pesticide residues included retention time, two transitions, and the dynamic monitoring reaction monitoring, DMRM. The monitored ions for each compound are listed in Table 1.
The software tool Mass Hunter, used in this study, constructs automatically Table 1, based on retention times for the analytes in a detection window (Delta RT) to avoid loss of the analytes due to the peak dislocation, and a constant cycle of digitalization period (to provide enough number of data points in all peaks detected, i.e., > 10). In this study, the Delta RT was fixed at 1 min.10
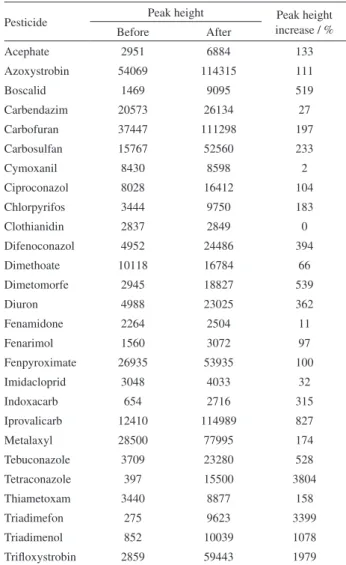
Table 2 shows peak height before and after optimization. At one hand, some pesticides had a slight increase in peak height, for example, clothianidin and cymoxanil had shown a 0.42 and 1.99% increase in peak height. At the other hand, some pesticides had brutal increase in peak height, for example, triadimefom had a 3399% increase in peak height after LC-MS/MS optimization.
Chromatographic conditions
Increasing the sample throughput of the ever-growing
number of analyses (routine) has become obligatory in method development.16 High throughput analysis in LC can be achieved with sub-3 µm core-shell technology. Core-shell columns are basically packed with 2.6 or 2.7 µm particles, including a 1.7 or 1.9 µm solid inner core surrounded by a thin 0.35 or 0.5 µm porous layer. An efficiency of ca. 80% of the one achieved with fully porous sub-2 µm particles has been reported with sub-3 µm core-shell particles but with a 2 to 3-times lower backpressure compared to sub 2 µm totally porous particles.16-19
To achieve high throughput analysis, we used a 100 × 2.1 mm i.d. column packed with 2.7 µm core-shell particles. This columns afford comparable efficiency and lower backpressure than columns packed with sub 2 µm totally porous particles. Using this column, we obtained low run time (17 min), low re-equilibration time (4.5 min), low mobile phase consumption (0.30 mL min-1). In addition, chromatographic analysis was carried out at 306 bar.
Table 2. Increase of peak height after LC-MS/MS optimization
Pesticide Peak height Peak height
increase / %
Before After
Acephate 2951 6884 133
Azoxystrobin 54069 114315 111
Boscalid 1469 9095 519
Carbendazim 20573 26134 27
Carbofuran 37447 111298 197
Carbosulfan 15767 52560 233
Cymoxanil 8430 8598 2
Ciproconazol 8028 16412 104
Chlorpyrifos 3444 9750 183
Clothianidin 2837 2849 0
Difenoconazol 4952 24486 394
Dimethoate 10118 16784 66
Dimetomorfe 2945 18827 539
Diuron 4988 23025 362
Fenamidone 2264 2504 11
Fenarimol 1560 3072 97
Fenpyroximate 26935 53935 100
Imidacloprid 3048 4033 32
Indoxacarb 654 2716 315
Iprovalicarb 12410 114989 827
Metalaxyl 28500 77995 174
Tebuconazole 3709 23280 528
Tetraconazole 397 15500 3804
Thiametoxam 3440 8877 158
Triadimefon 275 9623 3399
Triadimenol 852 10039 1078
Comparison between AOAC-2007.01 and EN 15662:2008
Anastassiades et al.20 described the QuEChERS method for the multiclass, multiresidue analysis of pesticides in fruits and vegetables. Lehotay et al.21 modified the method to use relatively strong acetate buffering conditions and Anastassiades et al.22 chose to use weaker citrate buffering conditions in terms of ionic strength. In 2010, Lehotay et al.23 compared AOAC Official Method 2007.01, which uses acetate buffering, with Standard Method EN 15662, which calls for citrate buffering. They found that both methods afford excellent and comparable results for 34 representative pesticides in apple-blueberry sauce.
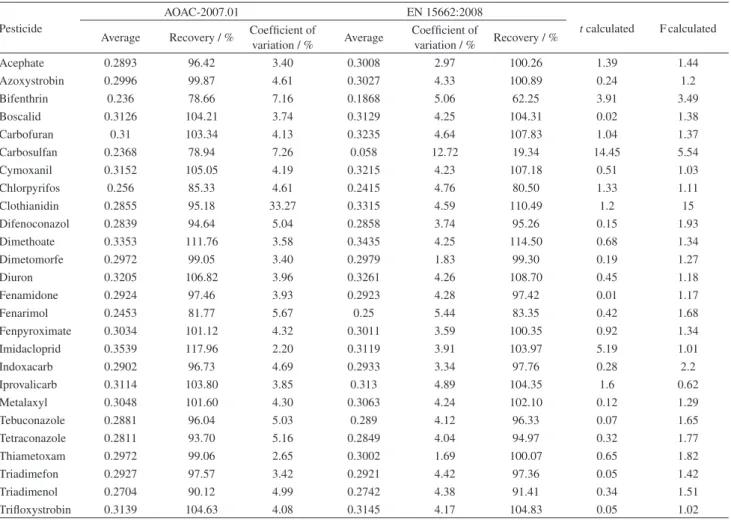
In this study, we compared AOAC-2007.01 and EN 15662:2008 for extraction and clean-up of 25 pesticides in grape juice. Comparisons were carried out with blank samples fortified at 0.3 mg L-1 and the results were shown in Table 3.
As shown in Table 3, AOAC-2007.01 and EN 15662:2008 afford similar coefficient of variation (CV) and recuperations. Excepted by carbosulfan that afforded
recuperation lower than the accepted limit, 70-120%, for EN 15662:2008 with 19.34% recuperation.24
The F-test tells us whether two variances are “significantly” different from each other. Considering the F-test at a confidence level of 95% [p (0.05)], CV obtained in AOAC-2007.01 and EN 15662:2008 were not significantly different. Thus, there were no statistic difference between CVs obtained with both method for the 25 pesticides studied.25,26
We use a t-test to compare averages, to decide
whether or not they are “equal”. Statisticians say that the null hypothesis is tested, which states that the average values from two populations (AOAC-2007.01 and EN 15662:2008) are not different. The F-test indicates that the CVs are statistically equivalent at a 95% confidence interval. Thus, t-test is carried out assuming equivalent variances.
The t-test, assuming similar CVs, showed that
carbosulfan and imidacloprid average concentrations in AOAC-2007.01 were different than concentrations in EN 15662:2008, while there were no evidence that the
Table 3. Comparison between recoveries obtained with AOAC-2007.01 and EN 15662:2008. Three blank grape juices were fortified at 0.3 mg L-1 for both
QuEChERS methods. t critical value was 2.77 and F critical value was 19. In the table were given calculated values for F-test and t-test
Pesticide
AOAC-2007.01 EN 15662:2008
t calculated Fcalculated Average Recovery / % Coefficient of
variation / % Average
Coefficient of
variation / % Recovery / %
Acephate 0.2893 96.42 3.40 0.3008 2.97 100.26 1.39 1.44
Azoxystrobin 0.2996 99.87 4.61 0.3027 4.33 100.89 0.24 1.2
Bifenthrin 0.236 78.66 7.16 0.1868 5.06 62.25 3.91 3.49
Boscalid 0.3126 104.21 3.74 0.3129 4.25 104.31 0.02 1.38
Carbofuran 0.31 103.34 4.13 0.3235 4.64 107.83 1.04 1.37
Carbosulfan 0.2368 78.94 7.26 0.058 12.72 19.34 14.45 5.54
Cymoxanil 0.3152 105.05 4.19 0.3215 4.23 107.18 0.51 1.03
Chlorpyrifos 0.256 85.33 4.61 0.2415 4.76 80.50 1.33 1.11
Clothianidin 0.2855 95.18 33.27 0.3315 4.59 110.49 1.2 15
Difenoconazol 0.2839 94.64 5.04 0.2858 3.74 95.26 0.15 1.93
Dimethoate 0.3353 111.76 3.58 0.3435 4.25 114.50 0.68 1.34
Dimetomorfe 0.2972 99.05 3.40 0.2979 1.83 99.30 0.19 1.27
Diuron 0.3205 106.82 3.96 0.3261 4.26 108.70 0.45 1.18
Fenamidone 0.2924 97.46 3.93 0.2923 4.28 97.42 0.01 1.17
Fenarimol 0.2453 81.77 5.67 0.25 5.44 83.35 0.42 1.68
Fenpyroximate 0.3034 101.12 4.32 0.3011 3.59 100.35 0.92 1.34
Imidacloprid 0.3539 117.96 2.20 0.3119 3.91 103.97 5.19 1.01
Indoxacarb 0.2902 96.73 4.69 0.2933 3.34 97.76 0.28 2.2
Iprovalicarb 0.3114 103.80 3.85 0.313 4.89 104.35 1.6 0.62
Metalaxyl 0.3048 101.60 4.30 0.3063 4.24 102.10 0.12 1.29
Tebuconazole 0.2881 96.04 5.03 0.289 4.12 96.33 0.07 1.65
Tetraconazole 0.2811 93.70 5.16 0.2849 4.04 94.97 0.32 1.77
Thiametoxam 0.2972 99.06 2.65 0.3002 1.69 100.07 0.65 1.82
Triadimefon 0.2927 97.57 3.42 0.2921 4.42 97.36 0.05 1.42
Triadimenol 0.2704 90.12 4.99 0.2742 4.38 91.41 0.34 1.51
remaining pesticides concentrations in both tests were different.
The AOAC-2007.01 method afforded better results for carbosulfan and imidacloprid than EN 15662:2008, thus, it was used as standard QuEChERS method in our laboratory.
Matrix effects
LC-MS/MS is susceptible to matrix effects which can adversely affect quantification depending on the analyte, matrix, sample preparation, instrumentation, and operating conditions. Among the approaches that reduce matrix effects, the most common in pesticide residue applications is matrix-matched calibration because it is relatively inexpensive and simple. In addition, it has been shown to work well during method validation when fortified samples are exactly matched with samples used for calibration.27-29
In 2012, Kwon et al.29 measured the variability of matrix effects for 38 representative pesticides in 20 samples each (including different varieties) of rice, orange, apple, and spinach extracted using the QuEChERS method for analysis by LC-MS/MS. They found that only oranges gave > 20% matrix effects for a few pesticides. In this study,
we compared responses from fortified blank samples and standard solution.
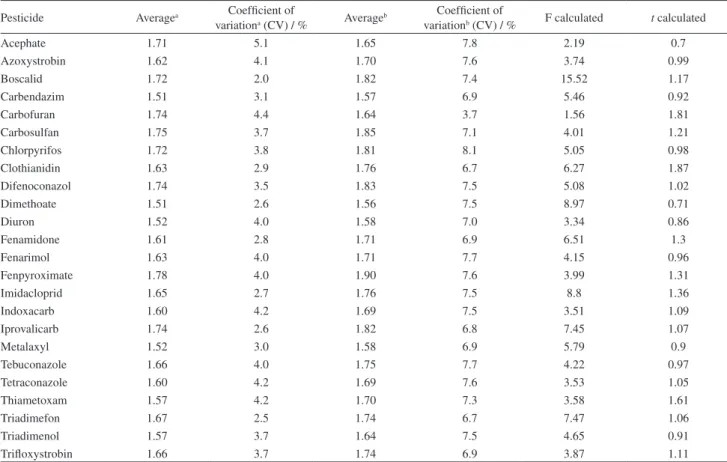
Table 4 had shown the average values and CVs of fortified blank grape juice at 2 mg L-1 and standard solutions at 2 mg L-1. Each experiment was carried out in triplicate. Calculated F and t values for fortified blank grape juice and standard solution are also given in Table 4.
The F-test, at a confidence level of 95% [p (0.05)], had shown that variances of the 25 pesticides for fortified blank grape juice and standard solution were not significantly different.
The t-test, at a confidence level of 95% [p (0.05)], assuming similar variances, had shown that concentrations obtained in fortified blank grape juice and standard solution were not significantly different for the 25 pesticides studied.
Chromatograms obtained for fortified samples and standard solutions were overlapped, which meant that matrix effect is negligible in this study.
Analytical methods validation
In Brazil, the National Agency for Sanitary Surveillance-ANVISA establishes maximum residue limits (MRLs) for
Table 4. Matrix effect study. Three blank grape juices and three fortified at 2 mg L-1 and three standard solutions were prepared at 2 mg L-1 level; t critical
value was 2.77 and F critical value was 19. In the table were given calculated values for F-test and t-test
Pesticide Averagea Coefficient of
variationa (CV) / % Averageb
Coefficient of
variationb (CV) / % F calculated t calculated
Acephate 1.71 5.1 1.65 7.8 2.19 0.7
Azoxystrobin 1.62 4.1 1.70 7.6 3.74 0.99
Boscalid 1.72 2.0 1.82 7.4 15.52 1.17
Carbendazim 1.51 3.1 1.57 6.9 5.46 0.92
Carbofuran 1.74 4.4 1.64 3.7 1.56 1.81
Carbosulfan 1.75 3.7 1.85 7.1 4.01 1.21
Chlorpyrifos 1.72 3.8 1.81 8.1 5.05 0.98
Clothianidin 1.63 2.9 1.76 6.7 6.27 1.87
Difenoconazol 1.74 3.5 1.83 7.5 5.08 1.02
Dimethoate 1.51 2.6 1.56 7.5 8.97 0.71
Diuron 1.52 4.0 1.58 7.0 3.34 0.86
Fenamidone 1.61 2.8 1.71 6.9 6.51 1.3
Fenarimol 1.63 4.0 1.71 7.7 4.15 0.96
Fenpyroximate 1.78 4.0 1.90 7.6 3.99 1.31
Imidacloprid 1.65 2.7 1.76 7.5 8.8 1.36
Indoxacarb 1.60 4.2 1.69 7.5 3.51 1.09
Iprovalicarb 1.74 2.6 1.82 6.8 7.45 1.07
Metalaxyl 1.52 3.0 1.58 6.9 5.79 0.9
Tebuconazole 1.66 4.0 1.75 7.7 4.22 0.97
Tetraconazole 1.60 4.2 1.69 7.6 3.53 1.05
Thiametoxam 1.57 4.2 1.70 7.3 3.58 1.61
Triadimefon 1.67 2.5 1.74 6.7 7.47 1.06
Triadimenol 1.57 3.7 1.64 7.5 4.65 0.91
Trifloxystrobin 1.66 3.7 1.74 6.9 3.87 1.11
various types of food. Table 5 shows the MRLs of pesticides and calibrations ranges in study.30
Recently, some pesticides have been banned after revaluation process. The frequent changes in the manufacture of pesticides and the discovery of new active ingredients of different classes make it difficult to monitor and control such residues, requiring constant improvement of the analytical methods.31,32 Thus, it is necessary to develop new and effective methods. In addition, this method was focused in pesticides, which were widely used in grape juice culture in Brazil, and the method is validated according INMETRO (Instituto Nacional de Metrologia Qualidade e Tecnologia), which is the Brazilian organization responsible for quality assurance.33
The concentration range (Table 6) presented linearity with the analytical signal, indicated by the values of determination coefficient (r2) greater than 0.99 for all compounds in solvent. The method presented sensitivity, once the angular coefficients of straights showed elevated values.31,34,35
Method precision was evaluated using CVs.31-35
Seven blank grape juice samples were independently fortified at 0.005, 0.1 and 2 mg L-1 and prepared by two technicians (technician 1 and technician 2). Then, CVs for 25 pesticides were evaluated by each technician are shown in Table 6.
Table 5. Calibration range and MRL
Pesticide Calibration range MRLa,b
Acephate 0.0025-1 Na
Azoxystrobin 0.005-2 0.5
Boscalid 0.01-5 3
Carbofuran 0.0025-1 Na
Carbosulfan 0.0025-1 Na
Cymoxanil 0.0025-1 0.1
Chlorpyrifos 0.005-2 Na
Clothianidin 0.0025-1 0.01
Difenoconazol 0.01-5 0.2
Dimethoate 0.0025-1 Na
Dimethoate 0.01-5 2
Diuron 0.0025-1 0.01
Fenamidone 0.01-5 0.2
Fenarimol 0.0025-2 0.05
Fenpyroximate 0.0025-1 Na
Imidacloprid 0.0025-1 Na
Indoxacarb 0.005-2 Na
Iprovalicarb 0.0025-1 Na
Metalaxmetalaxyl 0.005-2 1
Tebuconazole 0.01-5 0.5
Tetraconazole 0.005-2 0.2
Thiametoxam 0.005-2 0.2
Triadimefon 0.01-5 Na
Triadimenol 0.0025-1 Na
Trifloxystrobin 0.0025-1 Na
aMRL: maximum residue limits; bit is the lowest MRL value between
Brazil, Japan and USA; Na: not authorized.
Table 6. CVs obtained for two technicians (technician 1 and technician 2) for blank grape juice fortified at 0.005, 1 and 2 mg L-1
0.005 mg L-1 1 mg L-1 2 mg L-1
Technician 1 2 1 2 1 2
Acephate 16.3 14.4 13 13.8 8.5 13
Azoxystrobin 15.6 11.2 26.3 23.3 10.4 9.7
Boscalid 19.1 11.9 19 24.3 9.5 13.3
Carbofuran 15.2 18.4 21.1 17.5 9 6.7
Carbosulfan 27.7 17.6 26.6 29.6 13.9 13.4
Chlorpyrifos 18.8 14.1 26.1 23.2 9.1 9.1
Clothianidin 17.2 13 17.6 16.9 13 10.5
Difenoconazol 23.7 26.7 16 20.6 17.3 17.3
Dimethoate 15.2 13.5 20.6 24.4 11.8 13.5
Dimethoate 8.1 11.5 19.5 17.5 8.3 10.9
Diuron 13.6 11.5 12.1 15.3 10.9 12.1
Fenamidone 14.7 12.1 23.9 22.8 12.2 10.1
Fenarimol 21.2 20.3 29.1 29.5 8.2 11.3
Fenpyroximate 20.4 17.5 17 21.2 13.9 12.9
Imidacloprid 10.7 11.8 20.6 21.7 11.7 10.5
Indoxacarb 14.3 15 25.9 24.7 12.9 11.2
Iprovalicarb 18.8 13.9 14.6 13.4 11.1 10.3
Metalaxyl 16.5 13.8 19.7 17.4 7.4 9.9
Tebuconazole 13 15 20.7 16.6 13.3 12
Tetraconazole 14.3 13.8 23.9 21.6 9.9 12.6
Thiametoxam 11 14.1 22.5 17.8 10.5 8
Triadimefon 16.9 14.4 25.3 25.6 8.6 7.4
Triadimenol 19.1 18.8 22.5 22.3 11.8 10.7
The 25 pesticides investigated showed CVs within the recommended range given by SANCO, 2011 (< 20%) (Table 6). Thus, we concluded that the presented method is precise.24
Recovery was evaluated at 0.005 and 2 mg L-1 for three independent samples (Table 7).35 Pesticides investigated showed recovery values within the recommended range (70-120%). However fenpyroximate had shown recovery higher than 120%, while carbosulfan had shown recoveries lower than 70%.
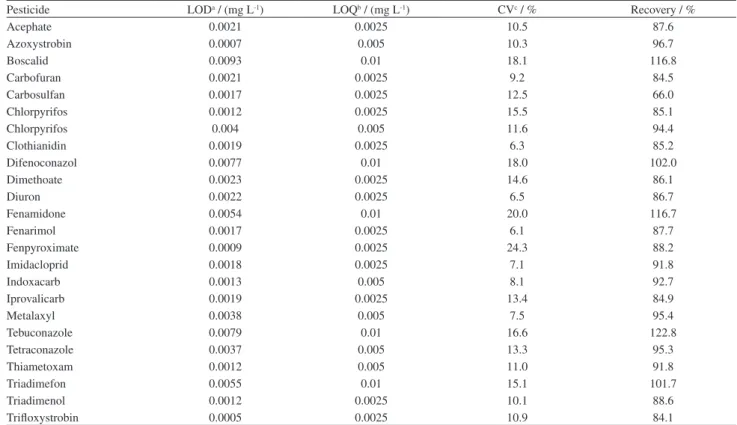
Limits of detection (LOD) were defined as LOD = X + s × t. We measured the signal from 7 blanks (containing no analyte) where X is the average value calculated from 7 replicate samples and s is the standard deviation calculated from these 7 replicate samples; t is the Student’s value for p = 0.05 and 6 degrees of freedom, 2.36. Limits of quantification (LOQ) were defined as the lower calibration levels. Recovery and CV were evaluated at the lowest calibration level to verify acceptances criteria (Table 8). In the lowest calibration level, investigated pesticides showed recovery values and CV within the recommended range (70-120%, < 20%). However, carbosulfan had shown recovery slight lower than 70% (66%) and tebuconazole had shown recovery slight higher than 120% (122%).
In addition, ten grape juice brands from Santa Catarina middle east, Brazil, were analyzed to evaluate the method
Table 8. Limits of detection (LOD), limits of quantification (LOQ), recovery and CV at the lowest calibration level
Pesticide LODa / (mg L-1) LOQb / (mg L-1) CVc / % Recovery / %
Acephate 0.0021 0.0025 10.5 87.6
Azoxystrobin 0.0007 0.005 10.3 96.7
Boscalid 0.0093 0.01 18.1 116.8
Carbofuran 0.0021 0.0025 9.2 84.5
Carbosulfan 0.0017 0.0025 12.5 66.0
Chlorpyrifos 0.0012 0.0025 15.5 85.1
Chlorpyrifos 0.004 0.005 11.6 94.4
Clothianidin 0.0019 0.0025 6.3 85.2
Difenoconazol 0.0077 0.01 18.0 102.0
Dimethoate 0.0023 0.0025 14.6 86.1
Diuron 0.0022 0.0025 6.5 86.7
Fenamidone 0.0054 0.01 20.0 116.7
Fenarimol 0.0017 0.0025 6.1 87.7
Fenpyroximate 0.0009 0.0025 24.3 88.2
Imidacloprid 0.0018 0.0025 7.1 91.8
Indoxacarb 0.0013 0.005 8.1 92.7
Iprovalicarb 0.0019 0.0025 13.4 84.9
Metalaxyl 0.0038 0.005 7.5 95.4
Tebuconazole 0.0079 0.01 16.6 122.8
Tetraconazole 0.0037 0.005 13.3 95.3
Thiametoxam 0.0012 0.005 11.0 91.8
Triadimefon 0.0055 0.01 15.1 101.7
Triadimenol 0.0012 0.0025 10.1 88.6
Trifloxystrobin 0.0005 0.0025 10.9 84.1
aLOD: limits of detection; bLOQ: limits of quantification; cCV: coefficient of variation.
Table 7. Recoveries and average concentrations for three independent fortified black samples at 0.005 and 2 mg L-1
Pesticide Concentration / %
0.005 mg L-1 2 mg L-1
Acephate 100.86 90.75
Azoxystrobin 114.02 110.19
Boscalid 119.00 118.61
Carbofuran 96.89 106.52
Carbosulfan 30.31 68.78
Chlorpyrifos 108.06 119.72
Chlorpyrifos 112.74 117.61
Clothianidin 102.93 117.77
Difenoconazol 107.30 113.97
Dimethoate 118.49 109.18
Diuron 96.89 110.92
Fenamidone 101.45 113.93
Fenarimol 103.72 111.58
Fenpyroximate 106.81 130.39
Imidacloprid 102.99 113.57
Indoxacarb 103.25 114.15
Iprovalicarb 104.76 115.17
Metalaxmetalaxyl 96.55 118.09
Tebuconazole 99.84 115.87
Tetraconazole 105.77 113.93
Thiametoxam 99.53 118.43
Triadimefon 110.95 111.56
Triadimenol 72.27 99.67
efficiency. The 25 pesticides were not found in nine of ten samples (concentration lower than LOD). However, one of the samples had shown presence of azoxystrobin, metalaxyl, tebuconazole in the concentrations of 8, 5 and 10 µg L-1, respectively. These concentrations are lower than the MRL established in Brazil, USA and Japan.
Conclusions
The validation of the presented method was carried in accordance with INMETRO, obtained results had shown that our method is linear, selective, accurate, and exact. The LOD and LOQ were adequate for pesticide analysis in grape juice, since these parameters were lower than established MRLs. The matrix effect was not found in the pesticides evaluated and the calibration curve was built in solvent.
The main objective of this study was develop an inexpensive and efficient method for the determination of pesticide residues in grape juice. Thus, our objectives were achieved, since the presented method was validated and it is cheap and fast.
Supplementary Information
Supplementary data are available free of charge at http://jbcs.sbq.org.br as PDF file.
Acknowledgments
The authors acknowledge financial support and fellowships from the Brazilian Agencies FAPESC (Fundação de Amparo a Pesquisa do Estado de Santa Catarina), CNPq (Conselho Nacional de Desenvolvimento Científico e Tecnológico), CAPES (Coordenação de Aperfeiçoamento de Pessoal de Nível Superior) and Senai/SC (Serviço Nacional de Aprendizagem Industrial).
References
1. Mol, H. G.; Plaza-Bolaños, P.; Zomer, P.; de Rijk, T. C.; Stolker, A. A.; Mulder, P. P.; Food Chem. 2011, 125, 803.
2. Radišić, M.; Grujić, S.; Vasiljević, T.; Laušević, M.; Food Chem.
2009, 113, 712.
3. Masiá, A.; Blasco, C.; Picó, Y.; Trends Environ. Anal. Chem.
2014, 2, 11.
4. Ferrer, C.; Martínez-Bueno, M.; Lozano, A.; Fernández-Alba, A.; Talanta 2011, 83, 1552.
5. Radišić, M. M.; Vasiljević, T. M.; Dujaković, N. N.; Laušević, M. D.; Food Anal. Methods 2013, 6, 648.
6. Golge, O.; Kabak, B.; J. Food Compos. Anal. 2015, 41, 86.
7. Oliveira, F. A. S.; Madureira, F. D.; Lopes, R. P.; Ferreira, M. G.; Soto-Blanco, B.; Melo, M. M.; Quim. Nova 2014, 37, 1699.
8. Lopes, R. P.; Oliveira, F. A.; Madureira, F. D.; Oliveira, M. L. G.; Silva, G.; Anal. Methods 2015, 7, 4734.
9. González-Curbelo, M. Á.; Socas-Rodríguez, B.; Herrera-Herrera, A. V.; González-Sálamo, J.; Hernández-Borges, J.; Rodríguez-Delgado, M. Á.; TrAC, Trends Anal. Chem. 2015, 71, 169.
10. Andrade, G.; Monteiro, S.; Francisco, J.; Figueiredo, L.; Botelho, R.; Tornisielo, V.; Food Chem. 2015, 175, 57.
11. Masiá, A.; Ibáñez, M.; Blasco, C.; Sancho, J.; Picó, Y.; Hernández, F.; Anal. Chim. Acta 2013, 761, 117.
12. Jardim, A. N. O.; Mello, D. C.; Goes, F. C. S.; Frota, E. F.; Caldas, E. D.; Food Chem. 2014, 164, 195.
13. Jardim, A. N.; Caldas, E. D.; Food Control 2012, 25, 607. 14. Rebelo, A. M.; Heller, M.; Dolzan, M. D.; Deschamps, F. C.;
Abate, G.; Micke, G. A.; Grassi, M. T.; Anal. Methods 2014, 6, 9469.
15. Rebelo, A. M.; Dolzan, M. D.; Heller, M.; Deschamps, F. C.; Abate, G.; Micke, G. A.; Grassi, M. T.; J. Braz. Chem. Soc.
2016, 27, 186.
16. Borges, E. M.; Rostagno, M. A.; Meireles, M. A. A.; RSC Adv.
2014, 4, 22875.
17. Fekete, S.; Kohler, I.; Rudaz, S.; Guillarme, D.; J. Pharm. Biomed. Anal. 2014, 87, 105.
18. Borges, E. M.; J. Chromatogr. Sci. 2015, 53, 580.
19. Borges, E. M.; Euerby, M. R.; J. Pharm. Biomed. Anal. 2013, 77, 100.
20. Anastassiades, M.; Lehotay, S. J.; Štajnbaher, D.; Schenck, F. J.; J. AOAC Int. 2003, 86, 412.
21. Lehotay, S. J.; Maštovská, K.; Lightfield, A. R.; J. AOAC Int.
2005, 88, 615.
22. Anastassiades, M.; Scherbaum, E.; Taşdelen, B.; Štajnbaher, D. In Pesticide Chemistry: Crop Protection, Public Health, Environmental Safety; Ohkawa, H.; Miyagawa, H.; Lee, P. W., eds.; Wiley-VCH: Weinheim, 2007, 439.
23. Lehotay, S. J.; Son, K. A.; Kwon, H.; Koesukwiwat, U.; Fu, W.; Mastovska, K.; Hoh, E.; Leepipatpiboon, N.; J. Chromatogr. A
2010, 1217, 2548.
24. SANCO/12571/2013: Guidance Document on Analytical Quality Control and Validation Procedures for Pesticide Residues Analysis in Food and Feed, 2013.
25. Borges, E. M.; Volmer, D. A.; Brandelero, E.; Gelinski, J. M. L. N.; Gallimberti, M.; Barbosa Jr., F.; Food Anal. Methods, in press, DOI: 10.1007/s12161-015-0191-x. 26. Borges, E. M.; Volmer, D. A.; Gallimberti, M.; de Souza,
D. F.; de Souza, E. L.; Barbosa, F.; Anal. Methods 2015, 7, 2577.
27. Ding, S.; Schoenmakers, I.; Jones, K.; Koulman, A.; Prentice, A.; Volmer, D. A.; Anal. Bioanal. Chem. 2010, 398,
28. Bylda, C.; Thiele, R.; Kobold, U.; Volmer, D. A.; Analyst 2014, 139, 2265.
29. Kwon, H.; Lehotay, S. J.; Geis-Asteggiante, L.; J. Chromatogr. A
2012, 1270, 235.
30. Brasil, Decreto No. 4.074 de 04 de janeiro de 2002, Diário Oficial da União, 08 janeiro de 2002.
31. Silva, R. O.; de Castro, R. C.; Milhome, M. A. L.; do Nascimento, R. F.; LWT-Food Sci. Technol. 2014, 59, 21.
32. Milhome, M. A.; Sousa, P. L.; de Keukeleire, D.; Nascimento, R. F.; J. Braz. Chem. Soc. 2011, 22, 2048.
33. Instituto Nacional de Metrologia (INMETRO); Orientações sobre Validação de Métodos de Ensaios Químicos, DOQ-CGCRE-008, 2003.
34. Causon, R.; J. Chromatogr. B: Anal. Technol. Biomed. Life Sci.
1997, 689, 175.
35. Peters, F. T.; Drummer, O. H.; Musshoff, F.; Forensic Sci. Int.
2007, 165, 216.
Submitted: November 18, 2015