Article
Electrochemical Behavior of Rhodium Acetamidate Immobilized on a
Carbon Paste Electrode: a Hydrazine Sensor
Eric de S. Gil and Lauro T. Kubota*
Instituto de Química, Universidade Estadual de Campinas, CP 6154, 13083-970, Campinas - SP, Brazil.
O comportamento eletroquímico do acetamidato de ródio imobilizado em pasta de carbono e as potencialidades para construção de sensores foram avaliados. O complexo imobilizado mostrou boa estabilidade e propriedades redox, sendo observados dois pares redox reversíveis com potenciais médios entre 0,15 e 0,55 V vs SCE. Entretanto, a resolução dos picos voltamétricos mostrou-se dependente do eletrólito suporte. A correlação entre a capacidade coordenante do eletrólito e seus respectivos potenciais médios sugere que o eletrólito deve coordenar-se em posição axial nos complexos. Além disto, a posição axial deve ser o sítio catalítico, sendo que a oxidação de espécies doadoras, como hidrazina, foi catalisada por estes complexos. O baixo potencial (<300 mV) mostra uma boa viabilidade deste composto para a confecção de sensores para a hidrazina, minimizando problemas de interferentes. Uma boa faixa de resposta linear para a hidrazina foi ajustada pela equação i = 23,13 (± 0,34) c , onde i = corrente em mA and c = concentração em mol dm-3 na faixa
de 10-5 a 10-2 mol dm-3.O baixo tempo de resposta (~1 s) poderia ser útil em análises por injeção
em fluxo. Este sistema foi bem estável e apresentou boa repetibilidade, mesmo após 30 medições, com uma variância de 0,5 %.
The electrochemical behavior of rhodium acetamidate immobilized in carbon paste electrode and the consequences for sensor construction were evaluated. The electrode showed good stability and redox properties. Two reversible redox couples with midpoint potentials between 0.15 and 0.55 V vs SCE were observed. However, peak resolution in voltammetric studies was very dependent on the supporting electrolyte. The correlation between coordinating power of the electrolyte and peak potential suggests that the electrolyte can coordinate through the axial position of the complexes. Furthermore, the axial position may be also the catalytic site, as a catalytical response was observed for hydrazine oxidation. A good linear response range for hydrazine was fit by the equation i = 23.13 (± 0.34) c , where i = current in mA and c = concentration in mol dm-3 in the range of 10-5 up to
10-2 mol dm-3. The low applied potential (<300 mV) indicates a good device for hydrazine sensor,
minimizing interference problems. The short response time (~1 s) may be useful in flow injection analysis. Furthermore, this system was very stable presenting good repeatability even after 30 measurements with a variance of 0.5 %.
Keywords: rhodium acetamidate, electrochemical sensors, hydrazine determination, carbon paste electrode, polyethylenimine
*e-mail: [email protected]
Introduction
The researches for the development of new sensors have been a subject of great interest1-3. The greatest challenge
in this field is the combination of the selectivity, sensitiv-ity, simplicsensitiv-ity, rapidity4-5.
These characteristics are very important in analytical chemistry, mainly in complex samples6. In order to improve
these characteristics the use of new materials in sensors has included many species such as metal complexes7, enzymes8
and DNA9. These modifications consist in immobilizing
some catalyst or electron mediator species to electrocatalyze the oxidation or reduction of target analytes without appli-cation of high overpotentials7-9. For this purpose, the use
of Rhodium Acetamidate Modified Electrode (RAME) has been described10. This complex presents few
electrochemi-cal studies, all of which in non-aqueous solution. Thus, it is very important in the sensors construction, to study the electrochemical behaviour, specially that of the immobi-lized complex that is unleachable in aqueous solutions. Furthermore, this complex belongs to an excellent class of catalysts and potential antitumour agents11-13. Concerning
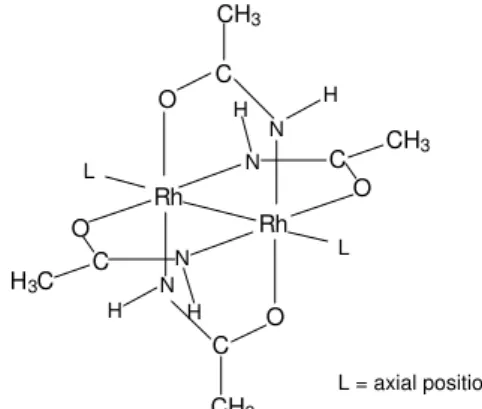
the cytostatic activity of these species, the most commonly proposed interaction is the axial (L) coordination (Figure 1)through nitrogen, oxygen or sulfur atoms of enzymes or DNA11,12. Hence, the affinity of rhodium complexes for
nitrogenated groups could be exploited to increase the selectivity for nitrogen-bearing analytes, while their cata-lytic power can improve the sensitivity12. On the other
hand, the biological significance of hydrazine compounds requires versatile methods for environmental and industrial monitoring for its determination at low levels14,15. Besides,
this molecule presents great reactivity and high affinity by metal centers, where it can be oxidized16. Based on this
context, the electrochemistry of rhodium acetamidate im-mobilized on carbon paste was studied and its possible aplication for hydrazine sensing investigated.
with 6 mg of rhodium acetamidate and 100 mm-3 of PEI
1% (water solution), 2) drying of this mixture at room tem-perature and 3) adding enough mineral oil to form a paste. This paste was put into a cavity of the platinum disk of 1 mm deep and 5 mm diameter sealed in the extremity of a glass tube.
Studies of supporting electrolyte effects
The effects of the nature of supporting electrolyte in-vestigation was carried out by using 0.5 mol dm-3KCl,
NaCl, LiCl, KAc, KNO3 and K2SO4 solutions at pH 7. The cyclic voltammograms were recorded in the potential range of 0-800 mV at a scan rate of 10 mV s-1. The studies of the
electrolyte concentration influence were carried out for KCl and KNO3 in the concentration range of 0.1 up to 1.0 mol dm-3.
pH influence
The studies of solution pH were evaluated over the range from 0 up to 800 mV vs SCE, in 0.5 mol dm-3 KNO
3
and KCl. The solution pH between 2 and 8 was adjusted with dilute HCl or NaOH solutions. The scan rate for these studies was 10 mV s-1, keeping the ionic strength in 0.5
mol dm-3.
Studies of the scan rate and stability
These studies were carried out in 0.5 mol dm-3 KCl
and KNO3 at pH 7, with scan rates of 2, 5, 10, 20, 30, 40, 50 and 60 mV s-1 (0-800 mV). In order to verify the stability
of this system, 40 cycles were carried out at a scan rate of 10 mVs-1 and 10 cycles at 2 mVs-1, immediately after the
preparation of the paste and after 4 months of storage.
Catalytic activitiy
The catalytic activity was initially evaluated by means of cyclic voltammetry in the same potential range used for all other studies (0-800 mV), by dropwise addition of 50 mm3 of 0.2 mol dm-3 hydrazine solution, in an electro-chemical cell containing 5 cm3 of 0.5 mol dm-3 KCl
solu-tion at pH 7. The scan rate was 10 mV s-1.
Chronoamperometric studies
For the calibration curves, the electrochemical cell was filled with 5 cm3 of 0.5 mol dm-3 KCl solution at pH 7,
fixing the potential in 300 mV vs. SCE and the rotation speed of the electrode in 200 rpm. The addition of 50 mm3
of a 0.02 mol dm-3 hydrazine solution was carried out step
by step.
L = axial position L
L
H H
H H
N N
N N
C
C
C
C
CH3
H3C
CH3
CH3
O O
O
O Rh Rh
Figure 1. Structure of rhodium acetamidate.
Experimental
Chemicals
Rhodium acetamidate was synthesized by stepwise ex-change reaction of [Rh2(O2CCH3)4] with acetamide as pre-viously described17. The carbon powder was purchased
from BDH (Poole UK). Polyethylenimine and hydrazine were from Sigma Chemical Co. All salts used for the elec-trochemical studies were of analytical grade.
Electrochemical behavior of rhodium acetamidate solubilized in aqueous solutions
The midpoint potential for 1.0 x 10⁻³ mol dm-3
[Rh2(HNOCCH3)4] aqueous solution with 0.5 mol dm-3 KCl, pH 7, was determined by scanning the potential in a range of 0-800 mV with scan rate of 25 mV s-1.
Preparation of RAME
The carbon paste modified electrode was prepared in three steps: 1) mixing 80 mg of graphite powder (99.9%)
Instrumentation
The electrochemical measurements were made on a Princeton Applied Research (PAR) 273A potentiostat/ galvanostat and a Pine AFMSRX 002 rotatory system. The solutions pH were adjusted with the aid of a Corning 450 pH/ion meter. The cyclic voltammetry measurements were carried out utilizing a three-electrode system. The working electrodes were a platinum-disk electrode (to study of free rhodium acetamidate in aqueous solution) and Rhodium Acetamidate Modified Electrode (RAME). The reference electrode was a saturated calomel electrode (SCE), and a platinum wire was used as the counter electrode.
Results and Discussion
Cyclic voltammetry behavior of soluble [Rh2 (O2CCH3)4] in aqueous solution.
The electrochemical behavior of rhodium acetamidate and other dimeric analogues found in the literature until now have been investigated only in non aqueous systems. There is an agreement that the oxidation processes are metal centered and that they occur in two steps with dis-tinct formal potentials (Em1 and Em2)12,17,18:
Em1 RhII/RhII,III: [Rh2(HNOCCH3)4(S)2] ↔
[Rh2 (HNOCCH3)4(S)2]+ + 1e
-Em2 RhII,III/RhIII: [Rh
2(HNOCCH3)4(S)2]+↔
[Rh2(HNOCCH3)4(S)2]2+ + 1e
-Comparison between [Rh2(acetate)4] and [Rh2 (aceta-midate)4] shows that these processes are shifted to lower potentials when the bridging acetate groups from the equa-torial positions are changed by acetamidates, due to the stronger basicity of the amide. This will stabilize the oxi-dized form, since the electron density on the two metal centers is increased. Indeed, for each equatorial group ex-changed, a decrease of 225 mV in its midpoint potential Em [where: Em=(Ea +Ec)/2] is observed18. Less intense
effects are also observed upon changing ligangs in the axial positions17-19. Table 1 shows the values for both
midpoint potentials (Em1 and Em2) obtained for rhodium acetamidates under the same conditions in different sol-vents. A linear inverse correlation between electron donor power and Em was observed, except for dimethylsulfox-ide (DMSO) and triphenylphosphine (PPh3), in CH2Cl2. This fact was assigned to the π back-donation mechanism from the Rh-Rh to DMSO or PPh3 which withdraws some electron density from the metal centers19. The influence
of axial ligands was also observed for aqueous systems in our experiments. The axial coordination with chloride
anions (Table 2) resulted in a significant shift towards lower potentials, when compared to the literature data (Table 1). These observations agree with the literature data, that show that redox processes are favored by axial coordination which stabilizes the intermediate species or makes the oxidation process easier by increasing the electron density17-19.
Fur-thermore, in the presence of higher Cl- levels a decrease in ∆E or about 100 mV for Em1 and 50 mV for Em2 was observed (scan rate of 25 mV s-1). These facts show that
the chloride ion enhances the electron transfer.
Table 1. Em1 and Em2 values (mV) for rhodium acetamidate in different media.
SOLVENT Em1 Em2 Ref.
Acetonitrile 150 1.410 [18]
Pyridine 8 0 - [17]
Dimethylsulfoxide 310 - [17]
PPh3 0.1mol dm-3 / CH
2Cl2 250 1.650 [17]
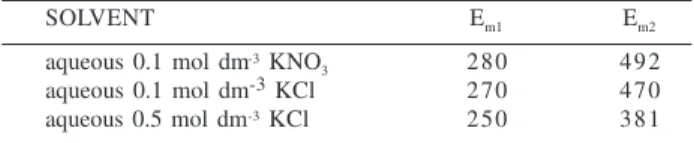
Table 2. Em1 and Em2 values (mV) for rhodium acetamidate 1.0 x 10⁻³ mol dm-3 in different supporting electrolytes, obtained with a
platinum disk electrode.
SOLVENT Em1 Em2
aqueous 0.1 mol dm-3 KNO
3 280 492
aqueous 0.1 mol dm-3 KCl 270 470
aqueous 0.5 mol dm-3 KCl 250 381
Electrochemical behavior of RAME in different electrolytes
The electrochemical experiments were undertaken in aqueous solutions, since the aim of this work was the de-velopment of sensors, which could be useful for biologi-cal applications. The midpoint potentials were determined in aqueous electrolyte solutions (Figure 2) and they are listed in Table 3.
Figure 2. Cyclic voltammograms of RAME (2nd cycle) in different
anions supporting electrolyte solutions (0.5 mol dm-3, pH 7, 0-800
The most interesting fact to be higlighted is that coordi-nating anions like chloride can induce the appearance of the first oxidation peak. It should be correlated with the forma-tion of an intermediate species Rh2II,III, which appears only
after the second cycle when the complex is immobilized (Figure 3). For the other non-coordinating electrolytes, the first anodic peak is not well visualized while the resolution of the second reduction peak is slightly improved (Figure 2). This behavior can be explained by the interaction be-tween immobilized complexes and electrolytes being more difficult than those observed for soluble ones. Hence, the first cycle is necessary to form [Rh2III]2+ species, which has
higher affinity for anionic species. Furthermore, the interac-tion between complex and electrolytes may be more effec-tive through the axial position17-19. For this reason, volta-mmograms in the presence of coordinating anions such as chloride may exhibit different patterns from those with non-coordinating anions. Thus, the chloride anions can form adducts with these dimers, due to its stronger interaction in the axial positions. The formation constants reported for the first coordination are much higher than for the second, and upon decreasing the concentrations of the ligand the coordination become more difficult12. Thus, different
spe-cies can be formed depending on the chloride concentra-tion in the medium. For soluble complexes larger shifts in the midpoint potentials were observed depending on the supporting electrolytes. In the particular case of aqueous solutions containing chloride, it was observed that these shifts were also dependent on their concentrations.
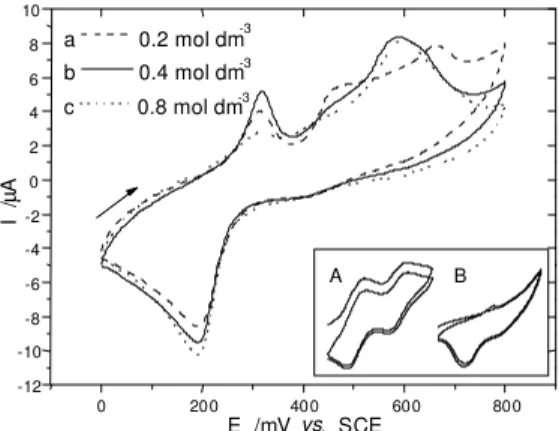
The remarkable effects of chloride anions were also observed for RAME, not only when their concentration was changed (Figure 3), but also when the counterion was exchanged for more electropositive and mobile cat-ions (Figure 4).
In Figures 3 and 4, it can be noted that the same splitting pattern observed for lower chloride concentrations was also observed for lithium supporting electrolyte solution. In both cases, these splittings can be correlated to the formation constants, which can result in different coordination spe-cies. Thus, in case of chloride anions the formation con-stants may be dependent on the concentration levels and electropositivity (anion affinitiy) of the cations.
Table 3. Midpoint potentials (Em1 and Em2) obtained for RAME in different electrolytes.
Electrolytes Em1 /mV Em2 /mV
LiCl 240
-NaCl 240
-KCl 240
-KNO3 - 422
K2SO4 - 469
KAc - 446
10 mV s-1, [electrolyte] = 0.5 mol dm-3, pH 7.
B A
0 200 400 600 800
-12 -10 -8 -6 -4 -2 0 2 4 6 8 10
a 0.2 mol dm-3
b 0.4 mol dm-3
c 0.8 mol dm-3
I /
µ
A
E /mV vs. SCE
Figure 3. Cyclic voltammograms of RAME in different concentra-tion of KCl soluconcentra-tions (0.2, 0.4, 0.8 mol dm-3, pH 7, 0-800 mV, 10
mVs-1), [in the box: 1st and 2nd cycle for A) soluble, B) immobilized
complex (0.5 mol dm-3 KCl, pH 7, 25 mV s-1 0-650 mV) ].
0 200 400 600 800
-6 -4 -2 0 2 4 6
Li+ Na+
K+
I
/µ
A
E /mV vs. SCE
Figure 4. Cyclic voltammograms of RAME in 0.5 mol dm-3 MCl
supporting electrolyte solutions (M = Li, Na, K) at pH 7, potential range of 0-800 mV, and scan rate of 10 mV s-1).
In addition, RAME presented different ratios between cathodic and anodic peaks depending on the kind of the electrolyte (coordinating or non-coordinating) (Figure 2). In-deed, only one of the midpoint potentials could be deter-mined precisely (Em1 for chloride and Em2 for the non-coor-dinating anions). In order to evaluate both processes two kinds of electrolytes were used for solution pH effect evaluation on RAME behavior (Table 3). The formal potential invariance on the pH between 2 and 8 agrees with the literature data, where the redox process is metal centered17-19.
shows that the first cathodic peak is completely suppressed, when the switching potentials are lower than those required to get the second anodic peak for RAME. It is important to note that for the soluble complex no interdependence between Em1 and Em2 was observed (Figure 5b). Thus, the rever-sibility of each redox couple was somewhat impaired after the immobilization.
Catalytic activity for hydrazine electrooxidation
The electrocatalytic activity of the rhodium complex was verified initially by cyclic voltammetry. The catalytic power of this system showed to be very efficient for hydra-zine oxidation, due to the bubbles formed (probably ni-trogen) on the surface of RAME. To improve its perfor-mance a rotatory system was used, in which at least 100 rpm were needed to avoid the bubble deposition on the electrode surface. The catalytic efficiency was better in the pH between 5 and 9 (Figure 7). The anodic peak cur-rent decreases meaningfully below pH 5, when no cata-lytic response was observed under strongly acidic condi-tions, due to the lower affinity between protonated hydra-zine and metallic center.
Furthermore, under alkaline conditions (pH >8), the re-sponse begins to decrease slowly because the stability of rhodium acetamidate is not so good in alkaline conditions, thus the pH 7 was chosen for the measurements. The cata-lytic reaction starts effectively at low potentials like 150 mV, and the response increases sharply after 200 mV up to 350 mV when it reaches a maximun current level (Figure 8). These potentials were very low, since that hydrazine is oxi-dized on a platinum disk electrode at 1.16 V 20.
The applied potential of 300 mV vs SCE, pH 7 and 200 rpm were employed in all subsequent work, as a compro-mise between sensitivity and selectivity. Under these con-ditions, a good linear response range between 1.0 x 10⁻⁵ and 1.0 x 10⁻² mol dm-3 hydrazine concentration was
ob-served, fit by the equation i = 23.13 (± 0.34) c with a corre-lation coefficient of 0.9988 for n = 15, where the current (i) is given in mA and hydrazine concentration (c) in mol dm-3. Table 4. Current ratio and midpoint potentials (mV) in different
pH, obtained for RAME vs SCE in solutions of 0.5 mol dm-3 of
KCl or KNO3
pH Em1 (KCl) I1A / I1C Em2 (KNO3) I2A / I2C
2 258 0.33 426 1.73
3 259 0.34 424 1.73
4 260 0.35 420 1.72
5 261 0.36 421 1.72
6 262 0.37 420 1.71
7 261 0.38 420 1.72
8 262 0.39 424 1.73
0 200 400 600 800
-6 -4 -2 0 2 4 6 8 10
b a
I /
µ
A
E / mV vs SCE
0 200 400 600 800
-600 -400 -200 0 200 400 600
I /
n
A
E / mV vs SCE
Figure 5. Cyclic voltammograms with different switching poten-tials for a)“immobilized complex” (RAME), and b) “soluble com-plex” at concentration of 1.0 x 10⁻³ mol dm-3 both in the following
conditions: 0.5 mol dm-3 KCl, pH 7, 0-800 mV, 10 mV s-1.
Studies of scan rate
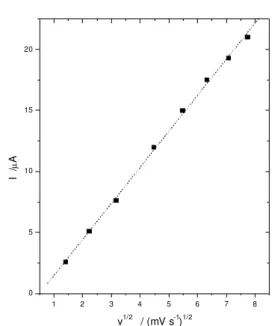
The increase of the scan rate provoked an increase in the ∆E value. The resulting plot ipavs v1/2 (Figure 6) is linear in the range between 2 and 60 mV s-1. This behavior
indicates that diffusion-controlled redox process occurs in the system. However, this system presented very good stability even after 4 months of storage or in continuous use. This behavior suggests that the complex is strongly adsorbed and the supporting electrolytes should be re-sponsible for the charge compensation, explaining the diffusion controlled process.
1 2 3 4 5 6 7 8
0 5 10 15 20
I /
µ
A
v1/2 / (mV s-1)1/2
Conclusions
The potentialities of these complexes for sensors con-struction were evaluated showing to be very promising for sensing molecules of biological interest, mainly if they could interact through their axial positions. In the hydra-zine case, the detection limit is not very low, but this sys-tem presented a wide linear response range and it can be useful for sensors. The very short response time (1 s) could be very attractive to apply in flow injection analysis. Other good characteristic of RAME was the relative low applied potential (~300 mV) for hydrazine detection. Besides, the electrochemistry of these complexes could add more in-formation to the rhodium’s chemistry, specially for dimers, helping a better understanding of many mechanisms in-cluding the catalytic and citostatic activity.
Acknowledgments
The authors thank Prof. Renato Najjar, Prof. Aparecido Ribeiro de Souza and Breno Pannia Esposito for the im-portant help with the discussions about the synthesis and FAPESP for the financial support.
References
1. Kubota, L. T.; Gouvea, F.; Milagres, B. G.; Andrade, A. N.; Oliveira Neto, G. de Electrochim. Acta1996, 41, 1465.
2. Gorton, L. Electroanalysis1995, 7, 23.
3. Gilmartin, M. A. T.; Hart, J. P. Analyst1995, 120, 1029. 4. Csöregi, E.; Gorton, L.; Marko-Varga, G.; Tudos, A.
J.; Kok, W. T. Anal. Chem.1994, 66, 3604.
5. Bindra, D. S.; Zhang,Y.; Wilson, G. S.; Sternberg, R.; Thevenot, D. R.; Moatti, D.; Reach, G. Anal. Chem.
1991, 63, 1692.
6. Gorton, L.; Jonsson, P.; Csöregi, E.; Johansson, K.; Dominguez, E.; Marko-Varga, E. Analyst1992, 117, 1235.
7. Milagres, B. G.; Oliveira Neto, G. de; Kubota, L. T. Electroanalysis1996, 8, 489.
8. Kalcher, K.; Kauffmann, J. M.; Wang, J.; Svancara, I.; Vytras, K.; Neuhhold, C.; Zhongping, Y. Elec-troanalysis1995, 7, 1.
9. Brett, A. M. O.; Serrano, S. H. P.; La-Scalea, M. A. Electroanalysis1996, 8, 1237.
10. Gil, E. S.; Najjar, R.; Kubota, L. T. Quim. Nova1998, 21, 755.
11. Bear, J. L. Cancer Chemother. Rep.1975, 59, 611. 12. Boyar, E. B.; Robinson, S. D. Coord. Chem. Rev.1983,
50, 109.
0 200 400 600 800 -2
0 2 4 6
3 4 5 6 7 8 9
0,0 0,5 1,0 1,5 2,0 2,5 3,0 3,5 4,0
I /
µ
A
E / mV vs. SCE
I /
µA
pH
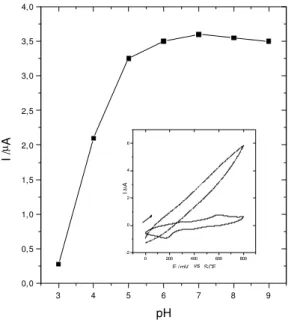
Figure 7. Plot of the oxidation peak currents of the RAME at a function of solution pH in presence of 1.0 x 10⁻⁴ mol dm-3
hydra-zine, w = 200 rpm, Eapp = 300 mV. [in the box: Cyclic voltammo-grams obtained for RAME in presence and absence of hydrazine (KCl 0.5 mol dm-3, pH 7, 10 mV s-1, 0-800 mV)].
50 100 150 200 250 300 350 400 450 500
1.4 1.6 1.8 2.0 2.2 2.4 2.6 2.8 3.0 3.2 3.4
I /µ
A
E /mV vs SCE
Figure 8. Dependence on the oxidation peak currents of the RAME at a function of applied potential in pH 7, in presence of 1.0 x 10⁻⁴
mol dm-3 hydrazine, w = 200 rpm.
The detection limit was of 5.0 x 10⁻⁶ mol dm-3 deter-mined as 3 times the noise level and the sensitivity was of 30 mA dm3 mol-1. Furthermore this system showed very good repeatability after 30 measurements with a relative standard deviation of 0.48 %.
The reaction order (1.01) for hydrazine oxidation ob-tained from the curve ln i vs. ln c (not shown) fit by the equation ln i = -3.5 (± 0.1) + 1.01 (± 0.01) ln c is somewhat higher than values reported for platinum electrodes, where the reaction order was about 0.5 20. In addition, the
13. Doyle, M. P.; Bagheri, V.; Wandless, T. J.; Harn, N. K.; Brinker, D. A.; Eagle, C. T.; Loh, K. L. J. Am. Chem. Soc.1990, 112,1906.
14. Perez, E. F.; Oliveira Neto, G. de; Tanaka, A. A.; Kubota, L. T. Electroanalysis1997, 10, 111. 15. Casella, I. G.; Guascito, M. R.; Salvi, A. M.; Desimini, E.
Anal. Chim. Acta 1997, 354, 333.
16. Zagal, J. H.; Lira.S.; Ureta-Zanãrtu, S. J. Electroanal. Chem.1986, 210, 95.
17. Duncan, J.; Malinski, T.; Zhu, T. P.; Hu, Z. S.; Kadish, K. M. J. Am. Chem. Soc.1982, 104, 5507.
18. Chavan, M. Y.; Zhu, T. P.; Lin, X. Q.; Ahsan, M. Q.; Bear, J. L.; Kadish, K. M. Inorg. Chem.1984, 23,4538.
19. Zhu, T. P.; Ahsan, M. Q.; Malinski, T.; Kadish, K. M.; Bear, J. L. Inorg. Chem.1984, 23,2.
20. Garcia, M. D.; Marcos, M. L.; Velasco, J. G. Elec-troanalysis 1996, 8, 267.
21. Zagal, J. H. Coord. Chem. Rev. 1992, 119, 89. 22. Yu, A.; Chen, H. Anal. Lett. 1997, 30, 599.
23. Guerra, S. V.; Xavier, C. R.; Nakagaki, S.; Kubota, L. T. Electroanalysis 1998, 10, 462.
Received: September 16, 1999