Intraspecific genetic diversity of
Drechslera tritici-repentis
as detected by
random amplified polymorphic DNA analysis
Ana Maria Pujol Vieira dos Santos
1, Aida T. Santos Matsumura
1and Sueli Teresinha Van Der Sand
2 1Departamento de Fitossanidade, Universidade Federal do Rio Grande do Sul, Porto Alegre, RS, Brazil.
2Departamento de Microbiologia do Instituto de Ciências Básicas da Saúde, Universidade Federal
do Rio Grande do Sul, Porto Alegre, RS, Brazil.
Abstract
The phytopathogenic fungus Drechslera tritici-repentis causes tan spot, an important disease of wheat in the southern Brazilian state of Rio Grande do Sul. TwelveD. tritici-repentis isolates were obtained from wheat seeds from different locations in the state. Their colony morphology on potato dextrose agar and polymorphisms in genomic DNA by the random amplified polymorphic DNA (RAPD) method were investigated. For the RAPD method,23 primers were tested of which nine were selected for use in the study ofD. tritici-repentis polymorphisms. The degree of similarity between isolates was calculated using a simple matching coefficient and dendrograms constructed by the unweighted pair-group method with arithmetical averages (UPGMA). The morphological and RAPD analyses showed intraspecific polymorphisms within the isolates, but it was not possible to establish a relationship between these polymorphisms and the geographical regions from where the host seeds were collected.
Key words: Drechslera tritici-repentis, RAPD, DNA polymorphism, genetic diversity. Received: July 19, 1999; accepted: January 24, 2000.
Introduction
Tan spot of wheat leaves is caused by Drechslera tritici-repentis (Died.) Shoem. (anamorphic phase, the teleomorphic phase being Pyrenophora tritici-repentis (Died.) Drechs). The nomenclature of this fungus has been discussed by several authors, with Pyrenophora trichostoma, Helminthosporium tritici-vulgaris and Helminthosporium tritici-repentishaving been considered as being the same fungus (Mehta, 1975).
Tan spot is prevalent worldwide (Hosford, 1972; Mehta, 1979; Wiese, 1991), and in Brazil it has been found in the states of Rio Grande do Sul, Paraná (Luz, 1982), Santa Catarina and Mato Grosso do Sul (Linhares and Luz, 1996). In Australia in 1982, losses due to a severe epidemic of this pathogen reached about 49% wheat-grain produc-tion (Reeset al., 1982).
It is recognized thatD. tritici-repentispresents enor-mous variability in its morphology, genome and pathoge-nicity. Since traditional morphological methods of identifi-cation can be slow and tedious, other methods for the detection and differentiation of strains ofD. tritici-repentis have been investigated by various workers. Methods based on the analysis of genomic DNA have the potential to allow the direct examination of fungal samples, eliminating the
need for culturing. Random amplified polymorphic DNA (RAPD) has been extensively used for the characterization of biological material and in this work this technique was used along with colony morphology to identify polymor-phisms and investigate the genetic similarity between dif-ferent isolates ofD. tritici-repentis.
Material and Methods
Drechslera tritici-repentisisolates
Twelve D. tritici-repentis isolates recovered from wheat seeds (supplied by CNPT-EMBRAPA, Passo Fundo-RS, Brazil) of different cultivars growing in differ-ent regions in the southern Brazilian state of Rio Grande do Sul were used (Table I). The wheat seeds were immersed in sodium hypochlorite 2% for 2 min, rinsed three times in sterile distilled water, and subsequently transferred to Petri plates containing potato dextrose agar (PDA). The samples were then incubated at 24 ± 2 °C for approximately 9 days at a 12 h photoperiod. After confirmation of the vegetative structure of the fungi, conidia were transferred to PDA slants and incubated as above described. All strains were stored as conidia and hyphae at 4 °C.
Morphological analysis
The morphologic analysis for each isolate followed the method described by Frazzon,et al.(2002, this issue).
www.sbg.org.br
Total DNA extraction
Genomic DNA was extracted from each isolate by a modification of the method of Ashktorab and Cohen (1992). The isolates were incubated in potato dextrose broth [20% potato, 2% dextrose (w/v)] for 7 days at 24 ± 2 °C with a 12 h photoperiod. The DNA extraction procedures were those de-scribed by Frazzon,et al.(2002, this issue).
Analysis of amplified DNA
The genomic DNA of theD. tritici-repentisisolates was amplified by the RAPD technique (Williamset al., 1990). The primers tested were the series A (A1-10) and B (B1-10) from BIODYNAMICS SRL (Buenos Aires, Ar-gentina) and OPB3, OPB17 and OPC13 from OPERON Technologies-CA ( Alameda, CA. US). Each 25µL of re-action mixture contained 40 ng of DNA, 2.5 mM of each dNTP (Pharmacia, Sweden), 45 ng of primer, 3 mM of MgCl2, 0.01 mg of BSA, 2.5µL reaction buffer (10x) and
1.5U Taq polymerase (CENBIOT, Porto Alegre, Brasil), the surface of the reaction mixture being overlaid with two drops of mineral oil. RAPD was performed in a Minicycler MJ Research thermocycler for 46 cycles, one cycle of 1 min at 94 °C, 5 min at 30 °C and 2 min at 72 °C;. 44 cycles of 1 min at 94 °C, 1 min at 30 °C, 2 min at 72 °C, and a final extension of 10 min at 72 °C. Amplification products were resolved on 1.4% agarose gel and visualized after staining with ethidium bromide.
Data analysis
The RAPD data and morphologic characteristics of the colonies were analyzed using the Statistical Package for the Social Sciences (SPSS) software, 2ndedition, thus cal-culating similarity coefficients and constructing the
den-drogram for genetic distances. The similarity was evaluated through simple association and the genetic distance as the Euclidean Distance. The binary matrix was built pairwise, and the presence or absence of a determined RAPD band scored 1 and 0, respectively. The hierarchical groupings were based on the Unweighted Pair Group using Arithmeti-cal Averages - UPGMA (Sneath and Sokal, 1973).
Results
Inspection of the colony morphology of the isolates showed that there was variation in the color, borders, tex-ture and sectors of the colonies (Figure 1).
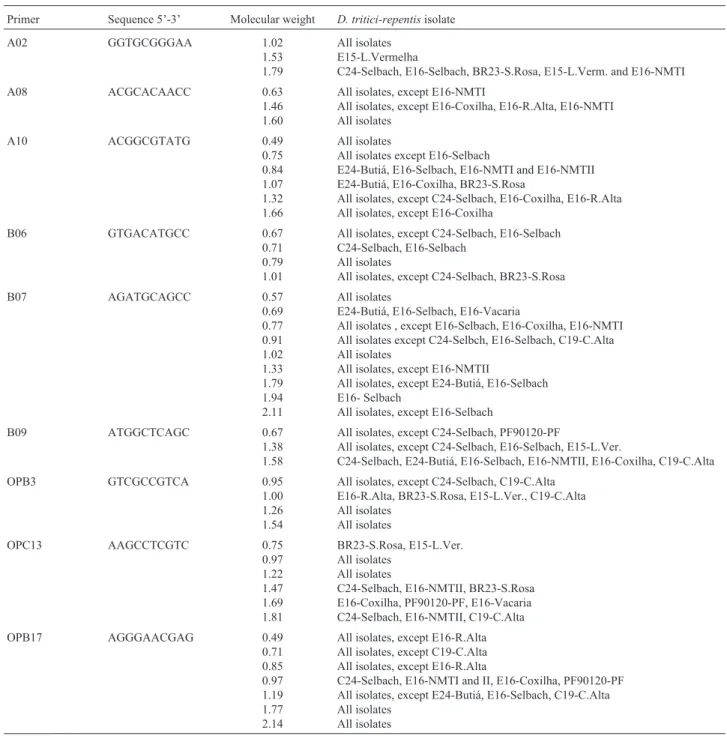
Table II shows the nine primers selected for the anal-yses on the basis of the patterns obtained, after being tested
244 Santoset al.
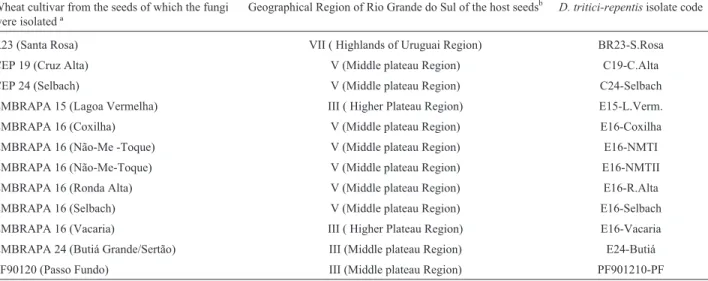
Table I- Isolates ofDrechslera tritici-repentisobtained from wheat seeds.
Wheat cultivar from the seeds of which the fungi were isolated ª
Geographical Region of Rio Grande do Sul of the host seedsb D. tritici-repentisisolate code
R23 (Santa Rosa) VII ( Highlands of Uruguai Region) BR23-S.Rosa CEP 19 (Cruz Alta) V (Middle plateau Region) C19-C.Alta CEP 24 (Selbach) V (Middle plateau Region) C24-Selbach EMBRAPA 15 (Lagoa Vermelha) III ( Higher Plateau Region) E15-L.Verm. EMBRAPA 16 (Coxilha) V (Middle plateau Region) E16-Coxilha EMBRAPA 16 (Não-Me -Toque) V (Middle plateau Region) E16-NMTI EMBRAPA 16 (Não-Me-Toque) V (Middle plateau Region) E16-NMTII EMBRAPA 16 (Ronda Alta) V (Middle plateau Region) E16-R.Alta EMBRAPA 16 (Selbach) V (Middle plateau Region) E16-Selbach EMBRAPA 16 (Vacaria) III ( Higher Plateau Region) E16-Vacaria EMBRAPA 24 (Butiá Grande/Sertão) III (Middle plateau Region) E24-Butiá PF90120 (Passo Fundo) III (Middle plateau Region) PF901210-PF
aNearest town to where the seeds were collected. b
According to Rio Grande do Sul. Secretaria da Agricultura e Abastecimento. Agricultural, Environmental and Economical Macroregions of the state of Rio Grande do Sul / Secretaria da Agricultura e Abastecimento; Centro Nacional de Pesquisa do Trigo – Porto Alegre, 1994. v. 2.
twice in different experiments with eachD. tritici-repentis isolate. For cluster analysis 45 fragments were used, of which 73% were polymorphic. Each primer generated a different amplification pattern with a variable number of fragments (Table II).
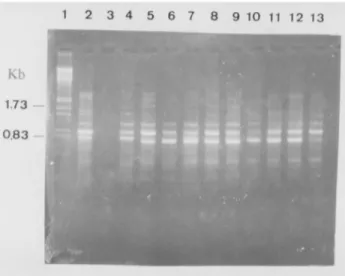
Primer B06 amplified four fragments, one of which was monomorphic (Figure 2), while primer B07 generated more fragments than the others, seven of which were poly-morphic (Figure 3). Primer OPC13 generated six frag-ments, and a 0.75 kb fragment amplified only from isolates BR23-S.Rosa and E15-L.Ver (Figure 4).
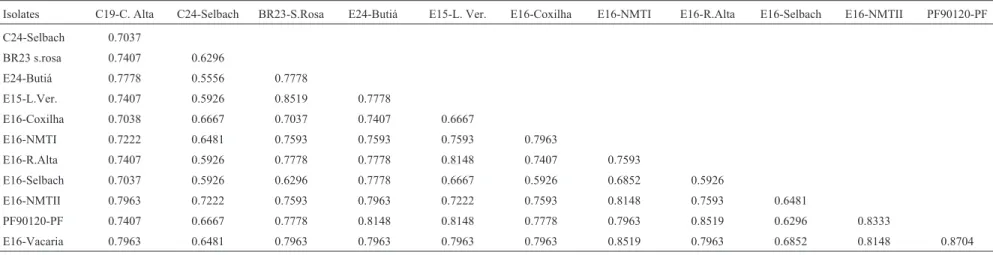
Figure 5 shows the dendrogram of morphological and RAPD data combined and contains five groups. One group is formed by isolates PF90120-PF, E16-Vacaria, E16-NMTI, E16-NMTII and E24-Butiá, with isolates PF90120-PF and E16-Vacaria showing the highest similar-ity coefficient (0.8704). Another group is made up of iso-lates BR23-S.Rosa, E15-L.Ver, E16-R.Alta and C19-C.Alta. The remaining three groups contain only one isolate each, E16-Coxilha, E16-Selbach and C24-Selbach respectively. The lowest similarity coefficient (0.5556) was observed between isolates E24-Butiá and C24–Selbach (Table III).
Table II- Sequence of the primers tested and the size in kilobases (kb) of theDrechslera tritici-repentisDNA fragments amplified.
Primer Sequence 5’-3’ Molecular weight D. tritici-repentisisolate
A02 GGTGCGGGAA 1.02
1.53 1.79
All isolates E15-L.Vermelha
C24-Selbach, E16-Selbach, BR23-S.Rosa, E15-L.Verm. and E16-NMTI
A08 ACGCACAACC 0.63
1.46 1.60
All isolates, except E16-NMTI
All isolates, except E16-Coxilha, E16-R.Alta, E16-NMTI All isolates
A10 ACGGCGTATG 0.49
0.75 0.84 1.07 1.32 1.66 All isolates
All isolates except E16-Selbach
E24-Butiá, E16-Selbach, E16-NMTI and E16-NMTII E24-Butiá, E16-Coxilha, BR23-S.Rosa
All isolates, except C24-Selbach, E16-Coxilha, E16-R.Alta All isolates, except E16-Coxilha
B06 GTGACATGCC 0.67
0.71 0.79 1.01
All isolates, except C24-Selbach, E16-Selbach C24-Selbach, E16-Selbach
All isolates
All isolates, except C24-Selbach, BR23-S.Rosa
B07 AGATGCAGCC 0.57
0.69 0.77 0.91 1.02 1.33 1.79 1.94 2.11 All isolates
E24-Butiá, E16-Selbach, E16-Vacaria
All isolates , except E16-Selbach, E16-Coxilha, E16-NMTI All isolates except C24-Selbch, E16-Selbach, C19-C.Alta All isolates
All isolates, except E16-NMTII
All isolates, except E24-Butiá, E16-Selbach E16- Selbach
All isolates, except E16-Selbach
B09 ATGGCTCAGC 0.67
1.38 1.58
All isolates, except C24-Selbach, PF90120-PF
All isolates, except C24-Selbach, E16-Selbach, E15-L.Ver.
C24-Selbach, E24-Butiá, E16-Selbach, E16-NMTII, E16-Coxilha, C19-C.Alta
OPB3 GTCGCCGTCA 0.95
1.00 1.26 1.54
All isolates, except C24-Selbach, C19-C.Alta E16-R.Alta, BR23-S.Rosa, E15-L.Ver., C19-C.Alta All isolates
All isolates OPC13 AAGCCTCGTC 0.75
0.97 1.22 1.47 1.69 1.81 BR23-S.Rosa, E15-L.Ver. All isolates All isolates
C24-Selbach, E16-NMTII, BR23-S.Rosa E16-Coxilha, PF90120-PF, E16-Vacaria C24-Selbach, E16-NMTII, C19-C.Alta OPB17 AGGGAACGAG 0.49
0.71 0.85 0.97 1.19 1.77 2.14
All isolates, except E16-R.Alta All isolates, except C19-C.Alta All isolates, except E16-R.Alta
C24-Selbach, E16-NMTI and II, E16-Coxilha, PF90120-PF All isolates, except E24-Butiá, E16-Selbach, C19-C.Alta All isolates
The dendrogram with the morphological characters (Figure 6) consists of three groups. One group contains iso-lates E16-NMTI, E16-Vacaria, C19-C.Alta, E16-NMTII and E16-Coxilha. Another group is formed by isolates E16-R.Alta, PF90120-PF, E24-Butiá, E15-L.Verm, BR23-S.Rosa and E16-Selbach, all with different degrees of similarity. Isolate C24-Selbach stands alone as a separate group and has the lowest similarity coefficient (0.2222) with isolates BR23-S.Rosa, E24-Butiá, E15-l.Ver and E16-Selbach (Table IV).
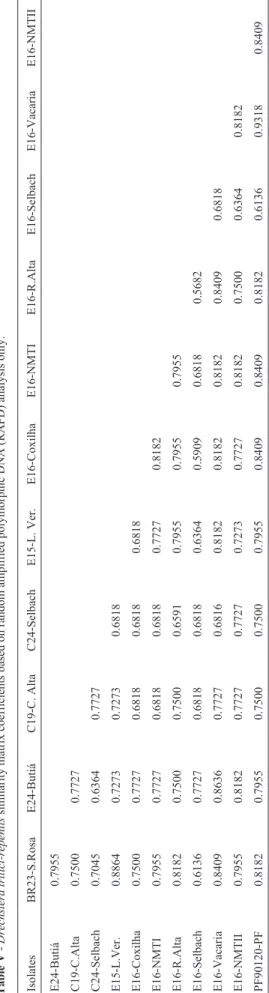
Figure 7 presents the dendrogram of the RAPD data and is made up of three groups. One group is formed by iso-lates E16-Vacaria, PF90120-PF, E24-Butiá, E16-NMTII, E16-Coxilha, E16-NMTI, BR23-S.Rosa, E15-L.Verm and E16-R.Alta, with isolates E16-Vacaria and PF90120-PF having a similarity coefficient of 0.9318 (Table V), the highest among the isolates. Another group contains isolates C19-C.Alta and C24-Selbach. Again, isolate E16-Selbach stands alone in its own group and showed the lowest ge-netic similarity with the other isolates. The lowest similar-ity coefficient (0.5682) was that between E16-Selbach and E16-R.Alta (Table V).
Discussion
Using the RAPD technique and morphological poly-morphism we detected genetic diversity amongD. tritici-repentisisolates recovered from seeds collected in different locations in the southern Brazilian state of Rio Grande do Sul.
246 Santoset al.
Figure 2- Random amplified polymorphic DNA from 12 isolates of
Drechslera tritici-repentisusing primer B06. Lanes are as follows: (1)λ; HindIII-EcoRI; (2) CEP24-Selbach; (3) E24-Butiá Gr./Sertão; (4) E16-Selbach; (5) E16-Não-Me-ToqueII; (6) E16-Coxilha; (7) C19-Cruz Alta; (8) PF90120- Passo Fundo; (9) E16-Vacaria; (10) E16-Ronda Alta; (11) BR23-Santa Rosa; (12) E15-Lagoa Vermelha; (13) E16-Não-Me-ToqueI. The numbers on the left are the lengths of the marker bands in kilobases.
Figure 3- Random amplified polymorphic DNA from 12 isolates of
Drechslera tritici-repentisusing primer B07. Lanes are as follows: (1)λ; HindIII-EcoRI; (2) CEP24-Selbach; (3) E24-Butiá Gr./Sertão; (4) E16-Selbach; (5) E16-Não-Me-ToqueII; (6) E16-Coxilha; (7) C19-Cruz Alta; (8) PF90120- Passo Fundo; (9) E16-Vacaria; (10) E16-Ronda Alta; (11) BR23-Santa Rosa; (12) E15-Lagoa Vermelha; (13) E16-Não-Me-ToqueI. The numbers on the left are the lengths of the marker bands in kilobases.
Figure 4- Random amplified polymorphic DNA from 12 isolates of
Drechslera tritici-repentisusing primer OPC13. Lanes are as follows: (1)
λHindIII-EcoRI; (2) CEP24-Selbach; (3) E24-Butiá Gr./Sertão; (4) E16-Selbach; (5) E16-Não-Me-ToqueII; (6) E16-Coxilha; (7) C19-Cruz Alta; (8) PF90120- Passo Fundo; (9) E16-Vacaria; (10) E16-Ronda Alta; (11) BR23-Santa Rosa; (12) E15-Lagoa Vermelha; (13) E16-Não-Me-ToqueI. The numbers on the left are the lengths of the marker bands in kilobases.
Figure 5 - Dendrogram of the relationships between Drechslera
tritici-repentis
diversity
247
Table III-Dreschslera tritici-repentissimilarity matrix coefficients based on both colony morphology and random amplified polymorphic DNA (RAPD) analysis.
Isolates C19-C. Alta C24-Selbach BR23-S.Rosa E24-Butiá E15-L. Ver. E16-Coxilha E16-NMTI E16-R.Alta E16-Selbach E16-NMTII PF90120-PF
C24-Selbach 0.7037
BR23 s.rosa 0.7407 0.6296
E24-Butiá 0.7778 0.5556 0.7778
E15-L.Ver. 0.7407 0.5926 0.8519 0.7778
E16-Coxilha 0.7038 0.6667 0.7037 0.7407 0.6667
E16-NMTI 0.7222 0.6481 0.7593 0.7593 0.7593 0.7963
E16-R.Alta 0.7407 0.5926 0.7778 0.7778 0.8148 0.7407 0.7593
E16-Selbach 0.7037 0.5926 0.6296 0.7778 0.6667 0.5926 0.6852 0.5926
E16-NMTII 0.7963 0.7222 0.7593 0.7963 0.7222 0.7593 0.8148 0.7593 0.6481
PF90120-PF 0.7407 0.6667 0.7778 0.8148 0.8148 0.7778 0.7963 0.8519 0.6296 0.8333
E16-Vacaria 0.7963 0.6481 0.7963 0.7963 0.7963 0.7963 0.8519 0.7963 0.6852 0.8148 0.8704
Table IV- Drechslera tritici-repentissimilarity matrix coefficients based on colony morphology only.
Isolate BR23-S.Rosa E24-Butiá C19-C.Alta C24-Selbach E15-L. Verm. E16-Coxilha E16-NMTI E16-R.Alta E16-Selbach E16-NMTII PF90120-PF
E24-Butiá 0.7778
C19-C.Alta 0.7778 0.7778
C24-Selbach 0.2222 0.2222 0.4444
E15-L.Verm. 0.7778 1.0000 0.7778 0.2222
E16-Coxilha 0.5556 0.5556 0.7778 0.6667 0.5556
E16-NMTI 0.6667 0.6667 0.8889 0.5556 0.6667 0.6667
E16-R.Alta 0.6667 0.8889 0.6667 0.3333 0.8889 0.4444 0.5556
E16-Selbach 0.7778 0.7778 0.7778 0.2222 0.7778 0.5556 0.6667 0.6667
E16-NMTII 0.6667 0.6667 0.8889 0.5556 0.6667 0.6667 0.7778 0.7778 0.6667
PF90120-PF 0.6667 0.8889 0.6667 0.3333 0.8889 0.4444 0.5556 1.0000 0.6667 0.7778
The isolates ofD. tritici-repentisused in this study were from wheat plantations located in three different re-gions in the State of Rio Grande do Sul, Brazil (Table I), but it was not possible to relate the polymorphisms found among the isolates with the region from where the host seeds were collected. In Figure 5 (based on morphology and RAPD data combined) isolates from the same region appeared in different groups and most of the isolates which shared the highest similarity coefficients were from different geographic regions. Analysis of morphological data (Figure 6) and RAPD data (Figure 7) separately also showed no obvious relationship with the location from which the seeds were collected so it appears that in this case there was no advantage in analyzing the data sepa-rately.
The wheat fields from which the seeds were collected are located in the middle or northern regions of Rio Grande do Sul where the soils are very variable in their chemical characteristics despite the fact that they were formed from the same geological material (Brauner, 1982). It would be interesting to know more about these variations in soil chemistry, and especially whether or not they happen in the same regions. Another aspect that might have influenced the variability of the isolates is the length of time during which the host-pathogen interaction has taken place. The D. tritici-repentisisolates show a great deal of polymor-phism, with the similarity coefficient in the genetic analysis ranging from 59% to 93%, suggesting that the population is not in equilibrium.
248 Santoset al.
Figure 6 - Dendrogram of the relationships between Drechslera
tritici-repentisisolates based on colony morphology only.
There are many factors affecting polymorphism anal-ysis e.g. the number of samples selected for analanal-ysis, the organism studied, genetic flow between populations, envi-ronmental adaptation and adaptation to a new host, selec-tive pressure and migration. Peever and Milgroom (1994) have stated that agricultural pathogens are subject to exten-sive extinction and re-colonization and are rarely in equi-librium. In studies withD. teresfrom different parts of the world these authors found a high degree of genetic differen-tiation between populations when compared with most other fungal populations studied, about 46% of the total ge-netic variability observed occurring in theD. teres popula-tions.
Although Guthrieet al. (1992) and Assigbetseet al. (1994) were able to detect a relationship between intras-pecific polymorphisms and geographic location, most work done in this field has shown no direct relationship and there is no general agreement among researchers as to whether such a relationship exists.
Fabre et al. (1995), in a study of Colletotrichum lindemuthianum from different countries, investigated grouping by DNA polymorphism in relation to the geo-graphical origins of the isolates and found no correlation, because the isolates formed two groups with isolates from Latin America occurring in both groups.The relationship ofTrichoderma harzianumstrains from various geograph-ical regions and presenting similar RAPD patterns is not yet understood (Zimandet al., 1994). Molleret al.(1995) de-tected intraspecific diversity not only between isolates of Chaunopycnis albafrom different geographic regions or hosts, but also between isolates from a single location. In the present work withD. tritici-repentis,the isolates recov-ered from seeds collected in the towns of Selbach and Não-Me-Toque (the same geographic origin) showed both morphological and RAPD diversity (Figures 1 and 4).
Using RAPD markers it was possible for Bayman and Cotty (1993) to separate isolates based on the relationship between their genetic and morphological variability. How-ever, this approach was not possible in the present work probably because the number of samples from each region was too small and only nine primers were used for the final analysis. The study of a larger number of primers and iso-lates (and re-isolating in different years) may show clearer results.
It will be very important to find a molecular marker for D. tritici-repentis, since Cochliobolus sativusand D. tritici-repentis produce very similar symptoms on seed-lings and wheat leaves, making it very difficult to distin-guish the disease based only on symptoms (Luz, 1982). It is normally necessary to isolate the fungus by plating for identification and confirmation, thus delaying diagnosis (Mehta, 1979). The RAPD technique is quick, effective and produces reliable markers which have been used for the
identification of various fungal pathogens. Using this technique to identify pathogens by DNA fingerprinting is proving to be very useful and should be equally beneficial for classifyingD. tritici-repentisisolates.
Acknowledgments
This work was supported by the Brazilian agencies Fundação de Apoio à Pesquisa no Estado do Rio Grande do Sul (FAPERGS) and Conselho Nacional de Desenvolvi-mento Científico e Tecnológico (CNPq).
References
Ashktorab H and Cohen RJ (1992) Facile isolation of genomic DNA from filamentous fungi. Bio Techniques 13:198-200. Assigbetse KB, Fernandez D, Dubois MP and Geiger JP (1994)
Differentiation of Fusarium oxysporumf. sp.vasinfectum
races on cotton by random amplified polymorphic DNA (RAPD) analysis. Phytopathology 84:622-626.
Bayman P and Cotty PJ (1993) Genetic diversity inAspergillus flavus: association with aflatoxin production and morphol-ogy. Canadian Journal of Botany 71:23-31.
Brauner JL (1982) Acidez do solo e seu controle. In: Osorio EA
Trigo no Brasil. Fundação Cargil, Campinas, pp 201-278. Fabre JV, Julien J, Parisot D and Dron M (1995) Analysis of
di-verse isolates ofColletotrichum lindemuthianuminfecting common bean using molecular markers. Mycology Re-search 99:429-435.
Frazzon APG, Matsumura ATS and Sand ST van der (2002) Mor-phological characterization and genetic analysis of
Drechslera teresisolates. Genetics and Molecular Biology 25(2):235-241.
Guthrie PAI, Magill RA, Frederiksen RA and Odvody GN (1992) Random amplified polymorphic DNA markers: a system for identifying and differentiating isolates of Colletotrichum graminicola. Phytopathology 82:832-835.
Hosford RM (1972) Propagues ofPyrenophora trichostoma. Phy-topathology 62:627-629.
Linhares AI and Luz WC da (1996) Ocorrência deDrechslera tritici-repentisem sementes de trigo no Mato Grosso do Sul. Fitopatologia Brasileira 21:126.
Luz WC da (1982) Mancha bronzeada. In: Osório EA Trigo no Brasil. Fundação Cargil, Campinas, pp. 531-533.
Mehta YR (1975) Mancha foliar do trigo causada por Pyre-nophora trichostoma. Summa Phytopathologica 1:283-288. Mehta YR (1979) Doenças do trigo e seu controle. Agronômica
Ceres, Summa Phytopathologica, São Paulo.
Möller C, Bühler T and Dreyfuss MM (1995) Intraspecific genetic diversity ofChaunopycnis albadetected by random ampli-fied polymorphic DNA assay. Mycology Research 99:681-688.
Nobles M (1958) Cultural characters as a guide to the taxonomy and phylogeny of polyporaceae. Canadian Journal of Botany 36:883-926.
Peever TL and Milgroon MG (1994) Genetic structure of
Rees RG, Platz GJ and Mayer RJ (1982) Yield losses in wheat from yellow spot: comparison of estimates derived from a single tillers and plots. Aust. J. Agric. Res.33:899-908. Sambrook J, Fritsch EF and Maniatis T (1989) Molecular
Clon-ing:A Laboratory Manual. 2nd ed, Cold Spring Harbor Lab-oratory Press: Cold Spring Harbor, U.S.A.
Sneath PHA and Sokal RR (1973) Numerical taxonomic. São Francisco: W.H. Freeman, 573 pp.
Zimand G, Valinsky L and Elad Y (1994) Use of the RAPD proce-dure for the identification ofTrichodermastrains. Mycology Research 98:531-534.
Wiese MV (1991) Compendium of wheat diseases. 2nd ed, The American Phytopathological Society, St. Paul.
Williams JGK, Kubelik AR, Livak KJ, Rafalski JA and Tingey SV (1990) DNA polymorphisms amplified by arbitrary pri-mers are useful as genetic markers. Nucleic Acids Res.
18:6231-635.