FOREST COVER MONITORING IN THE BARA DISTRICT
(NEPAL) WITH REMOTE SENSING AND GEOGRAPHIC
INFORMATION SYSTEMS
ii
FOREST COVER MONITORING IN THE BARA DISTRICT (NEPAL)
WITH REMOTE SENSING AND GEOGRAPHIC INFORMATION
SYSTEMS
Dissertation supervised by
Professor Mário Caetano, Ph. D
Dissertation co-supervised by
Professor Michael Gould, Ph.D
Professor Pedro Cabral, Ph.D
iii
ACKNOWLEDGEMENTS
I would like to express my sincere gratitude to Prof. Dr. Mário Caetano, my supervisor for his excellent guidance, supervision, encouragement and invaluable suggestions from the designing of research proposal till the completion of this work. I am equally grateful for Prof. Dr. Pedro Cabral and Prof. Dr. Michael Gould for their effective guidance, constructive ideas in GIS analysis. I am very grateful to Prof. Dr. Marco Painho, Director of ISEGI, for his cooperation during my stay at ISEGI, Lisboa.
It is my great pleasure to thank Ministry of Forests and Soil Conservation, Government of Nepal, for providing me the opportunity for continuing my studies. I am indebted to the European Commission (Erasmus Mundus Program) / MSc in Geospatial Technologies consortium for providing me the opportunity to pursue MSc in Geospatial Technologies with scholarship in Europe.
I am very grateful to Prof. Dr. Werner Kuhn, Prof. Dr. Edzer Pebesma and Dr. Christoph Brox for their cooperation and encouragement during my stay at ifgi, Muenster.
I would like to express my sincere thanks to Mr. A.V. Parajuli, Mr. Dibya Deo Bhatta for their encouragement and support. I would like to thank Mr. Shiva Khanal for providing secondary data for this study.
I would like to thank to the entire staff of the ISEGI, UNL for their cooperation and coordination during my study at ISEGI. Special thanks go to Filomena Caria and Maria do Carmo for their continuous cooperation and support in administrative and other concerned issues. Thanks to library staff for providing books and articles during my study duration.
iv
FOREST COVER MONITORING IN THE BARA DISTRICT (NEPAL)
WITH REMOTE SENSING AND GEOGRAPHIC INFORMATION
SYSTEMS
ABSTRACT
v
KEYWORDS
Change Detection
Geographical Information System
Land Cover Change
Object-oriented Image Classification
Remote Sensing
vi
ACRONYMS
BISEP-ST - Biodiversity Sector Programme for Siwaliks and Terai C/FUG - Community / Forest User Group
CBS - Central Bureau of Statistics CF - Community Forest
CFM - Collaborative Forest Management
CFMWG - Collaborative Forest Management Working Group DDC – District Development Committee
DFO - District Forest Office
DFRS - Department of Forest Research and Survey DOF - Department of Forests
FAO - Food and Agriculture Organization GLS - Global Land Survey
GPS - Global Positioning System
HMG - His Majesty's Government (till 2006) IDEA - Innovative Development Asia LCCS - Land Cover Classification System LRMP - Land Resources Mapping Project MFSC - Ministry of Forests and Soil Conservation MPFS/N - Master Plan for the Forestry Sector/Nepal NDVI - Normalized Difference Vegetation Index NFI - National Forest Inventory
vii
TABLE OF CONTENTS
ACKNOWLEDGEMENTS ...iii
ABSTRACT... iv
KEYWORDS ... v
ACRONYMS ... vi
INDEX OF TABLES ... ix
INDEX OF FIGURES ... x
1. INTRODUCTION ... 1
1.1 Background ... 1
1.2 Problem Statement ... 3
1.3 Research Questions ... 5
1.4 Objectives ... 5
1.5 Hypotheses ... 5
1.6 Research Approach ... 6
1.7 Organization of the Thesis ... 7
2. REMOTE SENSING AND SUSTAINABLE FOREST MANAGEMENT: CONCEPTS AND DEFINITIONS ... 8
2.1 Introduction ... 8
2.2 Remote Sensing... 8
2.3 Land use / Land cover Classification ... 10
2.4 Image Classification ... 11
2.5 Change Detection and Analysis ... 13
2.6 Spatial Metrics ... 14
2.7 Land Use Change Modelling ... 15
2.8 Remote Sensing for Sustainable Forest Management ... 16
2.9 Conclusions ... 18
3. STUDY AREA: THE BARA DISTRICT, NEPAL ... 20
3.1 Introduction ... 20
3.2 Location and Physiographic Characteristics ... 20
3.3 Climate ... 21
3.4 Population ... 22
3.5 Forest Resources ... 22
3.6 Conclusions ... 26
4. MATERIALS AND METHODS ... 27
4.1 Materials ... 27
4.1.1 Data ... 27
4.1.2 Software ... 27
4.2 Methods ... 28
4.2.1 Satellite image pre-processing ... 28
4.2.2 Description of land cover classes ... 28
4.2.3 Image classification and accuracy assessment ... 29
4.2.4 Change detection and analysis... 32
4.2.5 Spatial metrics ... 33
4.2.6 Land Use Change Modelling ... 35
viii
5. RESULTS AND DISCUSSION ... 36
5.1 Land Cover Mapping and Accuracy Assessment ... 36
5.2 Rate and Distribution of Forest Cover Change ... 39
5.2.1 Rate of change ... 39
5.2.2 Distribution of change ... 41
5.3 Spatial Pattern of Forest ... 44
5.4 Land Use Change Modelling ... 48
5.5 Discussion of Results ... 50
5.6 Conclusions ... 52
6. CONCLUSIONS AND RECOMMENDATIONS ... 53
6.1 Conclusions ... 53
6.1.1 Discussion on research questions ... 53
6.1.2 Discussion on hypotheses ... 55
6.2 Recommendations ... 55
6.3 Limitations and Future Works ... 56
BIBLIOGRAPHIC REFERENCES ... 57
APPENDICES ... 62
Appendix 1 - Bara District: An Introduction... 63
Appendix 2 - Land Use and Land Cover Classification System for use with Remote Sensor Data (Adopted from Anderson et al., 1976) ... 65
Appendix 3 - False Colour Composite Images (Bands: 4, 3, 2) of the study area... 66
Appendix 4 - Result of the Accuracy Assessment (1999, 2005) ... 67
ix
INDEX OF TABLES
Table 1: Forest and shrub under different forest inventories in Nepal ... 4
Table 2:Change in forest cover between 1978-1994 by development region ... 4
Table 3: Characteristics of Landsat Thematic Mapper (TM) Spectral Bands ... 10
Table 4: Change in extent of forest and other wooded land ... 22
Table 5: Species composition in the Bara district (Source: IDEA, 2004) ... 23
Table 6: Present status of collaborative forest management in Bara ... 26
Table 7: Database description ... 27
Table 8: Land cover class nomenclature ... 29
Table 9: Training samples collected for image classification ... 31
Table 10: Spatial metrics used in the study (adopted from Mcgarigal et al., 2002) ... 34
Table 11: Overall accuracy and Kappa ... 38
Table 12: User's accuracy (%) ... 39
Table 13:Producer's accuracy (%) ... 39
Table 14: Percentual variation of land cover change ... 40
Table 15: Percentual variation of forest cover change ... 40
Table 16: Result of cross tabulation (1989/1999) ... 42
Table 17: Result of cross tabulation (1999/2005) ... 42
Table 18: Result of cross tabulation (1989/2005) ... 43
Table 19: Result of spatial metrics (1989/1999/2005) ... 45
x
INDEX OF FIGURES
Figure 1: Research conceptual framework ... 6
Figure 2: Study area ... 21
Figure 3: Ecological map of the Bara ... 23
Figure 4: Distribution of forest resources and population in Bara ... 25
Figure 5: Image classification methodology ... 30
Figure 6: Flow diagram of change analysis, spatial heterogeneity and change projection ... 32
Figure 7: Land cover and reclassified map, 1989 ... 36
Figure 8: Land cover and reclassified map, 1999 ... 37
Figure 9: Land cover and reclassified map, 2005 ... 37
Figure 10: Forest cover change pattern ... 40
Figure 11: Land use proportion: 1989, 1999 and 2005 ... 41
Figure 12: Forest cover change map, 1989-2005 ... 44
Figure 13: Landscape structure change in Bara (1989-2005) ... 46
Figure 14: Projected forest cover for 2021 ... 48
Figure 15: Forest cover projection map for 2021 ... 49
1
1. INTRODUCTION
1.1 Background
Forest clearing represents a major driver of global warming and climate change. The world’s forests, especially in the tropics, are dramatically shrinking (Apan, 1999). Tropical forests are being destroyed despite its ecological, social and economic importance. Deforestation is recognised as one of the pervasive ecological changes taking place in tropical regions (Lambin, 1994). In the late 1970s, tropical deforestation occurred at the rate of about 11.3 million hectares per year (Lanly 1982). During the period 1980–1990, FAO figures show that this rate has increased to about 15.4 million hectares per year (Singh 1993).
The conversion of forest cover in general and of tropical forest in particular has severe long term environmental and socio-economic consequences globally as well as locally. Many environmental problems caused by forest cover change are changes in global climate, habitat degradation and unprecedented species extinction (Goldsmith, 1998).
In recent decades, increasing awareness of the depletion of tropical forests, and the associated impacts on biodiversity and global climate in particular, have led to regional to global initiatives to halt or slow their decline. However, despite these initiatives, forests continued to be cleared, disturbed or degraded (directly or indirectly) at unprecedented rates. Given this continuing situation, there is an urgent need to provide up-to-date and timely evaluations of the state of tropical forests worldwide, to assess the impacts of past and present change on their functioning and survival, and to use this knowledge to better understand and predict the consequences of their future uses (Ustin, 2004).
The sound management of tropical forests and the conduct of related research require access to information, including spatial information. As with other natural resource management activities, the practice of forestry needs reliable information so that rational decisions during planning, at various management levels can occur. The capabilities of remote sensing to map and extract information about earth resources for various applications are well documented. On the other hand, Geographic Information System (GIS) is well known for its unique strength in handling, analysis, and management of geographic and land-related data (Apan, 1999).
2
varied and depend on the data used and also on the type of landscape under analysis. These approaches include incorporation of geographic data, census data, texture features and structure or contextual information into remote sensing spectral data, use of expert systems and fuzzy classification, use of multi-sensor data, normalized difference vegetation index and the use sub-pixel information (Lu and Weng, 2001). With the advancement in remote sensing (RS) and geographic information system (GIS) techniques, characterizing a landscape and quantifying its structural change has become possible in recent years (Donnay et al. 2001; Maguire et al. 2005). With time series satellite data we can monitor long-term changes (Herold et al. 2003; Thapa et al. 2005) whereas GIS provides a framework for spatial analysis and modeling based on geographic principles and seeks to integrate the analytical capabilities to broaden the understanding of the real world system (Murayama 2001; Maguire et al. 2005).
Satellite remote sensing is one of the viable techniques to monitor the changing pattern of forest. Satellite data from several time points allows the creation of land cover maps over greater spatial extents and more frequent time steps than is possible with expensive and detailed field studies (Nagendra, 2001). Because these classifications are spatially explicit, they not only provide information on percent changes in forest cover, but also allow for evaluation of the spatial location of these changes and their association with environmental and biophysical landscape parameters that may be critical associates of this change (Nagendra et al., 2004).
The monitoring of forest cover change is a long-standing issue in remote sensing and geographic information system. Assessments of forest cover at country scale are useful for policy and management purposes, and for research. Monitoring of forest cover change in district level is useful in the preparation and implementation of forest management plan. Furthermore, updated forest maps obtained are the input for the harvest plan preparation and reforestation projects. This study, implemented in Tropical Forest located in the central Terai district (Bara) of Nepal has focused on monitoring forest cover dynamics, analysing spatial pattern of forest, and projecting future change with RS and GIS. This study has been specifically designed to explain the turnaround from deforestation to reforestation at district or operational scale.
3
causes and underlying driving forces (Geist and Lambin, 2002) are responsible to accelerate the deforestation and forest degradation. Legal and illegal conversion of forest land for agriculture and infrastructure development, unplanned and overexploitation of forest products, free access for grazing and uncontrolled forest fire are major causes in depleting that create deficit of forest products in one hand and accelerate soil erosion, downstream sedimentation and decrease in agricultural productivity on the other hand (HMGN/DFRS, 1999; FAO, 2000). Some ecologists have predicted that forests of Nepal are in the threshold of degradation (Shah, 1998).
This study analyses the spatial and temporal pattern of forest cover change in the Bara district of the Central Terai region of Nepal during 1989–2005 based on a time series satellite images of Landsat TM in 1989, 1999 and ETM+ in 2005 using object- oriented image classification, time series analysis, spatial metrics, and land use change modelling.
1.2 Problem Statement
Forest plays a significant role in the livelihood of the rural people as they are highly depended on the forest resources. The forest resources of the country should be, therefore, well managed in a scientific way to meet of ever increasing population on the sustainable basis. In the contest of hilly country Nepal, forest is one of the most important resources for the rural development. Most of rural people live in or near the forest and are dependent for fuel-wood, fodder, timber and generate income from forest to maintain their daily needs. Forest is decreasing and deteriorating creating severe environmental problems. Forest, therefore, are the most important resources, and an extremely important component of the environment and plays a vital role in the improvement of the socio-economic condition of the rural people as well as in conserving the natural resource of the country. The current study of the woody vegetation cover of the country in 1992/1996 was 39.6% of the total area (DFRS, 1999).
4
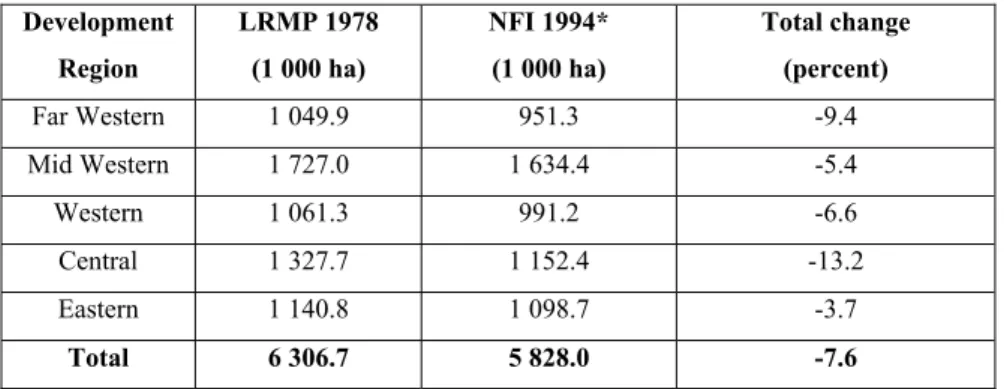
Forest resources are depleting rapidly in Nepal due to the population growth and their dependency on forest resources for their livelihood. The people depend on forests for firewood as well as for timber, medicinal plants and other forestry products. Forest area including shrub has been decreased from 42.7% to 39.6 % during 1978/79-1994 in Nepal (Table 1). The increasing population is exerting heavy pressure on the forests of Nepal. It is estimated that the annual economic loss from the deforestation is eleven billion Nepali rupees per year. This situation shows that there is still good deal of pressure on forests especially those in the Inner Terai and Terai. The depletion of forests causes serious problem including declining agricultural productivity and environmental degradation. Woody vegetation sharply decreases in the Central Development Region (Table 2). Bara district is located in central Terai where deforestation rate is high in the one hand and population is increasing rapidly on the other hand. In these circumstances, study about forest cover monitoring is essential to assess the existing forest resources and to develop the effective strategy to halt deforestation and manage the economically valuable tropical mixed hardwood forest sustainably.
Table 1: Forest and shrub under different forest inventories in Nepal (Source: NFI, 1999)
(*The NFI was implemented between 1989 and 1996 but it uses 1994 as the base year)
Table 2: Change in forest cover between 1978-1994 by development region (Source: NFI, 1999)
1
Land Resources Mapping Project, 1986
2
National Remote Sensing Centre of Nepal
3
National Forest Inventory
Vegetative Cover
1
LRMP 2NRSC Master Plan 3NFI
1978-79 1984 1985-86 1994*
Forest 38% 35.9% 37.4% 29.0%
Shrub 4.7% Partly Included in forest 4.8% 10.6%
Total 42.7% 42.2% 39.6%
Development
Region
LRMP 1978
(1 000 ha)
NFI 1994*
(1 000 ha)
Total change
(percent)
Far Western 1 049.9 951.3 -9.4
Mid Western 1 727.0 1 634.4 -5.4
Western 1 061.3 991.2 -6.6
Central 1 327.7 1 152.4 -13.2
Eastern 1 140.8 1 098.7 -3.7
5
Tropical Sal (Shorea robusta) forest is the dominant forest type found in the Bara district which is one of the most economically timber species in Nepal. But open forest areas of the district are depleting and degrading due to the rapidly increasing population and cattle pressure. Forest area of the district has been rapidly decreased from 41.58% in 1984 to 39.66% in 1990/91 (DFRS, HMG/N, 1999). This trend shows that forest area has rapidly been decreasing. No forest inventory has been carried out after 1994 in the Bara district. In these circumstances, the output of this study would provide useful information for the preparation, implementation and monitoring of the forest management plan in the study area. In addition, current information about the forest cover change would be useful in developing strategies for the protection and administration of forest area by the local authorities.
1.3 Research Questions
This research was designed to answer the following questions:
1. What are the distribution and rate of forest cover changes in the Bara district during 1989-1999 and 1989-1999-2005?
2. What is the spatial pattern of forest cover change?
3. How much forest area will be converted into other land cover types in 2021?
4. What are the driving forces affecting forest cover changes in the period from 1989-2005?
1.4 Objectives
The research aims to analyse the trend of forest cover dynamics, fragmentation and their causes in Bara district, Nepal during 1989-2005.
The specific objectives targeted for monitoring forest cover dynamics in the Bara district are:
• To identify and map key forest cover types for the year 1989, 1999 and 2005
• To assess the trends of forest change over the period 1989-2005
• To analyse the spatial pattern of forest
• To analyse the relationship between the trends of forest cover changes and their underlying factors.
• To predict/ project the change of forest area for the year 2021
1.5 Hypotheses
The following hypotheses were formulated prior to this study:
6
1.6 Research Approach
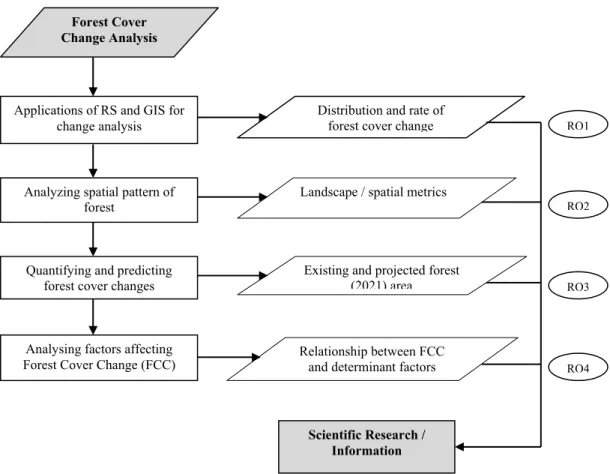
Nepal’s forest land is gaining tremendous pressure from the extraction of timber from the forest, encroachment, agricultural expansion, population growth and infrastructure development. Therefore, forest cover monitoring is very important and essential not only to assess the impact of different forest management regimes but also to set the programme and policy on bio-diversity conservation as well as environmental and ecological balance. Integrated approach (Figure 1) of remote sensing and geographic information system such as image classification, change detection techniques, spatial metrics and land use change modelling was applied for monitoring forest cover in Bara district (Nepal). Forest resource assessment is the foundation of any sound forest management and this study will provide necessary information for scientific forest management.
Figure 1: Research conceptual framework
RQ3
Scientific Research / Information
ForestCover
Change Analysis
Quantifying and predicting forest cover changes Applications of RS and GIS for
change analysis
Analyzing spatial pattern of forest
Analysing factors affecting Forest Cover Change (FCC)
Landscape / spatial metrics
Existing and projected forest (2021) area
Relationship between FCC and determinant factors
Distribution and rate of
forest cover change RQ1
RQ2
7
1.7 Organization of the Thesis
8
2. REMOTE SENSING AND SUSTAINABLE FOREST
MANAGEMENT: CONCEPTS AND DEFINITIONS
2.1 Introduction
Remote sensing has played a pivotal role in informing national governments and organization and the international community of the rapid and unprecedented decline in tropical forests over the past 50 years (Ustin, 2004). Routine observations by satellite sensors such as the Landsat Multispectral Scanner (MSS), Thematic Mapper (TM), and Enhanced Thematic Mapper (ETM+) drew attention to unprecedented changes in forest extent. Substantial advances in remote sensing technologies and data processing capabilities have allowed a more rigorous and quantitative assessment of the human impact on forest extent and condition. In this chapter concept of remote sensing with respect to sustainable forest management; satellites/sensors used in forestry; broad overview of land cover classification system, digital image interpretation and changed detection techniques are discussed briefly. Moreover, spatial metrics used to quantify and assess spatial pattern of forest, and land use change modelling are discussed. Concepts and definition about remote sensing for sustainable forest management and commonly used terminologies relevant for this study are then briefly defined.
2.2
Remote Sensing
Remote sensing is defined as the art and science of obtaining information about an object without being in direct physical contact with the object (Jensen, 2000). It is a scientific technology that can be used to measure and monitor important biophysical characteristics and human activities on earth. The world has entered the electronic information age which, now more than ever before, includes spatial information. People responsible for managing the Earth’s natural resources and planning future development recognize the importance of accurate, spatial information residing in a digital GIS. Many of the most important layers of biophysical, land use/ land cover, and socioeconomic information in a GIS database are derived from an analysis of remotely sensed data (Jensen, 2000).
Image interpretation is defined as the examination of images for the purpose of identifying objects and judging their significance (Philipson, 1997). Multi-temporal analyses of surface properties are desired in order to monitor the various changes occurring at the Earth surface. Remote sensing data collected by various instruments constitute a unique data basis ensuring a systematic local, regional, and global coverage for a range of ground spatial resolution. The examination of multi-temporal remote sensing data set is often confined to simplified change analysis schemes.
9
quantitative or semi-quantitative input data (Elmore et al., 2000). Application of remotely sensed data to illustrate changes in land cover and particularly forest cover over time have been reported by many investigators (Coppin and Baur, 1996). Trend analysis can be employed to calculate numerous parameters that may be derived from time series of satellite data. A combination of different parameters reveals additional information, which is not easily comprehensible through other processing schemes.
Vegetation is one of the most important components of ecosystems. Knowledge about variations in vegetation species and community distribution patterns, alterations in vegetation phenological (growth) cycles, and modifications in the plant physiology and morphology provide valuable insight into the climatic, edaphic, geologic, and physiographic characteristics of an area (Jones et al., 1998). Scientists have devoted a significant amount of effort to develop sensors and visual and digital image processing algorithms to extract important vegetation biophysical information from remotely sensed data (Huette and Justice, 1999).
The potential role of remote sensing as an information resource to support sustainable forest management appears enormous and immediate based largely on two facts:
• Sustainable forest management requires synoptic and repetitive biophysical and biochemical vegetation data for large geographic areas over long periods of time, and
• Remote sensing is the only way to acquire such data.
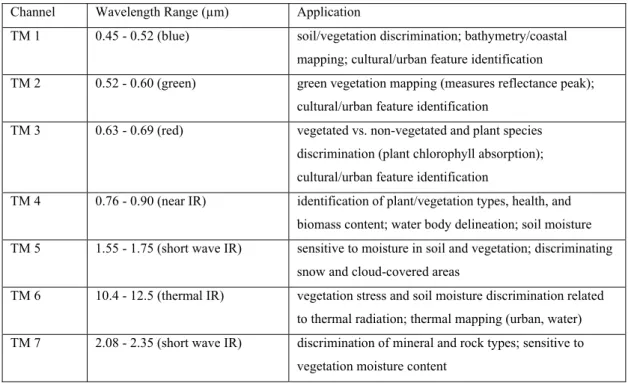
Landsat Thematic Mapper
10
Channel Wavelength Range (µm) Application
TM 1 0.45 - 0.52 (blue) soil/vegetation discrimination; bathymetry/coastal
mapping; cultural/urban feature identification
TM 2 0.52 - 0.60 (green) green vegetation mapping (measures reflectance peak);
cultural/urban feature identification
TM 3 0.63 - 0.69 (red) vegetated vs. non-vegetated and plant species
discrimination (plant chlorophyll absorption);
cultural/urban feature identification
TM 4 0.76 - 0.90 (near IR) identification of plant/vegetation types, health, and
biomass content; water body delineation; soil moisture
TM 5 1.55 - 1.75 (short wave IR) sensitive to moisture in soil and vegetation; discriminating
snow and cloud-covered areas
TM 6 10.4 - 12.5 (thermal IR) vegetation stress and soil moisture discrimination related
to thermal radiation; thermal mapping (urban, water)
TM 7 2.08 - 2.35 (short wave IR) discrimination of mineral and rock types; sensitive to
vegetation moisture content
Table 3: Characteristics of Landsat Thematic Mapper (TM) Spectral Bands
Landsat 7 was launched on April 15, 1999. Landsat 7 is a three-axis stabilized platform carrying a single nadir-pointing instrument, the ETM+. The ETM+ bands 1-5 and 7 are identical to those found on TM and have the same 30 × 30 m spatial resolution. The thermal infrared band now has 60×60 m spatial resolution (instead of 120×120 m). Most notable is the new 15×15m panchromatic band (0.52-0.90 µm).
Data from the MSS, TM and ETM+ sensors are used for a wide variety of applications, including resource management, mapping, environmental monitoring, and change detection.
2.3 Land use / Land cover Classification
According to FAO (2000): “Land cover is observed (bio) physical on the earth’s surface”. The FAO defines the land use as the arrangements, activities and inputs that people undertake on a certain land cover type. According to these definitions, land cover corresponds to the physical condition of the ground surface, e.g. forest, agricultural land, grassland, urban, while land use reflects human activities such as the use of the land like industrial zones, residential zones, and agricultural fields.
11
Land cover change can be divided into two forms as follows (FAO, 2000):
• Conversion from one land cover category to another, e.g. from forest to grassland.
• Modification within one category, e.g. from dense forest to open forest.
Land cover is a fundamental variable that impacts and links many parts of the human and physical environment. Land cover changes can be readily detected using satellite imagery based on changes in spectral reflectance or the introduction of spatial features such as vegetation, roads or field outlines. Natural and human disturbances, ecological succession, and recovery from the previous disturbances are all the forces that modify ecosystem patterns and processes within the landscape, causing changes in land cover (Franklin et. al, 2002) . Knowledge of these changes and of their driving forces can provide insight into regional landscape dynamics (Hall et al., 1991). Land cover changes can be analyzed either visually (Skole and Tucker, 1993) or through digital analysis (Yuan et al. 1998). In general, two dates of imagery are sufficient to document a set of land cover changes which have occurred between the two image acquisition dates.
A universal land use/land cover classification system does not exist. Instead, a number have been developed to reflect the needs of different user(s). Typically, the systems are hierarchically arranged with the ability to consolidate lower level classes into the next highest level and with a consistent detail for all classes at a given level in the hierarchy. In selecting a classification system for use with remotely sensed data, the classes must have a surface expression in the electromagnetic spectrum. For example, a crop such as pineapples reflects electromagnetic radiation, but an automatic teller machine (ATM) on the side of a building cannot easily be detected, especially from most down-looking sensors. The U.S. Geological Survey Land-use/Land-cover classification system (Anderson et al., 1976; USGS, 1992) was originally designed to be resource oriented (land cover). Anderson’s classification system is summarized in Appendix 1.
2.4 Image Classification
12
whether training samples are used or not, spatial unit of analysis, and whether parameters are used or not respectively.
Object oriented image classification
Per pixel procedures generally perform classification by using spectrally based decision logic that is applied to each pixel in an image individually and in isolation. In contrast, object-oriented classifiers use both spectral and spatial patterns for image classification. This is a two-step procedures involving (i) segmentation of imagery into discrete objects, followed by (ii) classification of those objects. The basic assumption is that the image being classified is made up relatively homogenous “patches” that are larger in size than individual pixels. This approach is similar to human visual interpretation of digital images, which works at multiple scales simultaneously and uses colour, shape, size, texture, pattern, and context information to group pixels into meaningful objects.
The scale of objects is one of the key variables influencing the image segmentation step in this process. For example, in case of forested landscape, at a fine scale the objects being classified might represent individual tree crowns. Segmentation at an intermediate scale would produce objects that correspond to stands of trees of similar species and sizes, while at a still coarser scale, large areas of the forest would be aggregated into a single object. Clearly, the actual scale parameter used for an object-oriented classification will depend on a number of factors, including the resolution of the sensor and the general scale of features on the landscape that the analyst is seeking to identify.
Once an image has been segmented, there are many characteristics that can be used to classify the objects. These characteristics fall into two groups. One set of characteristics is intrinsic to each object- its spectral properties, its texture, its shape etc. Other characteristics describe the relationship among objects, including their connectivity, their proximity to objects of the same or other types, and so forth.
13
2.5 Change Detection and Analysis
Analyzing an individual date of remote sensor data to extract meaningful vegetation biophysical information is often of value. However, to appreciate the dynamics of the ecosystem, it is necessary to monitor the vegetation through time and determine what changes in succession are taking place. Relatively medium to high temporal resolution satellite data is often useful for such type of study.
Researchers involved in change detection studies using satellite images data have conceived a large range of methodologies for identifying environmental changes. Change detection procedures can be grouped under three broad headings characterized by data transformation procedures and analysis techniques used to delimit areas of significant changes: (1) image enhancement, (2) multi-date data classification and (3) comparison of two independent lands cover classifications (Mas, 1998). The enhancement approach involves the mathematical combination of imagery from different dates such as subtraction of bands, rationing, image regression or principal component analysis (PCA). Thresholds are applied to the enhanced image to isolate pixels that have changed. The direct multi-date classification is based on the single analysis of a combined data set of two or more different multi-dates, in order to identify areas of changes. The post-classification comparison is a comparative analysis of images obtained at different moments after previous independent classification.
Change detection techniques using remote sensing techniques involve the use of multi-temporal satellite data sets to discriminate areas of land cover change between dates of imaging (Lillesand a Kiefer, 2008). It can provide up-to-date spatio-temporal information about forest resources status that supports in making decision on appropriate intervention (policy formulation, planning and management). Change detection can be applied for various purposes like land cover change analysis, monitoring of shifting cultivation, assessment of deforestation and forest degradation, study of change in vegetation phenology, seasonal changes in pasture production, damage assessment, crop stress detection, disaster monitoring, environmental changes etc.(Roy, 2003). The basic principle of change detection using remote sensing is that changes in the land cover result in changes in radiance values (Mass, 1999). Analysing spectral differences in signatures of an object (land cover change can be detected. Thus change detection in remote sensing play a key role in improving spatial and temporal change information resulted by natural and anthropogenic activities in terms of time and cost effectiveness
14
placed in a GIS database. His change detection method was based on maximum likelihood classification (MLC) and utilized input training data extracted from the GIS database.
Much current work focuses on the application of object-based analysis to temporal studies (Walter 2004, Zhou et al. 2008). For instance, Im et al. (2008) compare various pixel- and object-based change detection techniques, concluding that advanced object-based approaches are superior. Object-based change detection has been applied to various environmental concerns, including urban growth (Zhou et al. 2008) and shrub land encroachment (Stow et al. 2008).
2.6 Spatial Metrics
Different representations of space have led to a variety of spatial metrics for the description of spatial structure and pattern For each application, they have to be selected , interpreted, analysed, and evaluated according to the context of the study, given the thematic classification and inherent processes of change(Gustafson, 1998). The basis of the spatial metric calculation is a thematic map representing a landscape comprised of spatial patches categorized in different patch classes.
In general, spatial metrics can be defined as quantitative and aggregate measurements derived from digital analysis of thematic-categorical maps showing spatial heterogeneity at a specific scale and resolution. This definition emphasizes the quantitative and aggregated nature of the metrics, since they provide global summary descriptors of the individual measured or mapped features of the landscape (patches, patch classes, or whole map). Furthermore, it has to be considered that the metrics always represents the spatial heterogeneity at a specific spatial scale, determined by the spatial resolution, the extent of the spatial domain, the thematic definition of the map categories, and at a given point in time. Many of the quantitative measures are implemented in the public domain statistical package FRAGSTATS (Mc Garial et al., 2002).
15
Very recently there has been interest in applying spatial metrics to the analysis of the forest fragmentation. Soutworth et al. (2004) summarized the utility of spatial metric for land cover change and landscape fragmentation. Previous work has emphasized the use of spatial metrics to describe structure and pattern in land cover change and landscape fragmentation. Soutworth et al. (2004) evaluated fragmentation of landscape using landscape metrics. At the class level, descriptive metrics of land cover pattern between forest and non-forest classes were compared across four dates (1987, 1991, 1996, and 2001). These metrics can be grouped into categories of area, shape, core, diversity and contagion / interspersion. Thapa and Murayama (2007) proposed spatial metrics for spatial structure of land use dynamics in Kathmandu valley. Four land use maps were prepared from the images for the year 1967, 1978, 1991, and 2000. A set of landscape metrics was used to evaluate temporal dynamics of land uses from the maps at class and landscape levels. GIS and landscape metrics provided the spatial structure of land use dynamics quantitatively in Kathmandu valley.
Fragmentation of a landscape occurs when land cover patches are dissected by disturbance (Forman, 1995). Fragmentation leads to smaller patches, more distant patches, and increases in edge area ratios and has been associated with the spatial density of roads, pipelines, and other dissection factors that divide patches and serve corridor.
Forest fragmentation can be defined as “division of large, comparatively homogenous tracts of forest into a heterogeneous mixture of much smaller patches” (Reed et al., 1996: p.267). No single landscape metric captures all aspects of fragmentation (Davidson, 1998; Jager, 2000); instead, a suit of selected metrics may be useful in interpretation of landscape change, and must be carefully considered relative to the type of change (the patches) and the background matrix (the forest mosaic).
2.7 Land Use Change Modelling
Scenarios of future land cover are important for a number of conservation and restoration goals, including targeting areas for restoration, assessing the impacts of possible restoration and mitigation scenarios, and determining the vulnerabilities of various resource lands to future land conversion. Landuse and land cover models can be used for different purposes. These models can be categorised according to amount of information they contain. These are whole landscape models, distributional landscape models or spatial landscape models (Baker, 1989). Landuse and land cover change is influenced by various natural and human activity processes. Spatial details plays important role in these process (White et al., 1997). Therefore spatial modelling has more relevance than other methods of modelling in research.
16
use planning and policy. Models are useful for disentangling the complex suite of socio-economic and biophysical forces that influence the rate and spatial pattern of land use change and for estimating the impacts of changes in land use. Furthermore, models can support the exploration of future land use changes under different scenario conditions. Summarising, land use models are useful and reproducible tools, supplementing our existing mental capabilities to analyse land use change and to make more informed decisions.
Description and modelling of land systems highly depends on the data availability and quality. With recent advances in land use modelling research, the discrepancy of data types between human and biophysical disciplines are obvious (Veldkamp et al., 2001).
Land use land cover change models can be used for different purposes. These models can be categorised according to amount of information they contain. These are Whole landscape models, Distributional landscape models, or spatial landscape models (Baker, 1989). Land use and land cover change is influenced by various natural and human activity processes. Spatial details plays important role in these process (White et al., 1997). Therefore spatial modelling has more relevance than other methods of modelling in research. Difference or differential equation based models are dynamics and generate relatively complex results, both temporally and spatially. However solutions that are better than a very crude spatial resolution are hard to achieve computationally (Chen et al., 2002).
Different approaches have been attempted in spatial modelling, to name a few models, based on approaches: Markov Chain Analysis, Cellular Automata models, and GEOMOD.
2.8
Remote Sensing for Sustainable Forest Management
Forestry is concerned with the management of forests for wood, forage, water, wildlife and recreation. Because the principle raw product from forest is wood, forestry is especially concerned with timber management, maintenance and improvement of existing forest stands, and fire control. Forests of one type or another cover nearly a third of the world’s land area. They are distributed unevenly and their resource value varies widely (Lillesand et al., 2008).
Sustainable forest management is the process of managing permanent forest land to achieve one or more clearly specified objectives of management with regard to production of a continuous flow of desired forest products and services without undue reduction of its inherent values and future productivity and without undue undesirable effects on the physical and social environment (FAO, 2000).
17
a variety of scales based on common understanding of biophysical and ecological principles (Berry and Ripple, 1996). Remote sensing, together with GIS and computer simulation models, appear poised to make significant contributions to the way in which the remaining forests of the world are managed. Recently Remote Sensing and GIS are considered as real tools for use by those concerned with the whole process of forest planning, operations and management.
Satellite remote sensing plays an important role in the monitoring of deforestation due to its capability to observe forest change in a repetitive and consistent manner over large areas (Alves et al., 1999; DeFries et al., 2002). Remote sensing technology in combination with GIS can render reliable information on vegetation cover. The use of remote sensing data in recent times has been of immense help in monitoring the changing pattern of vegetation..
The remote sensing of vegetation trends in the absence of land cover change is more challenging than standard land cover change analyses. Vegetation growth typically exhibits some type of annual cycle, with a period with low (or no) growth and a period of active growth and decline. Vegetation vigour and growth cannot be analysed using a single year image. An analysis of vegetation trends would be substantially improved if a sufficient number of images were included in the analysis to track the vegetation growth pattern. Some frequently used forestry terminologies relevant for this study are defined below.
Forest fragmentation
Forest fragmentation occurs when large, continuous forests are divided into smaller blocks by roads, agriculture, urbanization, or other development. This process reduces the forest’s function as a habitat for many plant and animal species. In addition, it reduces the forest’s effectiveness in performing other functions, such as water and air purification. Fragmentation not only reduces the area that is left as forest but also affects other biophysical aspects of forest such as forest structure, temperature, moisture and light regimes. It disturbs the habitat to which all forest animals and plants have adopted over millennia.
Afforestation
18 Reforestation
Reforestation is the restocking of existing forests and woodlands which have been depleted, with native tree stock. The term reforestation can also refer to afforestation, the process of restoring and recreating areas of woodlands or forest that once existed but were deforested or otherwise removed or destroyed at some point in the past. The resulting forest can provide both ecosystem and resource benefits such as: pollution control, dust control and has the potential to become a major carbon sink.
Deforestation
Deforestation is the conversion of forested areas to non-forested land, for uses such as: agriculture, Deforestation implies the long-term or permanent loss of forest cover and implies transformation into another landuse. Such a loss can only be caused and maintained by a continued human-induced or natural perturbation. Deforestation results from removal of trees without sufficient reforestation, and results in declines in habitat and biodiversity, wood for fuel and industrial use, and quality of life. The term specifically excludes areas where trees have been removed as a result of harvesting or logging.
Forest degradation
It implies the changes within the forest, which negatively affects the structure or function of the stand or site, and thereby lowers the capacity to supply products and/or services (FAO, 2000).
Forest improvement
It implies the changes within the forest, which positively affects the structure or function of the stand or site, and thereby increases the capacity to supply products and/or services (FAO, 2000).
2.9 Conclusions
Remote sensing is a scientific technology that can be used to measure and monitoring important biophysical characteristics on earth. Multi-temporal analyses of surface properties are desired in order to monitor the various changes occurring at the earth surface. Remote sensing together with GIS and computer simulation models contribute significantly with the whole process of forest planning, operations and management. The information on the forest status such as quality, quantity, type, spatial distribution etc. can be assessed using remote sensing data.
19
needed in the analysis of environmental processes and problems. USGS Land Cover Classification System (LCCS) and FAO, LCCS are most commonly used land use system in remote sensing.
The most obvious method of change detections is a comparative analysis of spectral classifications for time t1 and t2 or series of time independently. Forest cover pattern characterisation involved its detection and quantification. Spatial metrics provide a means for quantifying spatial heterogeneity of individual patches, all patches in class, and over the whole landscape as a collection of patches. Important applications of spatial metrics include the detection landscape pattern, biodiversity, and habitat fragmentation.
20
3. STUDY AREA: THE BARA DISTRICT, NEPAL
3.1 Introduction
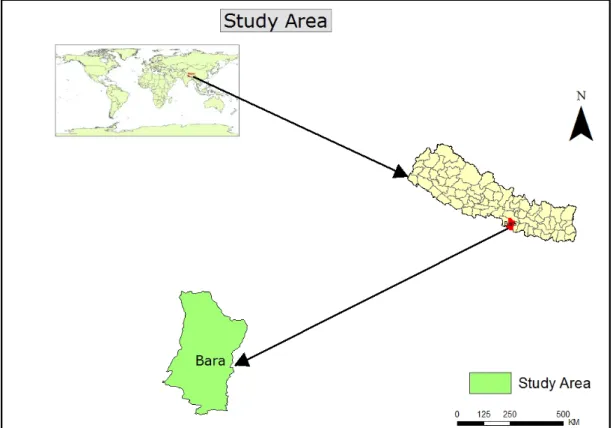
Nepal is situated on the southern slopes of the central Himalayas and represents about one third of its whole length (Figure 2). The country lies between China to the north and India to the east, south and west. It is located between the latitudes 26o 22’ and 30o 27’ N and the longitudes 80o 40’ and 88o 12’ E. It is roughly rectangular in shape and occupies a total area of 147181 square Km. From east to west the average length is 885 Km and north- south width varies from 145 to 241 Km with a mean of 193 Km. About 83% of its total land area is occupied by high mountains and wavy hills, and the remaining 17 percent by flat lands of the terrain. The altitude varies from some 60 m above the sea level in the Terai to 8848 m in the Mt. Everest, the highest peak of the world (CBS, 2001).
Nepal is divided into five major physiographic regions which run in more or less parallel bands from northwest to southeast. Each of these regions has a distinctive agricultural and forestry land utilization pattern. These regions are known as Terai, Siwaliks, Middle Mountains, High Mountains and High Himal from south to north direction. Nepal was once extensively covered by forests. Demand for fodder, overgrazing and uncontrolled cutting of timber and fuel wood, have significantly reduced the original forest cover. The composition of vegetation is closely related to the climate, which in turn is related to the physiographic region. There is not only a difference in vegetation from north to south, but also from east to west. The latter is caused by the decrease of monsoon rains in the western part and to some extent by the latitudinal differences between the eastern and western regions of Nepal.
Bara district is located in the central Terai of Nepal with few are on Siwaliks. Terai represents only 14% of the total area of Nepal but it contains about 42% of the total cultivated land of the country. The forests consist mainly of high value Sal and a mix of tropical and subtropical species. The Siwaliks - its hillslopes have little potential for agricultural production. Soils are shallow and erodable. The forests consist mainly of chir pine (Pinus roxburghii) and tropical mixed hardwoods of which Sal is often a major component.
3.2 Location and Physiographic Characteristics
21
Figure 2: Study area
Government published estimates of the total area of the district are not consistent. This study utilizes a shape file obtained from the Department of Survey (DOS) of Nepal to delineate the area of the district that shows its area as 127,292 ha. Out of the total area, 6.3% is undulated gravelly hills called the Siwalik which are located in the north, while the other 93.7% lies in the south Terai plain (MDM 1971), which constitutes 5% of Nepal’s plain land area. Most of the district’s forests are located in the north, with more extensive farmland in the southern plain.
With the decline of government forests and increasing environmental awareness among people and due to the government incentives to individual farmers for farm plantations, many individual farmers in the southern part of the district have planted trees in their farmlands.
3.3 Climate
22
3.4 Population
Bara district has been experiencing rapid land use and land cover dynamics after the development of roads in 1960s. Two highways, east-west and south and the district level roads passing north-south from forests have been blessing on landuse dynamics. The population increased from 0.25 million in 1971 (MDM, 1971), 0.412 million in 1990(CBS, 1995), to 0.55 million in 2000(CBS, 2001), with 5 ha per family. The new migrant population living in the north, mostly along the forest fringes located near highways and commercial centres, strongly influences local and regional forest use practices of the district. According to CBS, 2001; total population of the district is 559,137 with total households 87,706. Out of the total population, 289,397 are male and 269, 738 female respectively.
3.5 Forest Resources
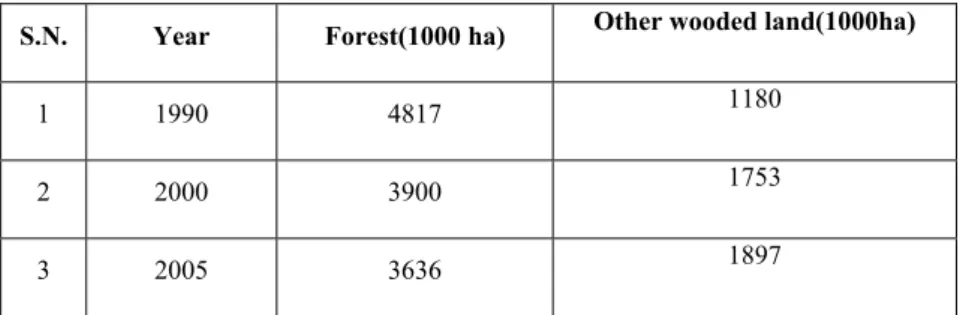
According to FRA-2005, forest area of Nepal has been changed significantly during 1990-2005(Table 4). Forest area has been shrunk with an annual rate of 2.1% and 1.4% during 1990-2000, and 2000-2005 respectively. On the contrary, other wooded land has been increased during 1990-2000-2005.
S.N. Year Forest(1000 ha) Other wooded land(1000ha)
1 1990 4817 1180
2 2000 3900 1753
3 2005 3636 1897
Table 4: Change in extent of forest and other wooded
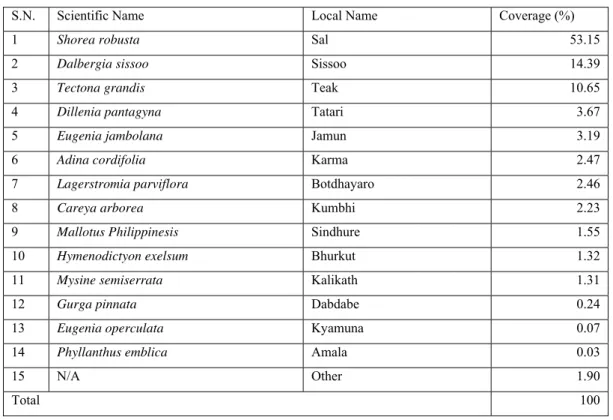
Forest types:
23
S.N. Scientific Name Local Name Coverage (%)
1 Shorea robusta Sal 53.15
2 Dalbergia sissoo Sissoo 14.39
3 Tectona grandis Teak 10.65
4 Dillenia pantagyna Tatari 3.67
5 Eugenia jambolana Jamun 3.19
6 Adina cordifolia Karma 2.47
7 Lagerstromia parviflora Botdhayaro 2.46
8 Careya arborea Kumbhi 2.23
9 Mallotus Philippinesis Sindhure 1.55
10 Hymenodictyon exelsum Bhurkut 1.32
11 Mysine semiserrata Kalikath 1.31
12 Gurga pinnata Dabdabe 0.24
13 Eugenia operculata Kyamuna 0.07
14 Phyllanthus emblica Amala 0.03
15 N/A Other 1.90
Total 100
Table 5: Species composition in the Bara district (Source: IDEA, 2004)
24 Forest management regime:
Forests and shrub cover about 29% and 10.6% of total land area of country respectively (DFRS, 1999). Forests in Nepal is depleting at an annual rate of 1.7% from 1978 to 1994 (DFRS, 1999).
The Bara district has national, community and privately owned forests, and collaborative forests, each with different forest management practices. National forest includes government managed, protected, leasehold, and religious, community and collaborative forests. In community and collaborative forests, land ownership titles stay in government, users have the usufruct right only.
Community Forest
Community Forest (CF) means a national forest handed over to a users' group for its development, conservation and utilization for the collective interest (Forest Act 1993). CF is one of the most popular and successful program in Nepal. In CF, users are the people living near to and traditionally using forest and also called local user. Due to difficulties in the identification of local user in the densely populated and heterogeneous society and existence of larger blocks of valuable natural forest, CF is not fully implemented in the Terai region of Nepal. Only small and isolated patches of natural forest and plantation forest are handed over to local user as community forest. About 1.2 million hectares of forested land (more than 25 percent of the total) has so far been handed over to over 14,000 CFUGs which constitute about 35 percent of the total population of Nepal. So far, only 1818 ha forest is handed over as community forest to 13 Community Forest User Group in the Bara district (DOF, CFUG Database, Sept-10, 2007).Lack of the effectiveness of CF in Terai such as Bara, government launched the alternative forest management program viz. Collaborative Forest Management which is discussed below.
Collaborative Forest Management
Collaborative Forest Management (CFM) is an approach of sustainable forest management in Collaboration with the local people to achieve multiple benefits maintaining ecological balance, generating economic returns and improving livelihood from the government managed forests (CMWG, 2003).
25
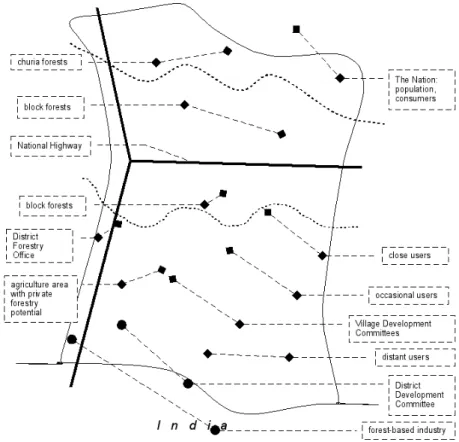
Figure 4 shows a schematic sketch of Bara, a typical Terai district with the Churia range in the north, Terai block forests just south of that, and densely populated areas towards the Indian border. In the figure below, we can see agricultural land, forest users, and stakeholders (forest industries, line agencies etc.) are confined to the southern part of the district while forest is confined around east-west highway in the north. In the figure we can see three categories of user viz. close users, occasional users and distant users. Although, Terai districts vary geographically, with regard to forests’ access rights, all Terai districts have the same pattern of large block forests and a complicated socio-economic lay-out. Community forest which is one of the successful people cantered forestry program in Nepal only recognize individual houses (close users) that are associated with particular patches of forest and ignore both occasional and distant users. Therefore, government of Nepal introduced new model of forest management, CFM, a working partnership between the key stakeholders in a management of the given forest: key stakeholders being local forest users, line agencies, local government, civil society, non-governmental organization and private sector. This approach includes close versus distant users and all stakeholders that fit the forest and population distribution pattern in the Terai.
Figure 4: Distribution of forest resources and population in Bara (Adopted from Schoubroeck and Karna, 2003)
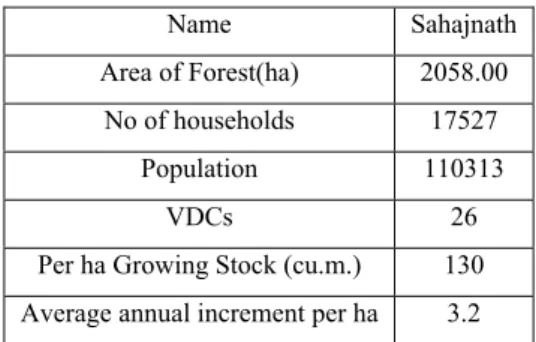
26
Name Sahajnath
Area of Forest(ha) 2058.00
No of households 17527
Population 110313
VDCs 26
Per ha Growing Stock (cu.m.) 130
Average annual increment per ha 3.2
Table 6: Present status of Collaborative Forest Management in Bara (Source: BISEP-ST/RSU, 2005)
3.6 Conclusions
27
4. MATERIALS AND METHODS
4.1 Materials
4.1.1 Data
Landsat TM and ETM+ satellite imageries were selected for forest cover change analysis of the Study
area during a period 16 year (1989-2005). The reasons for selecting the Landsat images are due to the
free access, appropriate spatial and spectral resolution, and relevancy to the objectives of the study.
The main data used in the study included three Landsat satellite images acquired (Table7) for the
years 1989 (TM), and 1999 (ETM+) and 2005(ETM+). 1989 and 1999 images were downloaded from
the Global Land-Cover Facility site hosted by the University of Maryland and 2005(Landsat decadal,
GLS-2005) image was downloaded using the USGS Global Visualization Viewer.
Satellite Date Resolution Landsat TM 1989-10-31 30 m ,7channels Landsat ETM+ 1999-11-04 30 m, 8 channels Landsat ETM + 2005-11-04 30 m, 8 channels
Table 7: Database Description
Three Landsat images for the year 1989, 1999 and 2005 were used in this study allowed us to provide an explicitly temporal perspective, and to examine the forests in Bara.
4.1.2 Software
The following softwares were used for this study for different purposes:
• eCognition (version 3.0) : for object-oriented image classification,
• Idrisi Kilimanjaro: for time series change analysis and predictive change modelling, and image differencing.
• ArcGIS 9.3: for vector data analysis and management.
28
4.2 Methods
An integrated approach of remote sensing and GIS was applied in this study to generate land cover map and analyze the forest cover changes of the Bara district. Three remote sensing images (1989, 1999 and 2005) from Landsat satellites were processed for evaluating the forest cover dynamics. Image classification was carried out using object-oriented classification approach applying a standard nearest neighbourhood algorithm. Forest cover change was analysed by the post classification analysis, time series analysis and spatial pattern of forest was quantified by calculating spatial metrics.
4.2.1 Satellite image pre-processing
Three nearly cloud-free Landsat TM images were selected to analyze changes in forest cover between 1989, 1999 and 2005. Two images (1999 and 2005) were taken in the same day (November-4), and 1989 was also taken within a week that reduces the error due to variation in phenological characteristics of vegetation. A false colour composite image of the study area is illustrated in Appendix-5.
All the images downloaded were already projected into Universal Zone 45 N using WGS, 1984 datum. Since most of maps of Nepal are projected in the modified UTM (Zone 44.5 N), the projected images are re-projected into modified UTM (Zone 44.5 N, Spheroid: Everest-1830). The 1999 image was georeferenced using 1:25 000 scale topographic maps obtained from the Topographic Survey Branch of Nepal; the 1989 and 2005 images were georeferenced using the image-to-image registration against the 1999 image with an RMS error of 0.25 pixels. This enabled us to overlay information from different images within a GIS to evaluate forest change. We realized the radiometric correction is not required for this study since all the images were taken in the same season within a difference of one week. Autumn (October-November) is the appropriate season for acquiring cloud and dust free satellite images for Nepal. Generally atmosphere appears clean in autumn in the study area.
4.2.2 Description of land cover classes
The land cover classes applied in this study are defined considering USGS LCCS (Appendix-1), and land use land cover classification systems used in Nepal.
29
Table 8: Land cover class nomenclature
4.2.3 Image classification and accuracy assessment
In order to quantify recent changes in vegetation cover in the study area, it is necessary to map the vegetation cover at present and at some time in the past. Change in vegetation cover was quantified during 1989- 2005. It is apparent that successful detection of forest cover changes requires effective classification methods. In various empirical studies, different classification methods are discussed e.g. supervised/unsupervised, pixel or object-based classification, etc. It is rather difficult to clearly extract objects of interest with pixel based classification. The advent of object-oriented method provides a tool for effective land use/land cover mapping (Blaschke, 2005). This method considers group of pixels and geometric properties of image objects. Therefore, to avoid the mixed pixel problem associated with pixel based methods and easily detect the change, an object-oriented method was applied in this study.
Object-Oriented classification
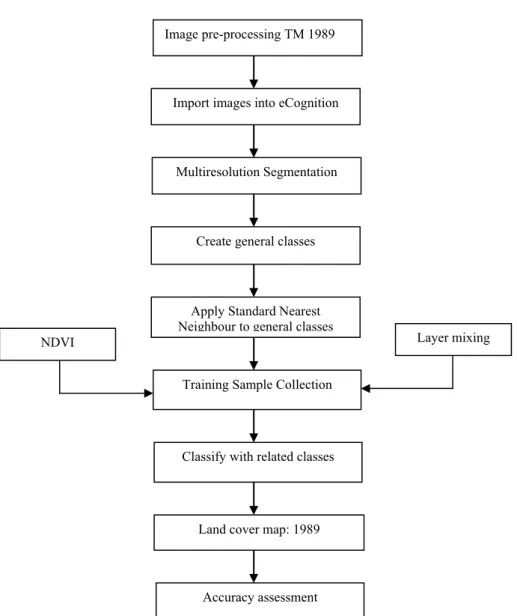
Object-oriented processing techniques segments the imageries into homogenous regions based on neighbouring pixels’ spectral and spatial properties. Image analysis techniques that consider both the measure of reflectance values and neighbourhood relations (object-oriented analysis) are available in eCognition. One technical solution to overcome the pixel view is image segmentation. The aim of segmentation is to generate the most meaningful objects possible. For this purpose, an object-oriented analysis tool, eCognition, was employed. Image classification methodology is similar for all three images, so classification methodology is illustrated for 1989 image in the figure 5 below.
Landover classes Descriptions
Upper Mixed
Hardwood
It includes upper mixed hardwood forest with >10% canopy cover, also include
small pockets of plantation and burned areas
Mixed Forest
Includes lower tropical Sal and mixed broadleaved forest with >10% canopy
cover, also include small pockets of plantation and burned areas
Shrub Same as forest with < 10 % canopy covers but well defined stems cannot be found
Scatter Trees It comprises trees scattered in agricultural and marginal land
Agriculture Crop, irrigated land, bare soil, residential areas are included in this category
Bare Land Includes sands, silt mainly along stream and river
30
Figure 5: Image classification methodology Image segmentation and classification
The first step in the object-oriented image classification is the segmentation of the image into discrete objects. A multi-resolution segmentation tool which is based on “region growing” approach (i.e. from small objects to super objects) was applied to create the image objects. There are many criteria that can be used to select how the objects in the image will be determined. For this project, colour was chosen as the main attribute that was used to segment the image. The other option that is important to keep in mind is the scale parameter, which determines how big we wish to grow our objects. Different scale parameter was attempted and a scale parameter of 10 was selected based on visual interpretation of the image segmentation results and nature of land cover classes used for this study for all three images. For the analysis and classification of image objects, in eCognition, the land cover class has to be defined in a class hierarchy. The seven classes shown in Table 8 were created in a class hierarchy.
Training Sample Collection Image pre-processing TM 1989
Import images into eCognition
Multiresolution Segmentation
Apply Standard Nearest Neighbour to general classes
Create general classes
Classify with related classes
Land cover map: 1989
Layer mixing
31
There are two types of classifiers (nearest neighbour or membership functions) available in eCognition. Same scale parameter (i.e. 10) was applied for all three date images. After satisfied with the segmentation, standard nearest neighbours was inserted for all classes and then 440 training sample objects(Table 9) were collected using the topographic maps (Appendix –5) and other reference data (e.g. Google map). Normalized Differential Vegetation Index (NDVI) was calculated to improve the result and assist the classification. The training samples are typically representative of the seven classes created in class hierarchy. After constructing the resource based sample collection, a standard nearest neighbour algorithm was applied to classify the image. Based on these procedures, land cover maps of the study area were produced several times in order to improve the classification accuracy.
S. N. Class Number of Samples
1 UMH 35
2 Mixed Forest 140
3 Shrub 15
4 Scatter Trees 15
5 Agriculture 180
6 Bare land 30
7 Waterbodies 25
Total 440
Table 9: Training samples collected for image classification
Accuracy assessment
It is necessary to assess accuracy to quantitatively assessing classification accuracy if remote-sensing derived land-use or land cover maps and associated statistics are to be useful (Meyer and Werth, 1990). The accuracy assessment in remotely sensed image classification is necessary for evaluating the obtained results (Congalton 1991).This will allow a degree of confidence to be attached to those results and will serve to indicate whether the analysis of objectives has been achieved. Randomly selected reference points lessen or eliminate the possibility of biasness. Reference points represent geographic points on the classified image for which actual data are known. The reference data are often derived from field survey, high resolution satellite imageries or aerial photographs. A set of reference points is usually used in accuracy assessment.
32 4.2.4 Change detection and analysis
Post classification comparison and time series analysis (Cross tab) were applied for the change analysis. Methodology applied for change detection is illustrated in Figure 6 below.
Figure 6: Flow diagram of change analysis, spatial heterogeneity and change projection
Land cover map-1989
Spatial Metrics
Cross tabulation: 1989/1999 Cross tabulation: 1999/2005
Cross tabulation, image differencing, Markov Chain
Analysis: 1989/2005
Results and Discussions
Land cover map-1999 Land cover map-2005
33 Post classification analysis
In the last few decades various detection and analysis techniques have developed and been applied in remote sensing studies to determine the spatial extent of land cover changes. Although there are a wide variety of techniques, most of land cover change detection analysis is performed using the simple techniques of post classification comparison (Blaschke, 2005). Following classification of imagery from the individual years, a post-classification, approach of subtracting the classified maps, 1989-1999, 1999-2005 and 1989-2005, was applied. This approach provides ‘from-to’ change information.
Time Series/Change Analysis
With qualitative data, CROSSTAB is the tool used for change analysis between image pairs and there are several types of output that can be useful. The crosstabulation output shows the frequencies with which classes have remained the same (frequencies along the diagonal) or have changed (off-diagonal frequencies). The Kappa Index of Agreement (KIA) indicates the degree of agreement between the two maps, both in an overall sense and on a per-category basis. Finally, the cross classification image can readily be reclassified into either a change image or an agreement image.
4.2.5 Spatial metrics
34
Metric
Description/calculation scheme Units Range
CA- Class area CA equals the sum of the areas (m2) of all urban patches, divided by 10,000(to convert to hectares);
that is, total forest area in the landscape.
Ha CA>0, no limit
NP- Number of patches NP equals the number of forest patches in the
landscape.
None NP≥, no limit
ED-Edge density ED equals the sum of the lengths(m) of the edge
segments involving the forest patch type, divided
by the total landscape area (m2), multiplied by
10,000(to convert hectares)
Meters
per
hectare
ED≥, no limit
LPI- Largest patch index LPI equals the area (m2) of the largest patch of the corresponding patch type divided by total area
covered by forest (m2), multiplied by 100(to
convert to a percentage).
Percent 0<LPI≤100
MNN- Euclidian mean
nearest neighbour distance
MNN equals the distance(m)mean value over all
forest patches to the nearest neighbouring urban
patch, based on the shortest edge-to-edge distance
from cell centre to cell centre
Meters MNN>0, no limit
AWMPFD- Area
weighted mean value of
fractal dimension
Area weighted mean value of the fractal
dimension values of all forest patches, the fractal
dimension of a patch equals two times the
logarithm of patch perimeter(m) divided by the
logarithm of patch area(m2); the perimeter is adjusted to correct for the raster bias in perimeter.
None 1≤AWMPFD≤2
CONTAG-Contagion CONTAG measures the overall probability that a
cell of a patch type is adjacent to cells of same
type.
Percent 0<CONTAG≤100