Genetic structure of the snakehead murrel,
Channa striata
(channidae) based
on the cytochrome c oxidase subunit I gene: Influence of historical and
geomorphological factors
Jamsari Amirul Firdaus Jamaluddin
1, Tan Min Pau
1and Mohd Nor Siti-Azizah
1,2* 1School of Biological Sciences, Universiti Sains Malaysia, Penang, Malaysia.
2Centre for Marine and Coastal Studies, Universiti Sains Malaysia, Penang, Malaysia.
Abstract
Nucleotide sequences of a partial cytochrome c oxidase subunit I gene were used to assess the manner in which his-torical processes and geomorphological effects may have influenced genetic structuring and phylogeographic pat-terns inChanna striata. Assaying was based on individuals from twelve populations in four river systems, which were separated into two regions, the eastern and western, of the biodiversely rich state of Perak in central Peninsular Ma-laysia. In 238 specimens, a total of 368-bp sequences with ten polymorphic sites and eleven unique haplotypes were detected. Data on all the twelve populations revealed incomplete divergence due to past historical coalescence and the short period of separation. Nevertheless, SAMOVA and FSTrevealed geographical structuring existed to a certain
extent in both regions. For the eastern region, the data also showed that the upstream populations were genetically significantly different compared to the mid- and downstream ones. It is inferred that physical barriers and historical processes played a dominant role in structuring the genetic dispersal of the species. A further inference is that the Grik, Tanjung Rambutan and Sungkai are potential candidates for conservation and aquaculture programmes since they contained most of the total diversity in this area.
Key words: Channa striata,mtDNA COI, Phylogeography, Population structure.
Received: April 12, 2010; Accepted: October 13, 2010.
Introduction
Channa striata, locally known as haruan or
snakehead murrel, an eminent tropical freshwater fish widely used for medicinal and pharmaceutical purposes (Mat Jaiset al., 1994; Michelleet al., 2004), is also an im-portant food source in the Asia-Pacific region (Froese and Pauly, 2008; Hossainet al., 2008). This carnivorous air-breather species is encountered in rivers, swamps, ponds, canals, drains, reservoirs, rice fields, small streams, mining pools, roadside ditches and lakes, across southern Asia, southern China, Indochina and the Sunda Islands (Mohsin and Ambak, 1983; Lee and Ng, 1994; Hossainet al., 2008). In Malaysia, and due to its abundance in nature, it is nor-mally marketed alive, fresh from the catch. Aquaculture it-self is only significant in certain neighbouring countries, such as Thailand, Pakistan, Taiwan, the Philippines, Viet-nam, Cambodia and India (Wee, 1982; Hossain et al., 2008). The aquacultural potential of the species in Malay-sia, has, as yet, not been fully exploited despite its many ad-vantageous characteristics, notably high market price, air
breathing ability, hardiness and high tolerance to adverse environmental conditions (Samantaray and Mohanty, 1997; Ali, 1999; Froese and Pauly, 2008). As is frequently observed in many important food-fish, overharvesting and other anthropogenic factors have resulted in severe damage to its natural habitat, with a subsequent decline in the indig-enous stock of the species (Nagarajanet al., 2006; Hossain
et al., 2008). Furthermore, unsystematic hatchery program-mes can also lead to inbreeding depression, with a possible reduction in fecundity, adaptation ability and survival rate (Beaumont and Hoare, 2003; Sunet al., 2004). Hence, in order to effectively conserve and manage the fish, vital in-formation on relevant population genetics is required, spe-cifically through assessment of its genetic diversity and structuring for potential brood-stock identification. Previ-ous studies have focused on reproductive biology (Ali, 1999), medical and pharmaceutical properties (Baie and Sheikh, 2000; Michelleet al., 2004), biochemical composi-tion (Zuraini et al., 2006; Zakaria et al., 2007), ecology (Lee and Ng, 1994; Amilhat and Lorenzen, 2005), breeding (Haniffaet al., 2000), diet (Roshada, 1994; Arul, 2008) and morphological characters (Chandra and Banerjee, 2004), with only limited available information on population ge-netics of the species, especially in Malaysia. Ambaket al.
Send correspondence to Siti Azizah Mohd Nor. School of Biological Sciences, Universiti Sains Malaysia, 11800 Minden, Penang, Ma-laysia. E-mail: sazizah@usm.my.
(2006) and Mat Jaiset al.(2009), when examining the ge-netic structure of snakeheads from Peninsular Malaysia based on RAPD and RFLP data, reported a positive co-relation between hydro-geographic factors (mainly due to the Titiwangsa Mountain Range) and population genetic differentiation, respectively. Hara et al. (1998) also re-ported similar geographic structuring ofC. striatain Thai-land, based on allozymic data.
A typical example of the common aspect of natural landscapes of Peninsular Malaysia (Mohsin and Ambak, 1983), the state of Perak, situated in the central-western re-gion, is overspread with pronounced geographical features, complex natural ecological heterogeneity and dense short river tributaries connecting and running into the Strait of Malacca, thereby sustaining rich biodiversity. Little is known regarding the influence of Pleistocene climate fluc-tuations and geomorphological processes involving drain-age re-arrangements, ecological changes and natural or anthropogenic physical barriers, that have lead to the cur-rent biotic composition of Malaysia in general and Perak State specifically. The Chenderoh dam, and the Bintang and Keledang mountain ranges, as well as the Kerian and Perak rivers and their tributaries, are among the significant geographical features dominating the local landscape. These are probably the factors mainly involved in shaping the genetic pattern of regional biotic systems. Moreover, deglaciation during the late Pleistocene is believed to have periodically separated the two main rivers in the region, the Kerian and Perak, as well as their tributaries. According to the prevailing hypothesis, during the Pleistocene these two rivers coalesced, thus constituting a single course that ran north to the Andaman Sea (Voris, 2000). Therefore, Pleis-tocene climate fluctuations possibly played a significant role in genetic distribution, through changes in the physical land surface, habitats and the natural range of many re-gional species.
In this study, the mitochondrial cytochrome c oxidase subunit I (COI) gene was partially sequenced to examine the genetic diversity and structure ofC. striatapopulations within Perak state in the central Peninsular Malaysia and particularly to infer the mechanisms or forces most likely to have been involved in shaping these populations, thus pro-viding critical genetic information for brood-stock manage-ment and species conservation.
Material and Methods
Sample acquisition
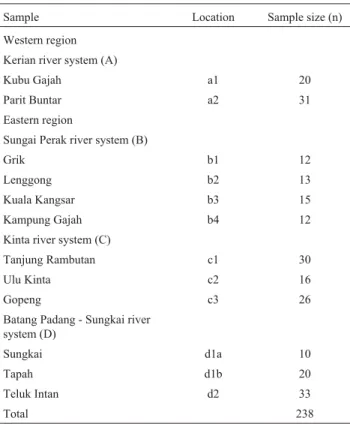
A total of 238 individuals ofC. striata, representing twelve populations throughout Perak state, were sampled from the wild during the period 2007 to 2009. These popu-lations were classified into four categories, according to their placing along the respective river system. The Grik, Tanjung Rambutan and Sungkai populations, through be-ing the closest to their origins, were then considered as
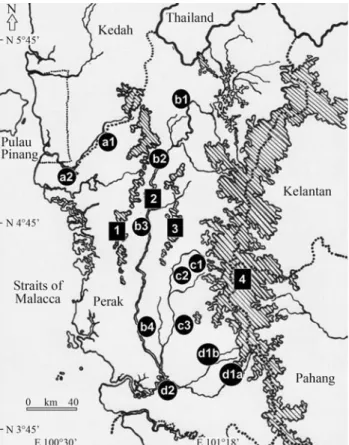
up-stream populations, whereas, the Tapah, Kubu Gajah, Lenggong and Ulu Kinta were clustered as upper-mid stream, the Kuala Kangsar and Gopeng as mid-stream, and finally, the Parit Buntar, Kampung Gajah and Teluk Intan as downstream populations. These populations were fur-ther divided into two major regions, the eastern and west-ern, effectively separated by the Bintang mountain range. Only one single river system, the Kerian river, was investi-gated in the western region. Since the eastern covered a larger area, with several distinct tributaries, this was further divided into three riverine systems, namely the Perak, Kinta and Batang Padang - Sungkai. Two further signifi-cant geographical landmarks in this area are (1) the Kele-dang mountain range, which partially separates the Perak and Kinta rivers along the upper-mid stream, and (2) the Chenderoh dam, built across Perak river. Details of sam-pling locations, and region and sample sizes, are shown in Table 1 and Figure 1.
Tissues collected were dissected and preserved in TNES-urea (100 mM Tris-HCl pH 7.5, 125 mM NaCl, 10 mM EDTA pH 7.5, 1% SDS, 3 M urea), modified ac-cording to Valles-Jimenezet al.(2004), and 95% ethanol (for long term preservation), prior to DNA extraction.
DNA analysis
An AquaGenomic DNA isolation Kit (BioSyntech, Salt Lake City, Utah, USA) was used for total DNA extrac-tion from fins and muscles, according to manufacturer's
in-Jamsariet al. 153
Table 1- Sample localities and size (n) ofChanna striataanalysed in the present study.
Sample Location Sample size (n)
Western region
Kerian river system (A)
Kubu Gajah a1 20
Parit Buntar a2 31
Eastern region
Sungai Perak river system (B)
Grik b1 12
Lenggong b2 13
Kuala Kangsar b3 15
Kampung Gajah b4 12
Kinta river system (C)
Tanjung Rambutan c1 30
Ulu Kinta c2 16
Gopeng c3 26
Batang Padang - Sungkai river system (D)
Sungkai d1a 10
Tapah d1b 20
Teluk Intan d2 33
structions. DNA integrity and quantities were assessed on 0.8% (w/v) agarose gel, with a spectrophotometer (U-1900 UV/VIS spectrophotometer 200V - Hitachi, Tokyo, Japan). The DNA was then stored at -20 °C until use. A segment of the COI mtDNA gene was PCR-amplified using the prim-ers L6154 (5'-AYC ARC AYY TRT TYT GRT TCT-3') and H6556 (5'-TGR AAR TGI GCI ACW ACR TA-3') (Teletchea et al., 2006). Amplification was with an MJ PTC-200 thermal cycler (MJ Research, Waltham, MA, USA) at a total volume of 25mL containing 1X PCR buffer,
4.2 mM MgCl2, 0.2 mM dNTPs, 0.6mM of each primer,
0.08 U ofTaq polymerase and 50 to 100 ng of template DNA. The reaction programme was carried out initially at 95 °C for 5 min followed by 30 cycles with the following profile: 94 °C for 60 s, 50 °C for 60 s, 70 °C for 60 s and fi-nally 5 min of final extension at 72 °C. DNA amplification products were separated in 1.5% (w/v) agarose gels at 100 V with 0.5X Tris-borate-EDTA (TBE) buffer, stained with ethidium bromide and visualized under UV illumina-tion. PCR products were purified using a QIAquick PCR purification kit (Qiagen, Valencia, CA, USA), and sequen-ced using Big Dye Terminator v3.1 and an ABI3730XL
Genetic Analyzer (Applied Biosystems, Foster City, CA, USA).
Data analysis
Initial editing of ambiguous bases was undertaken with MEGA 4.0 software (Tamuraet al., 2007). The edited sequences were then aligned by using Clustal W 1.6 imple-mented in the same software. The alignments thus obtained were further visually cross-checked. Amino acid sequence translation (vertebrate mitochondrial code) was applied to evaluate the accuracy of COI sequences, and then trans-lated back for subsequent analysis. Collapse 1.2 (Posada, 2006) was used to determine identical haplotypes in the aligned matrix. All haplotypes were deposited in GenBank (accession numbers GQ244413 to GQ244422 and GQ334376). Molecular diversity indices [number of haplotypes, polymorphic sites, transitions, transversions, and haplotype (h) and nucleotide (p) diversities], besides a
population comparisons by pairwiseF-statistics, were cal-culated by using Arlequin version 3.1 software (Schneider
et al., 2000), in order to reveal the level of genetic variation and population structure. To correct for multiple compari-sons, the sequential Bonferroni correction was applied. Spatial analysis of molecular variance (SAMOVA) was performed using SAMOVA v.1.0 (Dupanloupet al., 2002), indicated the amount of genetic variation, as well as geo-graphically homogeneous population clusters. Finally, the CONTRIB version 1.02 software (Petitet al., 1998) was used to evaluate the contribution of each population to total diversity, as measured by allelic richness (CTR).
Results
Genetic variability, haplotype distribution and haplotype network relationships
A total of 368 bp of unambiguous COI sequence alignments, with ten (2.7%) variable nucleotide positions and six (1.6%) parsimoniously informative sites, were ob-tained. Nine of the base substitutions were transitions, whereas only one was a transversion. All the variable sites occurred at the third codon position. Altogether, eleven unique putative haplotypes were identified from all the 238 individuals sampled. The mean base composition (%) was 24.7A: 20.2G: 29.9T: 25.2C. In the eastern region (Perak River, Batang Padang - Sungkai river and Kinta river sys-tems), haplotype 01 was predominant and unique, whereas haplotype 07 was common but not exclusive to the western Kerian river system. Most of the haplotypes were shared by multiple populations, with only three haplotypes being population specific. Nine of the 11 haplotypes (except 04 and 07) were unique to either the eastern or western re-gions. Haplotypes 01, 07 and 04 were the most common, contributing with 59.2%, 21% and 9.7%, respectively, to total haplotype occurrence.
The genetic variability parameters, viz., nucleotide and haplotype diversities, in populations, river systems and the total population, are presented in Table 2. Nucleotide and haplotype diversities ranged from 0.0007 to 0.0067 and 0.1000 to 0.7879, respectively. As a whole, relatively low mean population nucleotide (0.0048) and haplotype (0.5964) diversities were observed. Although much higher genetic variation was observed in upstream populations, this was only moderate downstream ones, reaching the low-est in upper-middle and mid-stream populations. In gen-eral, genetic diversity was slightly higher in upper-mid stream than in mid-stream populations. In the upstream populations, diversity was high (h: 0.7126 to 0.7879 and
p: 0.0052 to 0.0067), thereby contributing significantly to
total genetic diversity (Figure 2), whereas in the remainder, this was low to moderate (h: 0.1000 to 0.3333 andp: 0.0013
to 0.0030). Low genetic variability (h: 0.2541 to 0.4914 and
p: 0.0025 to 0.0035) was also observed when all the
popu-lations in the same river system were treated as a single en-tity.
Population differentiation (FST) and the spatial
analysis of molecular variation (SAMOVA)
Overlapping haplotype distribution, haplotype shar-ing and low nucleotide mutation among all the populations, were apparent from the data. Nevertheless, substantial ge-netic differentiation was observed among the western and eastern lineages (FST ranging from 0.4535 to 0.8526 and SAMOVA with FCT: 0.6210) (Tables 3 and 4). However, with the exception of the Grik, Tanjung Rambutan and Sungkai populations, no significant genetic differentiation among populations within river systems and regions them-selves was detected (Table 3). In the Perak river, genetic differentiation between the upstream Grik population and the downstream population Kampung Gajah, was insignifi-cant. Interestingly, no significant differentiation (FST: 0.0000 to 0.0244) was observed when assessing pair-wise comparison of the Grik, Sungkai and Tanjung Rambu-tan populations, although the three belonged to different river systems,i.e., they were genetically similar to each
other but not to other members within their own river sys-tem and region. Furthermore, in the eastern region, where all the various populations, through occupying one and the same river system, were treated as a single group, low and insignificant mutual population differentiation (FSTranging from 0 to 0.0122) was recorded. Limited statistical analysis could be applied to the western region, consisting of only one river system (the Kerian river) comprising two popula-tions. The Parit Buntar, Kubu Gajah, Grik and Sungkai populations were the main contributors to population dif-ferentiation among all those studied (Figure 2).
SAMOVA analysis indicated that 62.10% of the total variation existed between the two regions, 4.84% among populations within the region itself, and 33.06% within the populations, with significant support at all hierarchical lev-els. Furthermore, the SAMOVA tests also showed that a large proportion of the molecular variance was attributable to genetic differences among populations within the total (FST: 0.6694) and to differences between the eastern and western regions (FCT: 0.6210). However, inspection of the data revealed that the significant (although low) differences among populations within regions (FSC: 0.1277) were con-tributed by the three genetically significantly different up-stream populations, Tanjung Rambutan, Grik and Sungkai.
Discussion
Genetic variation
Despite their abundance and wide distribution, as well as several biologically advantageous attributes, ge-netic variation was relatively low (mean h: 0.5964,
p: 0.0048) in theC. striatapopulations investigated. The
three upstream populations near the riverheads, upstream Grik, Tanjung Rambutan and Sungkai, revealed high ge-netic diversity, whereas in the three downstream popula-tions this was moderate, and very low in the six upper-middle and mid- stream ones. From this it can be inferred that upstream populations are colonizing centers or refugia. These refugia harbour high variability (withh: 0.7126 to 0.7879 andp: 0.0052 to 0.0067), thereby implying a large
initial effective population size. Pleistocene glaciation peri-ods gave origin to substantial habitat re-organization, sub-sequently leading to the displacement of populations into glacial refugia, thereby giving rise to high intraspecific di-versity, both through secondary contact between differenti-ated assortments, as also with the local gene pool, as ap-praised by Grant and Bowen (1998) and Petitet al.(2003) in marine fishes and European trees shrubs, respectively. Nevertheless, no refugium was detected, neither in the western region nor in the Batang Padang river in the east-ern, probably due to limited sampling effort, although it is very likely such a parallel pattern does exist. Interestingly, all putative refugia were located in the upstream reaches, thereby indicating altitudinal shifts in refugee movements during the interglacial period.
Jamsariet al. 155
Genetic
structure
of
Channa
striata
Population
1 1 1 2 2 2 3 3 A B C D Total
7 9 3 7 9 0 3 7 0 4 a1 a2 b1 b2 b3 b4 c1 c2 c3 d1a d1b d2 (238)
8 0 5 7 8 1 1 0 9 2 (21) (31) (12) (13) (15) (12) (30) (16) (26) (10) (20) (33)
Hap01 G C T C T A G G G T 0.417 0.923 0.933 0.833 0.400 0.875 0.923 0.400 0.950 0.818 0.592
Hap02 . A . . . . A . A . 0.050 0.065 0.013
Hap03 . . . G A . A . 0.050 0.032 0.008
Hap04 . . . A . A . 0.065 0.167 0.083 0.367 0.063 0.400 0.061 0.097
Hap05 . . . T C . A . . . 0.100 0.004
Hap06 . . . . C . A . . . 0.067 0.033 0.077 0.030 0.021
Hap07 . . . . C . A A . . 0.900 0.839 0.083 0.077 0.067 0.063 0.030 0.210
Hap08 . . C . . . A C 0.033 0.100 0.030 0.013
Hap09 . . C . . . A . A C 0.250 0.013
Hap10 A . . . A . A C 0.083 0.004
Hap11 A . C . . . A . A C 0.083 0.100 0.050 0.030 0.025
No. of polymorphic sites 5 5 7 3 2 5 7 4 2 6 5 7 10
5 7 7 8
Number of haplotypes 3 4 5 2 2 3 6 3 2 4 2 6 11
4 7 6 7
Transition : Transversion 4:1 4:1 7:0 3:0 2:0 5:0 7:0 4:0 2:0 6:0 5:0 7:0 9:1
4:1 7:0 7:0 8:0
Nucleotide diversity (p) 0.0021 0.0028 0.0067 0.0013 0.0007 0.0030 0.0054 0.0017 0.0008 0.0052 0.0014 0.0026 0.0048
0.0025 0.0032 0.0035 0.0028
Haplotype diversity (h) 0.1947 0.2968 0.7879 0.1538 0.1333 0.3182 0.7126 0.2417 0.1477 0.7333 0.1000 0.3333 0.5964
The lower genetic variability recorded in the up-per-middle, mid- and downstream populations may reflect their re-colonisation via successive founder events, each with a relatively lowNevalue, and by either a single or only few organelle-lineage colonisation (Grant and Bowen, 1998; Wang et al., 2000), in a passive downstream dis-persal-migration route. This downstream migration pattern had already been documented in a study by Hallset al.
(1998) ofC. striatain Bangladesh. Alternatively, the low variability observed in these three populations could also be the result of a historical bottleneck event that may have almost eradicated these populations. Notwithstanding, ge-netic variation in three downstream populations, viz., the Parit Buntar, Kampung Gajah and Teluk Intan, was higher than in the upper-middle and mid ones. Presumably their downstream location was more propitious for the overlap-ping of colonisation routes, with concomitant admixture of haplotypes or alleles from several separate refugia, or other connected river systems. This had already been observed in other studies of the same scenario (Nguyenet al., 2006).
Phylogeographic relationships
Based on FSTand SAMOVA analyses, three geneti-cally different groups were identified: (1) the western re-gion, (2) an upstream population in the eastern rere-gion, and (3) a mid downstream population, also in the eastern re-gion. These populations were, however, incompletely di-vergent, evident by overlapping haplotype distribution, haplotype sharing and low nucleotide mutation. The lack of genetic divergence within geographical regions (except in refugia), incompatible with the low migratory behavior of
C. striata(Hallset al., 1998; Amilhat and Lorenzon, 2005), implied factors other than free gene flow, possible alterna-tives being either recent population expansion with insuffi-cient time for coalescence (cf. Wang et al., 2000), or interconnection of the areas studied. Mid and lower stream topology may not have been a sufficient hindrance against gene flow, when compared to the situation upstream. Fur-thermore, this region is also liable to high flooding (Mohsin and Ambak, 1983; Liu and Chan, 2003), thereby facilitat-ing lateral dispersal to flood plains, watersheds or between
Jamsariet al. 157
Table 3- Pairwise FSTbetween populations and river systems (indicated in boldface) ofC. striata, based on the COI gene.Significant FST(p < 0.05, p < 0.01 and p < 0.001) based on 10000 permutations of haplotype frequencies among samples, after Bonferroni correction, are indicated with *, † and ‡, respectively.
a1 A2 A b1 b2 b3 b4 B c1 c2 c3 C d1a d1b
a1
a2 0.0000
A
b1 0.5185‡ 0.4764‡
b2 0.8086‡ 0.7342‡ 0.2348†
b3 0.8320‡ 0.7616‡ 0.2704† 0.0000
b4 0.7565‡ 0.6945‡ 0.1344 0.0000 0.0000
B 0.6728‡
c1 0.4870‡ 0.4535‡ 0.0244 0.2468† 0.2677† 0.1448*
c2 0.7711‡ 0.7075‡ 0.1901* 0.0000 0.0000 0.0000 0.2008†
c3 0.8315‡ 0.7724‡ 0.3211‡ 0.0000 0.0000 0.0088 0.3035‡ 0.0000
C 0.5976‡ 0.0122
d1a 0.5992‡ 0.5440‡ 0.0073 0.3256† 0.3563† 0.1805* 0.0000 0.2567* 0.4082‡
d1b 0.8526‡ 0.7839‡ 0.3282‡ 0.0000 0.0000 0.0000 0.3021‡ 0.0000 0.0000 0.4199‡
d2 0.7152‡ 0.6750‡ 0.1793† 0.0000 0.0000 0.0000 0.1907‡ 0.0000 0.0045 0.2309† 0.0089
D 0.6813‡ 0.0000 0.0047
Table 4- Spatial analysis of molecular variance (SAMOVA) between populations ofChanna striatain Perak State. Significant values at p < 0.05 and p < 0.001 are indicated with * and ‡, respectively.
Source of variation d.f. Sum of squares Variance components Percentage of variation Fstatistics
Among groups 1 77.661 0.9394 Va 62.10 FCT: 0.6210*
Among populations within groups 10 18.863 0.0732 Vb 4.84 FSC: 0.1277‡
Within populations 226 113.027 0.5001 Vc 33.06 FST: 0.6694‡
adjacent populations (Hurwood and Hughes, 1998; Wang
et al., 2000).
Two topographically isolated stocks of C. striata
were revealed. Geographical separation by the Bintang mountain range, and changes in sea-water level during the Pleistocene, constitute two significant elements which have probably influenced the genetic distribution pattern ofC. striata between the western and eastern regions of this highland. This mountain range, composed of several prom-inent peaks up to 1800 m high, only permitted genetic ex-change between the systems at the ancient confluence, now submerged into the bed of the Strait of Malacca. Periodic changes in sea level witnessed the disappearance of this historical connection, with subsequently isolated popula-tions forming distinct evolutionary units. Overlapping haplotype distribution and sharing, as well as low nucleo-tide mutation, provide ample evidence of this connection. It is apparent that, following construction of the Chenderoh dam across the Perak river in the 1930's, insufficient time has passed for any marked differentiation to have occurred among the isolated populations (cf. Hurwood and Hughes, 1998; Sunet al., 2004). Nevertheless, this event could po-tentially lead to substantial genetic restructuring over time, especially with the complete isolation of the genetically richer upstream sites from downstream populations. Simi-larly, the Keledang Mountain Range has not contributed to any obvious genetic divergence between the Perak and Kinta Rivers.
In theory, population segregation will normally con-tribute to genetic differentiation among isolated popula-tions (cf. Hurwood and Hughes, 1998; Wanget al., 2000). Thus, it was unusual to discover that the three presumptive refugia in different rivers were genetically very closely re-lated. Due to the small-sized study area, one possible factor could be the absence of the suitable ecological heterogene-ity for stimulating overall local adaptation. Furthermore, all the populations were either of a common origin, or origi-nated from a single colonization unit, seeing that during the glaciation period, each refugium maintained or accumu-lated all (or almost all) the haplotypes either from the origi-nal population or from other sites. Thirdly, the cytochrome oxidase subunit 1 (COI) was incapable of detecting popula-tion variability in this species, probably due to its relatively low mutation rate (Hebertet al., 2003; Hellberg, 2006), but also to the short time-span since population contraction into refugia during the last Pleistocene, insufficient for observ-able genetic differentiation to have occurred.
Overall, physical barriers to gene flow are thought to have played an important role in establishing evolutionary units between the two separate regions, whereas within each region, it appears that historical processes leading to environment disturbance and subsequent habitat re-organi-sation, have played a more predominant role in structuring the genetic dispersal of the species.
Conservation and management implications
The conservation of species is a source of great con-cern, especially regarding those endangered and/or of high economic value. This study provided useful and critical ge-netic information for planning management, conservation and ranching guidelines forC. striatain the biodiversity-rich Perak State. Nevertheless, based on limited genetic in-formation, all inferences should be reconfirmed using faster evolving markers, such as microsatellites. Based on FST and SAMOVA analyses, two genetically identified stocks, the eastern and the western, were detected, both re-quiring separate monitoring and management (Moritz, 1994). Translocation between the two is not recommended, to thus avoid genetic disruption (Jørstad and Farestveit, 1999), adverse competition (Minckley, 1995), or the intro-duction of diseases (Mahidolet al., 2007). Furthermore, in the case of restoration involving local stock enhancement, special precautions must be taken, as this species reportedly exerts a negative ecological impact on aquatic communi-ties, mainly due to its carnivorous behaviour (Cagauan, 2007; Froese and Pauly, 2008). With respect to the eastern region, if the upstream population as a source of gene pool for downstream populations could be verified, stock trans-fer from the former could be a beneficial option. Otherwise, they should be managed separately. Furthermore, as the more elevated upstream areas harbor a large proportion of the total genetic variation in this region, maximum priority for conservation should be given to this area. A strict regu-lation of harvest and fishery management should be imple-mented to protect genetically depauperate downstream populations. Habitat protection from agricultural and in-dustrial activities, including the development of surround-ing areas, as well as the construction of river-dams which prevent population connectivity, must be carefully regu-lated, seeing that the latter brings about habitat fragmenta-tion, thereby potentially causing further losses in genetic diversity or an increase in inbreeding depression. As an al-ternative, the introduction and improvement ofC. striata
aquaculture is a fine option for ensuring the maintenance of this species. Nevertheless, hatchery facilities and opera-tion, as well as brood-stock selecopera-tion, must be systemati-cally controlled, so as to prevent fugitive genetic contamination into the wild and other adverse genetic risks (Mahidolet al., 2007). Based on its high genetic variability and positive contribution towards genetic variation in this region, Grik, Sungkai and Tanjung Rambutan are the most appropriate candidate population of wild species to receive priority as a baseline stock for selective breeding.
Acknowledgments
Innovation (MOSTI) (304/PBIOLOGI/6521033/U128). We would like to thank Dr. Thuy T.T. Nguyen from the Network of Aquaculture Centres in Asia-Pacific(NACA), Bangkok, Thailand and Dr. Geoffrey K. Chambers from Victoria University, Wellington, New Zealand for their valuable comments and analyses of our manuscript. We are also grateful to our colleagues for their technical assistance.
References
Ali AB (1999) Aspects of the reproductive biology of female snakehead (Channa striataBloch) obtained from irrigated rice agroecosystem, Malaysia.Hydrobiologia 411:71-77. Ambak MA, Bolong AA, Ismail P and Tam BM (2006) Genetic
variation of snakehead fish (Channa striata) populations us-ing random amplified polymorphic DNA. Biotechniques 5:104-110.
Amilhat E and Lorenzen K (2005) Habitat use, migration pattern and population dynamics of chevron snakehead Channa striatain a rainfed rice farming landscape. J Fish Biol 67 (Supplement B):23-34.
Arul V (2008) Effects of delayed feeding on growth and survival ofChanna striatus(Bloch) larvae. Aquac Res 22:423-434. Baie SH and Sheikh KA (2000) The wound healing properties of
Channa striatus- cetrimide cream - tensile strength mea-surement. J Ethnopharmacol 71:93-100.
Beaumont AR and Hoare K (2003) Biotechnology and Genetics in Fisheries and Aquaculture. Blackwell Science, Oxford, 158 pp.
Cagauan AG (2007) Review paper: Exotic aquatic species intro-duction in the Philippines for aquaculture - A threat to biodiversity or a boon to the economy? J Environ Sci Manag 10:48-62.
Chandra S and Banerjee TK (2004) Histopathological analysis of the respiratory organs ofChanna striatasubjected to air ex-posure. Veterinarski Archiv 74:37-52.
Dupanloup I, Schneider S and Excoffier L (2002) A simulated an-nealing approach to define the genetic structure of popula-tions. Mol Ecol 11:2571-2581.
Grant WAS and Bowen BW (1998) Shallow population histories in deep evolutionary lineages of marine fishes: Insights from sardines and anchovies and lessons for conservation. J Hered 89:415-426.
Halls AS, Hoggarth DD and Debnath K (1998) Impact of flood control schemes on river fish migrations and species assem-blages in Bangladesh. J Fish Biol 53 (Supplement A):358-380.
Haniffa MA, Merlin T and Mohamed JS (2000) Induced spawn-ing of the striped murrelChanna striatususing pituitary ex-tracts, human chorionic gonadotropin, luteinizing hormone releasing hormone analogue, and ovaprim Acta Icht Piscat 30:53-60.
Hara M, Sekino M and Na-Nakorn U (1998) Genetic differentia-tion of natural populadifferentia-tions of the snake-head fish,Channa striatusin Thailand. Fish Sci 64:882-885.
Hebert PDN, Cywinska A, Ball SL and de Waard JR (2003) Bio-logical identifications through DNA barcodes. Proc R Soc Lond B Biol Sci 270:313-321.
Hellberg ME (2006) No variation and low synonymous substitu-tion rates in coral mtDNA despite high nuclear variasubstitu-tion. BMC Evol Biol 6:24.
Hossain MK, Latifa GA and Rahman MM (2008) Observations on induced breeding of snakehead murrel,Channa striatus (Bloch, 1793). Int J Sustain Crop Prod 3:65-68.
Hurwood DA and Hughes JM (1998) Phylogeography of the freshwater fish,Mogurnda adspersa, in streams of north-eastern Queensland, Australia: Evidence for altered drain-age patterns. Mol Ecol 7:1507-1517.
Jørstad KE and Farestveit E (1999) Population genetic structure of lobsterHomarus gammarusin Norway, and implications for enhancement and sea-ranching operation. Aquaculture 173:447-457.
Lee PG and Ng PKL (1994) The systematics and ecology of snakeheads (Pisces, Channidae) in Peninsular Malaysia and Singapore. Hydrobiologia 285:59-74.
Liu P and Chan NW (2003) The Malaysian flood hazard manage-ment program. Int J Emerg Manag 1:205-214.
Mahidol C, Na-Nakorn U, Sukmanomon S, Taniguchi N and Nguyen TTT (2007) Mitochondrial DNA diversity of the Asian moon scallop,Amusium pleuronectes(Pectinidae), in Thailand. Mar Biotechnol 9:352-359.
Mat Jais AM, Abdul Rahim MH, Alias R and Muhammad N (2009) Genetic marker for haruan Channa striatus. In: Procedings of the 8thMalaysia Congress on Genetics 2009, Genting Highland, Malaysia, pp 29.
Mat Jais AM, McCulloh R and Croft K (1994) Fatty acid and amino acid composition in haruan as a potential role in wound healing. Gen Pharmacol 25:947-950.
Michelle NYT, Shanti G and Loqman MY (2004) Effect of orally administered Channa striatus extract against experimen-tally-induced osteoarthritis in rabbits. Int J Appl Res Vet Med 2:171-175.
Minckley WL (1995) Translocation as a tool for conserving im-periled fishes: Experiences in Western United States. Biol Conserv 72:297-309.
Mohsin AKM and Ambak MA (1983) Freshwater Fishes of Pen-insular Malaysia. Penerbitan Universiti Pertanian Malaysia, Kuala Lumpur, 284 pp.
Moritz C (1994) Defining “Evolutionarily Significant Units” for conservation. Trends Ecol Evol 9:373-375.
Nagarajan M, Haniffa MA, Gopalakrishnan A, Basheer VS and Muneer A (2006) Genetic variability ofChanna punctatus
populations using randomly amplified polymorphic DNA. Aquac Res 37:1151-1155.
Nguyen TTT, Hurwood D, Mather P, Na-Nakorn U, Kamonrat W and Bartley D (2006) Manual on applications of molecular tools in aquaculture and inland fisheries management, Part 2: Laboratory protocols and data analysis. NACA mono-graph number 2, 134 pp.
Petit RJ, Aguinagalde I, de Beaulieu JL, Bittkau C, Brewer S, Cheddadi R, Ennos R, Fineschi S, Grivet D, Lascoux Met al.(2003) Glacial refugia: Hotspots but not melting pots of genetic diversity. Science 300:1563-1565.
Petit RJ, El Mousadik A and Pons O (1998) Identifying popula-tions for conservation on the basis of genetic markers. Conserv Biol 12:844-855.
Posada D (2006) Collapse: Describing Haplotypes from Sequence Alignment. Computational Evolutionary Biology Lab, Uni-versity of Vigo.
Roshada H (1994) The effect of mixed feeding schedules of vary-ing dietary protein content on the growth performance of
Channa striatafry. Asian Fish Sci 7:149-155.
Samantaray K and Mohanty SS (1997) Interactions of dietary lev-els of protein and energy on fingerling snakehead,Channa striata.Aquaculture 156:241-249.
Schneider S, Roessli D and Excoffier L (2000) Arlequin v. 2000: A software for population genetic data analysis. Genetics and Biometry Laboratory, University of Geneva.
Sun Y, Liu S, Zhao G, He S, Wu Q, Taniguchi N and Yu Q (2004) Genetic structure of Chinese sucker population Myxocy-prinus asiaticusin the Yangtze River based on mitochon-drial DNA marker. Fish Sci 70:412-420.
Tamura K, Dudley J, Nei M and Kumar S (2007) MEGA4: Molec-ular Evolutionary Genetics Analysis (MEGA) v. 4.0. Mol Biol Evol 24:1596-1599.
Teletchea F, Laudet V and Hänni C (2006) Phylogeny of the Gadidae (sensu Svetovidov, 1948) based on their morphol-ogy and two mitochondrial genes. Mol Phylogenet Evol 38:189-199.
Valles-Jimenez R, Cruz P and Perez-Enriquez R (2004) Popula-tion genetic structure of Pacific white shrimp (Litopenaeus vannamei) from Mexico to Panama: Microsatellite DNA variation. Mar Biotechnol 6:475-484.
Voris HK (2000) Maps of Pleistocene sea levels in Southeast Asia: Shorelines, river systems and time durations. J Bio-geogr 27:1153-1167.
Wang JP, Hsu KC and Chiang TY (2000) Mitochondrial DNA phylogeography ofAcrossocheilus paradoxus(Cyprinidae) in Taiwan. Mol Ecol 9:1483-1494.
Wee KL (1982) The biology and culture of snakeheads. In: Muir JF and Roberts RJ (eds) Recent Advances in Aquaculture. Westview Press, Boulder, pp 180-211.
Zakaria ZA, Mat Jais AM, Goh YM, Sulaiman MR and Somchit MN (2007) Amino acid and fatty acid composition of an aqueous extract ofChanna striatus(haruan) that exhibits antinociceptive activity. Clin Exp Pharmacol Physiol 34:198-204.
Zuraini A, Somchit MN, Solihah MH, Goh YM, Arifah AK, Zakaria MS, Somchit N, Rajion MA, Zakaria ZA and Mat Jais AM (2006) Fatty acid and amino acid composition of three local Malaysian Channa spp. fish. Food Chem 97:674-678.
Internet Resources
Froese R and Pauly D (eds) (2008) FishBase. World Wide Web electronic publication. www.fishbase.org (11/2008).
Associate Editor: Fábio de Melo Sene