A Cost-Effectiveness Analysis
C. Andy Schuetz1*, Peter Alperin1, Swathi Guda1, Andrew van Herick1, Bertrand Cariou2, David Eddy1, Janusz Gumprecht3, Antonio Nicolucci4, Peter Schwarz5, Nick J. Wareham6, Daniel R. Witte7, Ulf Smith8 1Archimedes, Inc., San Francisco, California, United States of America,2Clinique d’Endocrinologie, l’Institut du Thorax, CHU Nantes, Nantes, France,3Department of Internal Diseases, Diabetology and Nephrology, Medical University of Silesia, Zabrze, Poland,4Department of Clinical Pharmacology and Epidemiology, Consorzio Mario Negri Sud, Santa Maria Imbaro, Italy,5Department of Medicine III Prevention and Care of Diabetes , University of Dresden, Dresden, Germany,6Medical Research Council Epidemiology Unit, Institute of Metabolic Science, Addenbrooke’s Hospital, Cambridge, United Kingdom,7Steno Diabetes Center, Gentofte, Denmark,8Sahlgrenska University Hospital, Gothenburg, Sweden
Abstract
Background: No clinical trials have assessed the effects or cost-effectiveness of health check strategies to detect and manage vascular disease. We used a mathematical model to estimate the cost-effectiveness of several health check strategies in six European countries.
Methods: We used country-specific data from Denmark, France, Germany, Italy, Poland, and the United Kingdom to generate simulated populations of individuals aged 40–75 eligible for health checks in those countries (e.g. individuals without a previous diagnosis of diabetes, myocardial infarction, stroke, or serious chronic kidney disease). For each country, we used the Archimedes model to compare seven health check strategies consisting of assessments for diabetes, hypertension, lipids, and smoking. For patients diagnosed with vascular disease, treatment was simulated in a standard manner. We calculated the effects of each strategy on the incidence of type 2 diabetes, major adverse cardiovascular events (MACE), and microvascular complications in addition to quality of life, costs, and cost per quality-adjusted life-year (QALY).
Results:Compared with current care, health checks reduced the incidence of MACE (6–17 events prevented per 1000 people screened) and diabetes related microvasular complications (5–11 events prevented per 1000 people screened), and increased QALYs (31–59 discounted QALYs) over 30 years, in all countries. The cost per QALY of offering a health check to all individuals in the study cohort ranged fromJ14903 (France) to cost saving (Poland). Pre-screening the population and offering health checks only to higher risk individuals lowered the cost per QALY. Pre-screening on the basis of obesity had a cost per QALY ofJ10200 (France) or less, and pre-screening with a non-invasive risk score was similar.
Conclusions:A vascular disease health check would likely be cost effective at 30 years in Denmark, France, Germany, Italy, Poland, and the United Kingdom.
Citation:Schuetz CA, Alperin P, Guda S, van Herick A, Cariou B, et al. (2013) A Standardized Vascular Disease Health Check in Europe: A Cost-Effectiveness Analysis. PLoS ONE 8(7): e66454. doi:10.1371/journal.pone.0066454
Editor:Massimo Federici, University of Tor Vergata, Italy
ReceivedDecember 21, 2012;AcceptedMay 6, 2013;PublishedJuly 15, 2013
Copyright:ß2013 Schuetz et al. This is an open-access article distributed under the terms of the Creative Commons Attribution License, which permits unrestricted use, distribution, and reproduction in any medium, provided the original author and source are credited.
Funding:Novo Nordisk sponsored this work. The funders had no role in study design, data collection and analysis, decision to publish, or preparation of the manuscript.
Competing Interests:CAS, PA, SG, AvH, and DE are employees of Archimedes Inc, and declare financial support for the submitted work from Novo Nordisk Company. BC has served on the advisory panel for Novo Nordisk, and received research support from Novo Nordisk. AN has board membership for Merck Sharp & Dohme, and Novartis, does consultancy of Novo Nordisk, and has research grants from Novo Nordisk, Merck Sharp & Dohme, Eli Lilly, and Sanofi Aventis. PS is a board member of EMPERRA GmbH. The remaining authors declare no support from any organization for the submitted work. This does not alter the authors’ adherence to all the PLOS ONE policies on sharing data and materials.
* E-mail: andy.schuetz@archimedesmodel.com
Introduction
Diabetes and cardiovascular disease (collectively referred to as vascular disease) are leading causes of mortality and morbidity throughout the world [1,2]. Rates of obesity and diabetes are rising at an alarming pace across Europe [3]. Managing vascular disease over the coming decades will require an integrated approach to addressing established modifiable risk-factors. Popu-lation level screening should be a central element of any management strategy, because the early stages of vascular disease are often asymptomatic, and many individuals remain undiag-nosed until debilitating and costly complications occur [4,5,6,7].
The NHS Health Check program was developed in the United Kingdom (UK) to address this problem [8,9]. The Health Checks program integrates the prevention, early detection, and treatment of type 2 diabetes, hypertension, dyslipidemia, and smoking. Further, previous modeling studies have indicated that health checks and screening for diabetes are likely to be cost effective [10,11,12].
understanding than prior studies by forecasting the impact of offering health checks that address multiple aspects of vascular disease, recurring every five years, in six European settings.
Methods
We simulated a clinical trial comparing seven health check strategies to current levels of care in Denmark, France, Germany, Italy, Poland, and the UK. For each country, we forecasted the impact of each strategy on the incidence of major adverse cardiovascular events, and diabetes related microvascular compli-cations, as well as medical costs, and quality adjusted life years (QALYs).
Mathematical Model
Our estimates were made with the Archimedes Model, a person-specific simulation model designed to capture what happens in real health care systems at a clinically meaningful level of detail. The Model forecasts health outcomes and health care utilization associated with diabetes and its complications, coronary artery disease, congestive heart failure, stroke, hyperten-sion, obesity, metabolic syndrome, and cancers of the breast, lung, and colon. Including all relevant conditions and the health care system in a single integrated model captures interactions between diseases and comorbidities in a physiologically realistic way.
Details of the Model pertinent to diabetes and its complications have been described elsewhere [13,14,15], and a description of the model structure and data sources used in the modeling is provided as File S2.
In brief, the Model uses person-specific data to generate simulated individuals, each having a unique physiology that evolves continuously over time, and which can begin to function abnormally in the case of disease, potentially causing symptoms, changes in biomarkers, and ultimately health outcomes. The Model includes detailed representations of the health care system, with acute and ambulatory care settings, physicians, medical tests, and so on. The simulated health care system is calibrated to match patterns of health care delivery observed in the target setting (File S3). The data sources used to model the benefits of lifestyle, anti-platelet, anti-diabetic, anti-hypertensive, and lipid lowering therapies are provided as File S2.
The accuracy of the Archimedes Model has been validated through simulations of a large number of epidemiological, clinical, and health service research studies [16]. More than 50 clinical trials in both US and European settings have been used to validate the Model, and a full validation report is provided as File S4 and on the Archimedes website [15]. Further, two validations have been performed prospectively [17], including the CARDS study [18] which enrolled a UK population.
Table 1.Simulated health check strategies and control.
Eligibility criteria for risk assessments, for individuals offered a health check
Strategy Diabetes risk assessment* Lipid risk assessment Lifestyle Interventions{
Control – No health checks offered None None None
Health check – base-case All All All
Health check without lifestyle interventions All All None
Health check with gated HbA1c test BMI$30 or BP$140/90 All All
Pre-screening scenarios targeting patients meeting the following additional criteria
Age 50 years or greater All All All
BMI 30 kg/m2or greater All All All
Above median of diabetes and CVD risk All All All
Top quartile of diabetes and CVD risk All All All
In all cases, individuals had to be aged 40–75 and not have a previous diagnosis of diabetes, myocardial infarction, stroke, or serious chronic kidney disease to be eligible for a health check. In the pre-screening strategies, individuals also had to meet the additional criteria listed in the table. Eligible individuals received the health check at a 5 year interval in all strategies considered.
*Eligible individuals were given an HbA1c test. {
Diet and exercise for individuals with 6.0%#HbA1c,6.0%, and smoking cessation interventions for smokers. doi:10.1371/journal.pone.0066454.t001
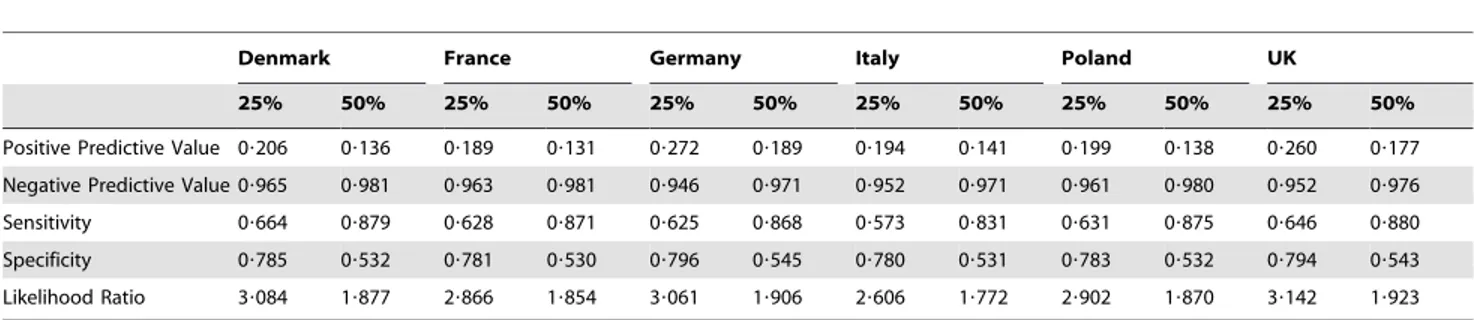
Table 2.Performance of the generic risk score in detecting undiagnosed type 2 diabetes at baseline or the occurrence of CVD at ten years, for individuals with estimated risk in the top quartile (25%) and top half (50%) of the population ranked by risk score.
Denmark France Germany Italy Poland UK
25% 50% 25% 50% 25% 50% 25% 50% 25% 50% 25% 50%
Positive Predictive Value 0?206 0?136 0?189 0?131 0?272 0?189 0?194 0?141 0?199 0?138 0?260 0?177
Negative Predictive Value 0?965 0?981 0?963 0?981 0?946 0?971 0?952 0?971 0?961 0?980 0?952 0?976
Sensitivity 0?664 0?879 0?628 0?871 0?625 0?868 0?573 0?831 0?631 0?875 0?646 0?880
Specificity 0?785 0?532 0?781 0?530 0?796 0?545 0?780 0?531 0?783 0?532 0?794 0?543
Likelihood Ratio 3?084 1?877 2?866 1?854 3?061 1?906 2?606 1?772 2?902 1?870 3?142 1?923
Procedure
We simulated the effects of offering health checks to six European cohorts. For each country, we used a three step process to generate a study cohort of virtual individuals aged 40 to 75, without a previous diagnosis of diabetes, myocardial infarction,
stroke, or serious chronic kidney disease (CKD) (with estimated glomerular filtration rate (eGFR),60 mL/min/1.73m2). First, we generated a population cross-section of all adults aged 20 to 85, matching the demographics and distributions of risk factors observed in real-world data. This population was generated via biased sampling of simulated individuals, based on real subjects observed in NHANES 1999–2008 [19]. This approach to constructing simulated European cohorts using biased sampling of virtual individuals based on US data has been demonstrated to be predictive in the trial validations cited above. The specific real-world data used to create the simulated populations varied by country, but included biomarker and risk factor distributions, as well as the prevalence and incidence of diseases addressed by the health check. A complete listing of the data used is provided in File S1. Second, the performance of the simulated health care system was calibrated to match levels of care currently being delivered in the country, in terms of the prevalence and incidence of diagnoses, medication use (e.g., anti-hypertensive, statin, and anti-diabetic treatments), and the disease burden in the country (including type 2 diabetes, nephropathy, retinopathy, neuropathy, myocardial infarction, stroke, cardiovascular death, and mortality). These first two steps we repeated iteratively until we obtained a simulated population and health care system reflective of the target country. Lastly, the study cohort – individuals eligible for the health check – was extracted from the population cross-section using the eligibility criteria stated above. This three-step process was repeated for each country, yielding six study cohorts.
For each country, we simulated a multi-armed clinical trial comparing the health check strategies to a control scenario in which no health checks were offered (see Table 1 for a list of the strategies). The control scenario was reflective of current care in each country. The health check frequency was every five years, but ceasing at age 70 or upon diagnosis of diabetes, myocardial infarction, stroke, or chronic kidney disease. In the base-case health check, all individuals received assessments for diabetes, hypertension, lipids, and smoking. Consistent with current guidelines, diabetes risk was assessed with an HbA1c test
Table 3.Base-case model input assumptions for quality of life disutilities.
Quality of life disutilities
Health State Disutility Sources
Angina 20?0412 Sullivan29
Myocardial infarction 20?0409 Sullivan29
Stroke 20?0460 Sullivan29
End stage renal disease 20.0780 Coffey30
Blind in one eye 20.0430 Coffey30
Blind in two eyes 20.1700 Coffey30
Foot ulcer 20?0990 Coffey30
Foot amputation 20.1050 Coffey30
Multiple chronic conditions
2 20?0942 Sullivan29
3 20?0876 Sullivan29
4 20?0711 Sullivan29
5 20?0547 Sullivan29
6 20?0419 Sullivan29
7 20?0350 Sullivan29
8 20?0344 Sullivan29
9 0?0026 Sullivan29
10 0?0097 Sullivan29
doi:10.1371/journal.pone.0066454.t003
Table 4.Base-case model input assumptions for costs, in euros.
Costs (J) Denmark France Germany Italy Poland UK
Outpatient visit* 99.71 23.00 34.77 22.85 6.25 35.48
Blood pressure measurement 0 0 0 0 0 0
HbA1c test 14.52 14.40 21.30 12.66 4.97 11.65
Lipid panel 15.74 14.60 21.60 25.55 5.04 11.81
Treatment costs (per day, unless indicated otherwise)
Intensive lifestyle advice 0.42 1.09 0.37 1.18 0.14 0.18
Smoking cessation (cost per quitter) 344.04 319.07 472.00 558.45 110.25 248.10
ACE-inhibitor 0.03 0.42 0.14 0.34 0.01 0.05
Thiazide diuretics 0.06 0.10 0.16 0.87 0.02 0.03
Calcium channel blocker 0.08 0.96 0.11 0.20 0.02 0.04
Beta blocker 0.13 0.53 0.07 0.12 0.01 0.03
Metformin 0.16 0.36 0.26 0.12 0.04 0.03
Sulfonylurea 0.24 0.28 0.07 0.09 0.00 0.05
Glitazone 1.91 2.63 2.11 1.39 0.34 1.42
Insulin 0.56 2.42 1.30 0.89 0.66 0.68
Statin 0.19 1.08 0.48 1.03 0.20 0.26
[20,21]. Individuals confirmed by two tests to have HbA1c of 6.5% or higher were diagnosed with type 2 diabetes, and referred to a diabetes management protocol [22]. Individuals with HbA1c above 6.0% but less than 6.5% were offered intensive lifestyle advice. Hypertensive individuals (blood pressure above 140/90 mmHg) were referred to a management protocol based on the JNC7 guideline [23]. Individuals classified as high risk according to the ATP-III guideline [24,25] and with LDL cholesterol greater than 5.59mmol/L were referred for statin therapy. All smokers were offered a smoking cessation intervention.
We examined providing a health check that only included an HbA1c test for obese (BMI $30 kg/m2) and/or hypertensive individuals, reflective of the strategy used by the NHS Health Checks program. We also examined the effects of offering a health check without lifestyle interventions (omitting intensive lifestyle advice and smoking cessation) to the entire study cohort to gauge the impact of the interventions on the results, since the benefits of lifestyle interventions are more difficult to quantify than pharma-cological interventions.
In consideration of total budget impact, four strategies examined various ways to pre-screen the study cohort, and restrict eligibility for the health check to individuals with elevated risk of vascular disease (also shown in Table 1).
To explore how pre-screening the population with a non-invasive risk test might make the health check more efficient, we created a ‘‘virtual’’, generic risk test based on simulated data. This
generic risk test had the independent risk factors of age, gender, BMI, waist circumference, smoking, family history of diabetes, family history of coronary heart disease, and anti-hypertensive usage. The generic risk test had a logistic functional form, and was based on a logistic regression performed on the presence of undiagnosed diabetes at baseline or the ten-year occurrence of myocardial infarction, stroke, or CV death, in half of the simulated Danish population cross-section of adults aged 20 to 85. Two thresholds were considered for the risk test: individuals in the top quartile of risk, and individuals above median risk, as predicted by the logistic score. The performance of the generic risk test in detecting undiagnosed diabetes at baseline or the ten-year occurrence of myocardial infarction, stroke, or CV death was then tested on the remaining half of the simulated Danish population cross-section, as well as the population cross-sections of the remaining five countries, and the results are shown in Table 2. Further details on the creation and validation of the generic risk test are provided in File S1. Our use of this virtual, generic diabetes and CVD risk test is intended to show what might be achieved with risk test based pre-screening strategies. A real-world program would use a real-world risk test, with similar sensitivity and specificity, evaluated on data provided by the individual (like FINDRISC [26]), or from data in general practice databases (like the Cambridge diabetes risk score [27]).
Based on expert opinion, we assumed that 50% of patients would adhere to treatments triggered by the health check. We
Table 5.Baseline characteristics of the individuals eligible for the health check.
Characteristic Denmark France Germany Italy Poland UK
N 25000 24730 25000 25000 25000 24999
Age 53.3 54.3 54.5 54.6 54.6 54.2
Male sex 0.47 0.49 0.46 0.48 0.48 0.47
Blood Pressure (mmHg)
Systolic 127 127 136 137 140 131
Diastolic 76 79 84 83 80 77
Total cholesterol (mmol/l) 5.46 5.66 5.66 5.59 5.53 5.66
HDL (mmol/l) 1.47 1.45 1.60 1.42 1.50 1.47
LDL (mmol/l) 3.28 3.52 3.54 3.47 3.34 3.44
Triglycerides (mmol/l) 1.52 1.55 1.15 1.54 1.57 1.59
HbA1c (%) 5.30 5.24 5.28 5.24 5.20 5.30
BMI (kg/m2) 25.9 25.9 26.9 26.9 27.0 27.3
Current smoker 0.21 0.28 0.24 0.24 0.25 0.21
Diagnoses*
High-risk dyslipidemia{ 0.07 0.09 0.05 0.08 0.09 0.07
Hypertension 0.26 0.26 0.28 0.22 0.34 0.26
Medication Use
Anti-hypertensive 0.18 0.22 0.12 0.16 0.24 0.16
Statin 0.04 0.05 0.03 0.06 0.06 0.02
Individuals meeting pre-screening criteria
Age$50 years 58% 62% 61% 61% 66% 60%
BMI 30 kg/m2 or greater 11% 17% 21% 21% 26% 23%
Top quartile of risk 25% 25% 25% 25% 25% 25%
Above median of risk 50% 50% 50% 50% 50% 50%
Eligibility criteria were ages 40 to 75 years and no prior diagnosis of vascular disease.
*The baseline prevalence of MI, stroke, diabetes, stage 3 CKD or higher, and ESRD was zero because of the inclusion/exclusion criteria. {High-risk according to the ATP-III guideline.21–22
conservatively assumed that patients who had previously not adhered to prescribed treatments would remain non-adherent to care prescribed by the health check. For intensive lifestyle advice, we assumed that 50% of patients referred would maintain a 3% weight loss for life, based on trials of commercial programs [28,29]. We assumed that 10.5% of smokers who received smoking cessation interventions would successfully quit, and that the cost would be £224 per successful quitter, based on studies from the UK [30,31], rescaled according to the relative cost of care in each country. Finally, we did not attribute a cost to the evaluation of the generic risk test because the cost is currently unknown. The cost of the test will vary depending on the implementation chosen (e.g. the generic risk test might be performed through mailed forms, web-based forms, or general practice database analyses).
Study outcomes and statistical analyses
Simulated individuals were followed for 30 years or until death. We tracked the effect of health checks on the incidence of diagnoses of type 2 diabetes, major adverse cardiovascular events (MACE, first occurrence of myocardial infarction, stroke, or cardiovascular death), and a composite of serious microvascular
complications (first occurrence of diabetes related blindness, CKD, end stage renal disease, renal death, foot ulcer, or foot amputation). We computed the number needed to screen (NNS) in order to prevent one additional event using the Kaplan-Meier survival curves [32].
Direct medical costs were considered from a governmental payer perspective, adjusted to 2011 amounts, and reported in euros. Country-specific data on medical test, treatment, and health care delivery costs were used to estimate the direct medical costs associated with vascular disease in each country. In instances where specific data were unavailable, we used rescaled Medicare costs. We calculated QALYs based on the time individuals spent with different disorders using published disutilities [33,34]. Table 3 shows the disutilities, and Table 4 shows the costs of visits, tests, and treatments used. Costs and QALYs were discounted at an annual rate of 3%. Variations and uncertainty about costs, disutilities, and discount rates were studied through sensitivity analyses. Outcomes were considered significant for p,0?05.
Results
The baseline characteristics of the six simulated study cohorts are reported in Table 5. The rates of type 2 diabetes, MACE, and
Table 6.Expected number of events in the control per 1000 individuals screened after 30 years of follow-up, by participant subgroup.
Participants identified in pre-screening strategies
Country/Diagnosis
All participants
(Base-case) Age$50 years BMI$30 kg/m2 Above median risk Top quartile of risk Denmark
Diabetes* 113.8 (94.2–133.5) 110.3 (90.9–129.8) 366.9 (337.0–396.8) 165.7 (142.6–188.7) 207.7 (182.5–232.8)
MACE{ 264.0 (236.7–291.3) 311.8 (283.1–340.5) 379.6 (349.6–409.7) 338.7 (309.4–368.1) 376.5 (346.5–406.5) Microvascular Composite` 209.6 (184.4–234.9) 253.4 (226.4–280.3) 274.9 (247.2–302.6) 235.8 (209.5–262.1) 266.9 (239.5–294.3) France
Diabetes 88.5 (70.9–106.1) 84.0 (66.8–101.2) 263.2 (235.9–290.5) 130.9 (110.0–151.9) 164.6 (141.6–187.5) MACE 232.1 (206.0–258.3) 263.1 (235.9–290.4) 287.6 (259.6–315.7) 280.5 (252.6–308.3) 303.0 (274.6–331.5) Microvascular Composite 178.8 (155.0–202.5) 210.1 (184.9–235.4) 150.1 (128.0–172.2) 184.9 (160.8–208.9) 195.4 (170.8–219.9) Italy
Diabetes 127.1 (106.4–147.7) 112.4 (92.8–131.9) 312.7 (284.0–341.4) 175.8 (152.2–199.4) 221.8 (196.1–247.6) MACE 286.8 (258.8–314.9) 321.6 (292.6–350.5) 324.9 (295.9–353.9) 343.0 (313.6–372.5) 362.1 (332.3–391.9) Microvascular Composite 195.4 (170.9–220.0) 228.6 (202.6–254.6) 170.5 (147.2–193.9) 213.0 (187.6–238.3) 224.6 (198.8–250.5) Germany
Diabetes 155.5 (133.1–178.0) 132.8 (111.8–153.8) 383.2 (353.1–413.4) 228.0 (202.0–254.0) 265.3 (237.9–292.6) MACE 329.3 (300.2–358.4) 371.3 (341.4–401.3) 417.3 (386.7–447.9) 407.0 (376.5–437.4) 440.0 (409.2–470.8) Microvascular Composite 229.8 (203.7–255.8) 263.5 (236.2–290.8) 247.9 (221.2–274.7) 263.0 (235.7–290.2) 287.0 (259.0–315.1) Poland
Diabetes 143.3 (121.5–165.0) 126.0 (105.4–146.6) 336.9 (307.6–366.2) 209.9 (184.7–235.2) 261.8 (234.6–289.0) MACE 315.8 (287.0–344.7) 351.6 (322.0–381.2) 347.3 (317.8–376.8) 378.2 (348.2–408.3) 397.0 (366.6–427.3) Microvascular Composite 212.0 (186.7–237.3) 237.1 (210.7–263.5) 182.6 (158.7–206.6) 224.9 (199.0–250.8) 240.3 (213.8–266.8) UK
Diabetes 115.1 (95.3–134.9) 105.8 (86.7–124.8) 277.1 (249.4–304.8) 167.0 (143.9–190.2) 204.2 (179.2–229.1) MACE 309.8 (281.1–338.4) 349.8 (320.3–379.4) 390.4 (360.2–420.7) 377.4 (347.3–407.4) 410.6 (380.1–441.1) Microvascular Composite 197.6 (172.9–222.2) 232.3 (206.1–258.4) 210.1 (184.9–235.4) 222.0 (196.2–247.8) 245.1 (218.5–271.8)
*Diagnosis of type 2 diabetes.
{MACE is a composite of the first occurrence of: MI, stroke, or CV death.
`
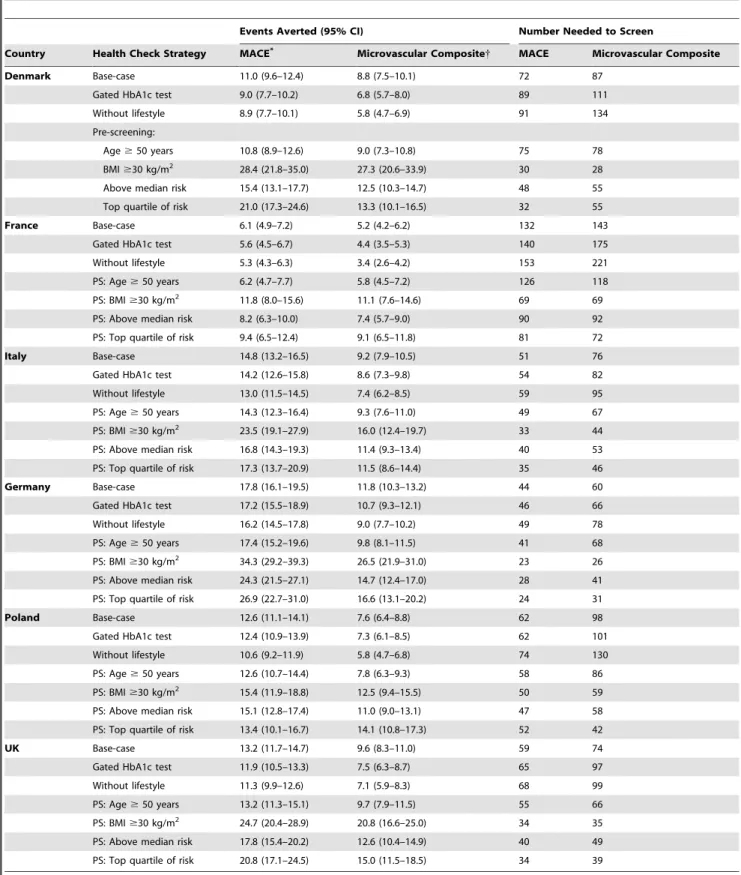
Table 7.Expected number of events prevented by each screening strategy compared with control, per 1000 individuals screened, after 30 years of follow-up.
Events Averted (95% CI) Number Needed to Screen
Country Health Check Strategy MACE* Microvascular Composite{ MACE Microvascular Composite
Denmark Base-case 11.0 (9.6–12.4) 8.8 (7.5–10.1) 72 87
Gated HbA1c test 9.0 (7.7–10.2) 6.8 (5.7–8.0) 89 111
Without lifestyle 8.9 (7.7–10.1) 5.8 (4.7–6.9) 91 134
Pre-screening:
Age$50 years 10.8 (8.9–12.6) 9.0 (7.3–10.8) 75 78
BMI$30 kg/m2 28.4 (21.8–35.0) 27.3 (20.6–33.9) 30 28
Above median risk 15.4 (13.1–17.7) 12.5 (10.3–14.7) 48 55
Top quartile of risk 21.0 (17.3–24.6) 13.3 (10.1–16.5) 32 55
France Base-case 6.1 (4.9–7.2) 5.2 (4.2–6.2) 132 143
Gated HbA1c test 5.6 (4.5–6.7) 4.4 (3.5–5.3) 140 175
Without lifestyle 5.3 (4.3–6.3) 3.4 (2.6–4.2) 153 221
PS: Age$50 years 6.2 (4.7–7.7) 5.8 (4.5–7.2) 126 118
PS: BMI$30 kg/m2 11.8 (8.0–15.6) 11.1 (7.6–14.6) 69 69
PS: Above median risk 8.2 (6.3–10.0) 7.4 (5.7–9.0) 90 92
PS: Top quartile of risk 9.4 (6.5–12.4) 9.1 (6.5–11.8) 81 72
Italy Base-case 14.8 (13.2–16.5) 9.2 (7.9–10.5) 51 76
Gated HbA1c test 14.2 (12.6–15.8) 8.6 (7.3–9.8) 54 82
Without lifestyle 13.0 (11.5–14.5) 7.4 (6.2–8.5) 59 95
PS: Age$50 years 14.3 (12.3–16.4) 9.3 (7.6–11.0) 49 67
PS: BMI$30 kg/m2 23.5 (19.1–27.9) 16.0 (12.4–19.7) 33 44
PS: Above median risk 16.8 (14.3–19.3) 11.4 (9.3–13.4) 40 53
PS: Top quartile of risk 17.3 (13.7–20.9) 11.5 (8.6–14.4) 35 46
Germany Base-case 17.8 (16.1–19.5) 11.8 (10.3–13.2) 44 60
Gated HbA1c test 17.2 (15.5–18.9) 10.7 (9.3–12.1) 46 66
Without lifestyle 16.2 (14.5–17.8) 9.0 (7.7–10.2) 49 78
PS: Age$50 years 17.4 (15.2–19.6) 9.8 (8.1–11.5) 41 68
PS: BMI$30 kg/m2 34.3 (29.2–39.3) 26.5 (21.9–31.0) 23 26
PS: Above median risk 24.3 (21.5–27.1) 14.7 (12.4–17.0) 28 41
PS: Top quartile of risk 26.9 (22.7–31.0) 16.6 (13.1–20.2) 24 31
Poland Base-case 12.6 (11.1–14.1) 7.6 (6.4–8.8) 62 98
Gated HbA1c test 12.4 (10.9–13.9) 7.3 (6.1–8.5) 62 101
Without lifestyle 10.6 (9.2–11.9) 5.8 (4.7–6.8) 74 130
PS: Age$50 years 12.6 (10.7–14.4) 7.8 (6.3–9.3) 58 86
PS: BMI$30 kg/m2 15.4 (11.9–18.8) 12.5 (9.4–15.5) 50 59
PS: Above median risk 15.1 (12.8–17.4) 11.0 (9.0–13.1) 47 58
PS: Top quartile of risk 13.4 (10.1–16.7) 14.1 (10.8–17.3) 52 42
UK Base-case 13.2 (11.7–14.7) 9.6 (8.3–11.0) 59 74
Gated HbA1c test 11.9 (10.5–13.3) 7.5 (6.3–8.7) 65 97
Without lifestyle 11.3 (9.9–12.6) 7.1 (5.9–8.3) 68 99
PS: Age$50 years 13.2 (11.3–15.1) 9.7 (7.9–11.5) 55 66
PS: BMI$30 kg/m2 24.7 (20.4–28.9) 20.8 (16.6–25.0) 34 35
PS: Above median risk 17.8 (15.4–20.2) 12.6 (10.4–14.9) 40 49
PS: Top quartile of risk 20.8 (17.1–24.5) 15.0 (11.5–18.5) 34 39
The number needed to screen to prevent one event at 30 years is also listed. In all strategies, the number of events averted was significant, with p,0?0001. See Table 1 for definitions of the screening strategies.
*MACE is a composite of the first occurrence of: MI, stroke, or CV death. {
Microvascular composite outcome is the first occurrence of blindness, CKD or higher, ESRD, renal death, foot ulcer, or amputation. PS = Pre-screening.
microvascular complications in the control (e.g. current care with no health checks) are shown in Table 6. At 30 years, all of the health check scenarios reduced the incidence MACE and microvascular complications relative to control (p,0?0001), as shown in Table 7.
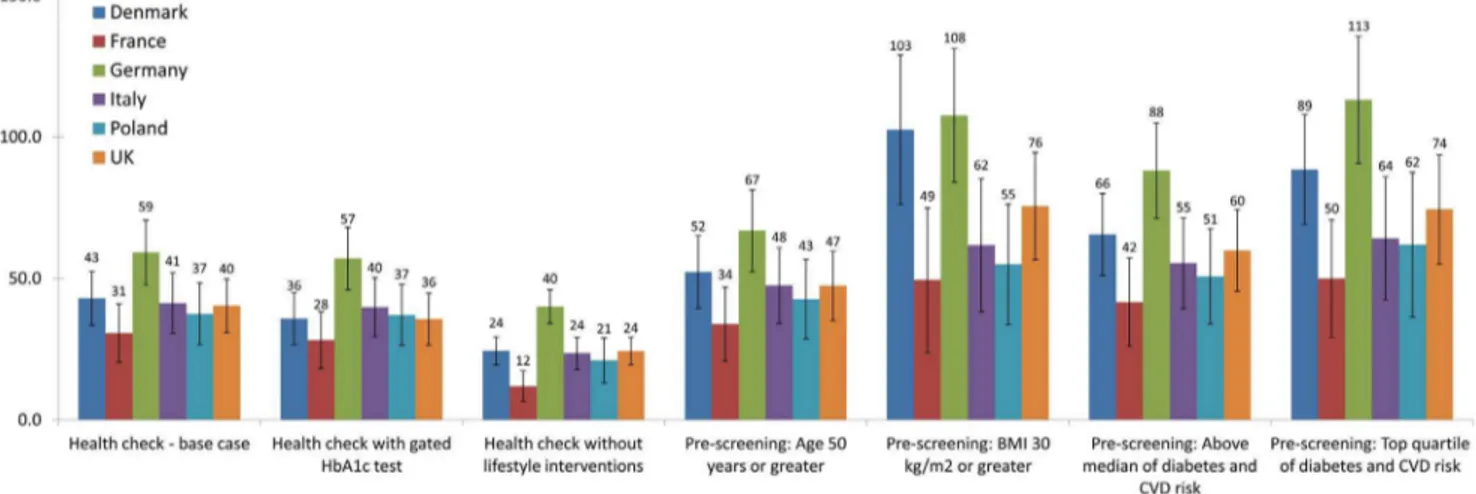
The base-case health check added significant QALYs in all countries at 30 years (Figure 1, p,0?0001). The gated HbA1c test health check strategy provided a similar QALY gain to the
base-case, while the strategy omitting lifestyle interventions provided substantially fewer QALYs. Each of the pre-screening scenarios provided a greater QALY gain than the base-case on a per-screened individual basis. Plots of discounted total medical costs vs. QALYs gained for each country are shown in Figure 2. The discounted cost per QALY for the strategies at 30 years, in each country, is shown in Table 8.
Figure 1. QALYs gained at 30 years per 1000 individuals offered a health check.PS = Pre-screening. doi:10.1371/journal.pone.0066454.g001
Figure 2. Total medical costs versus QALYs gained at 30 years (discounted) per 1000 individuals screened.
Table 9 shows the sensitivity of the cost per QALY estimates to variations in key assumptions. Across the sensitivity analyses, our results were fairly insensitive to variations in the assumptions. The cost per QALY was most sensitive to the addition of a disutility associated with the diagnosis of type 2 diabetes, which caused the cost per QALY to increase by 124% in UK and 71% in Denmark. A primary effect of the health check is to diagnose more individuals living with undiagnosed diabetes, so it follows that the QALYs gained from health checks would be sensitive to assumptions about the quality of life with diagnosed vs. undiagnosed diabetes.
Discussion
Our study shows that offering health checks would likely reduce the 30-year incidence of both MACE and serious microvascular complications. Under the most comprehensive strategy (base-case),
the number needed to screen (NNS) to prevent one instance of MACE ranged from 44 in Germany to 132 in France, and the figures were similar for microvascular complications. The NNS values were lower in the higher risk populations identified by pre-screening, corresponding to the higher control scenario event rates.
The 30-year QALY benefit of the base-case was smallest in France (31 QALYs gained per 1000 people), and largest in Germany (59 QALYs gained). The base-case health check had a cost per QALY of J14903 (in France) or less (cost saving in
Poland). Variations in cost effectiveness across the countries were driven primarily by the burden of disease (lowest in France and highest in Germany, as shown in Table 6), and the costs of treatments and medical care. For example, Denmark had the second highest base-case cost per QALY in spite of a relatively high disease burden and low treatment costs, largely due to a high outpatient visit cost (as evidenced by the sensitivity to screening
Table 8.Base-case estimates for the cost per quality-adjusted life-year (QALY) gained by offering health checks (discounted), compared with control after 30 years of follow-up.
Denmark France Germany Italy Poland UK
Base-case health check 11595 14903 115 11113 Cost saving 2426
Without lifestyle 21694 26323 3593 13733 326 6684
Gated HbA1c test 9981 11825 Cost saving 10344 Cost saving 1577
PS: Age$50 years 7350 12194 Cost saving 6482 Cost saving 887
PS: BMI$30 kg/m2 Cost saving 10200 Cost saving 9001 Cost saving Cost saving
PS: Top quartile of risk 1800 8549 Cost saving 4413 Cost saving Cost saving
PS: Above median risk 5214 10180 Cost saving 6752 Cost saving 48
Costs are reported in euros. PS = Pre-screening.
doi:10.1371/journal.pone.0066454.t008
Table 9.Sensitivity of cost per quality-adjusted life-year to different assumptions about quality of life with diagnosed diabetes, health check effectiveness, costs of screening, treatment costs, discount rates, and time horizon.
Denmark France Germany Italy Poland UK
Reference Health check – base-case, 30 years
11595 14903 115 11113 Cost Saving 2426
Assumptions
Including disutility associated with diabetes diagnosis*
19778 20760 158 13226 Cost Saving 5425
Effectiveness of the health check220%{
14030 16223 1086 12184 124 3525
Costs of screening+20% 13546 15951 906 11984 49 3332
Costs of screening220% 9644 13856 Cost Saving 10241 Cost Saving 1520
Treatment costs+20% 11972 17309 910 13956 Cost Saving 2602
Treatment costs220% 11217 12497 Cost Saving 8271 Cost Saving 2251
Discount rate 5% 15694 17978 1815 14697 343 1592
Discount rate 1% 8337 12353 Cost Saving 8218 Cost Saving 849
Time horizon
10 years 126912 67432 36665 107144 12552 49731
20 years 27369 26148 6330 26930 1559 10407
40 years 7582 10641 Cost Saving 7197 Cost Saving 829
*The disutility for type 2 diabetes was assumed to be20?0351 [33].
costs). Poland had high disease burden, and low screening and treatments costs, rendering the base-case cost saving at 30 years. While the cost per QALY does vary country-to-country, the cost effectiveness conclusions are consistent in that the base-case health check would be cost-effective in all six countries examined.
Offering all individuals a health check, but restricting diabetes risk assessments to obese and/or hypertensive individuals reduced the cost per QALY byJ3079 (in France) or less. Such a strategy
may have a larger impact on costs if the more expensive OGTT test were used to assess diabetes risk, as in the NHS Health Check in the UK. However, in the present study the lipid assessment required a blood draw for each individual receiving the health check, and thus the incremental cost of an HbA1c test was modest. This result underscores the advantages of using HbA1c for diabetes risk screening, especially in situations where multiple tests can be performed on a single blood draw.
The opportunity for the health check to address modifiable risk factors through lifestyle measures is clear from our study cohort. At baseline, between 28% (France) and 21% (Denmark and UK) of the health check populations were smokers, and the obesity rate ranged from 26% in Poland to 11% in Denmark. Including lifestyle interventions reduced the cost per QALY by as much as 11420J/QALY in France, as evidenced by comparing the
base-case to the strategy without lifestyle interventions. We modeled intensive lifestyle advice and smoking cessation based on commercial and national programs in the UK. Therefore, our findings underscore the importance of prioritizing lifestyle and prevention measures, while recognizing the challenge they present for patients.
The pre-screening strategies explore ways that policy makers could reduce the total budget impact of launching a health check program across Europe. Of the pre-screening strategies consid-ered, starting health checks at age 50, rather than 40, provided the least health benefit, per person screened (shown in Figure 1). Pre-screening on the basis of obesity had much greater benefit, adding between 49 (in France) and 108 QALYs (in Germany), per 1000 people at 30 years. All four pre-screening strategies had a lower Cost/QALY than the base-case, with the obesity-based prescreen-ing havprescreen-ing a Cost/QALY rangprescreen-ing fromJ10200 (France) to cost
saving in Denmark, Germany, Poland, and the UK. Risk test based pre-screening provided similar benefit. Comparing the control scenario rates of diabetes diagnosis and MACE (Table 6) shows that obesity based pre-screening more strongly selected for diabetes, and our virtual risk test more strongly selected for MACE. Correspondingly, the obesity-based prescreening had a higher Cost/QALY in countries with higher anti-diabetic treat-ment costs (France and Italy) and lower Cost/QALY in countries with low treatment costs and higher disease burden (Germany, Poland).
Our study is unique in its European scope, exploring the health benefits and costs of seven health check strategies to six distinct European populations, while a prior analysis examined the health check in a UK setting only [10]. Our examination of a multifaceted health check intervention represents a more integrat-ed approach to addressing vascular disease than prior studies of screening for a single disorder [11,12]. Our modeling approach also allowed us to examine the benefit a health check recurring every five years, whereas prior studies considered a one-time screenings [12]. This study provides health care decision makers with a realistic pan-European view of strategies for managing vascular disease that are likely to be cost-effective over the next three decades.
These results must be considered along with the limitations of the analysis. This study used the Archimedes Model to forecast
Despite these limitations, this study provides a realistic estimate of the likely benefits and costs of health checks in six European populations. We have modeled the settings unique to these six countries in detail, and employed the Archimedes Model to provide 30-year cost effectiveness estimates. Through trial validations, the Archimedes Model has been demonstrated to predict the effects of the screening, prevention, and management actions addressed by the health check.
Our study shows that a health check assessing diabetes, hypertension, lipids and smoking would likely be cost effective in all of the countries considered, Denmark, France, Italy, Germany, Poland, and the UK. Pre-screening strategies would likely improve the cost effectiveness and minimize the total budget impact of a health checks program, while still providing meaningful improve-ments in health.
Supporting Information
File S1 Description of the data sources used in the modeling. Figure S1,Receiver operating characteristic (ROC) curves showing the discrimination of the generic risk test on each simulated population. Table S1, Characteristics for Denmark population (aged 20–85, unless specified otherwise). Table S2,
Characteristics for Denmark subpopulations.Table S3, Charac-teristics for France population (aged 20–85, unless specified otherwise).Table S4,Characteristics for France subpopulations.
Table S5,Characteristics for Germany population (aged 20–85, unless specified otherwise). Table S6, Characteristics for Ger-many subpopulations. Table S7,Characteristics for Italy popu-lation (aged 20–85, unless specified otherwise). Table S8,
Characteristics for Italy subpopulations.Table S9, Characteris-tics for Poland population (aged 20–85, unless specified otherwise).
Table S10, Characteristics for Poland subpopulations.
Ta-ble S11,Characteristics for UK population (aged 20–85, unless specified otherwise).Table S12,Characteristics for UK subpop-ulations. Table S13, Cost assumptions used for Denmark.
Table S14,Cost assumptions used for France. TableS15,Cost assumptions used for Germany. Table S16, Cost assumptions used for Italy. TableS17, Cost assumptions used for Poland.
Table S18,Cost assumptions used for the United Kingdom. (DOCX)
File S2 Description of the model structure.
(PDF)
File S3 Description of the model calibration.
(PDF)
File S4 Description of the model validation.
(PDF)
Acknowledgments
We thank Niels Lund, Pavika Jain, Kenny Shum and Stefanie Renard for their invaluable help with this study. The findings and conclusions in this report are those of the authors and do not necessarily represent the official position of the institutions in which they work.
Author Contributions
Conceived and designed the experiments: CAS PA SG AvH BC DE JG AN PS NW DW US. Performed the experiments: CAS PA SG AvH BC DE JG AN PS NW DW US. Analyzed the data: CAS PA SG AvH BC DE JG AN PS NW DW US. Contributed reagents/materials/analysis tools: CAS PA SG AvH. Wrote the paper: CAS PA SG AvH BC DE JG AN PS NW DW US.
References
1. World Health Organization (2004) The atlas of heart disease and stroke. World Health Organization. Available: http://www.who.int/cardiovascular_diseases/ resources/atlas/en/. Accessed 2012 Nov 13.
2. Kanavos P, van den Aardweg S, Schurer W (2012) Diabetes expenditure, burden of disease and management in 5 EU countries. LSE Health, London School of Economics.
3. Anand SS, Yusuf S (2011) Stemming the global tsunami of cardiovascular disease. Lancet 377: 529–532.
4. Spijkerman AM, Dekker JM, Nijpels G, Adriaanse MC, Kostense PJ, et al. (2003) Microvascular complications at time of diagnosis of type 2 diabetes are similar among diabetic patients detected by targeted screening and patients newly diagnosed in general practice: the hoorn screening study. Diabetes Care 26: 2604–2608.
5. Schwarz PE, Greaves CJ, Lindstrom J, Yates T, Davies MJ (2012) Nonpharmacological interventions for the prevention of type 2 diabetes mellitus. Nat Rev Endocrinol 8:363–373.
6. Lewington S, Clarke R, Qizilbash N, Peto R, Collins R (2002) Age-specific relevance of usual blood pressure to vascular mortality: a meta-analysis of individual data for one million adults in 61 prospective studies. The Lancet 360: 1903–1913.
7. Lewington S, Whitlock G, Clarke R, Sherliker P, Emberson J, et al. (2007) Blood cholesterol and vascular mortality by age, sex, and blood pressure: a meta-analysis of individual data from 61 prospective studies with 55,000 vascular deaths. The Lancet 370: 1829–1839.
8. Davies M, Khunti K, Chauhan U, Stribling B, Goyder E, et al. (2008) The handbook for vascular risk assessment, risk reduction and risk management. UK National Screening Committee. Leicester: BMJ Publishing Group.
9. NHS Health Check Programme (2009) Putting Prevention First – NHS Health Check: Vascular Risk Assessment and Management Best Practice Guidance. London:Department of Health.
10. Department of Health (2008) Economic Modelling for Vascular Checks. In: Health Do, editor. London: Department of Health.
11. Kahn R, Alperin P, Eddy D, Borch-Johnsen K, Buse J, et al. (2010) Age at initiation and frequency of screening to detect type 2 diabetes: a cost-effectiveness analysis. Lancet 375: 1365–1374.
12. Gillies CL, Lambert PC, Abrams KR, Sutton AJ, Cooper NJ, et al. (2008) Different strategies for screening and prevention of type 2 diabetes in adults: cost effectiveness analysis. BMJ (Clinical research ed) 336: 1180–1185.
13. Eddy DM, Schlessinger L (2003) Archimedes: a trial-validated model of diabetes. Diabetes Care 26: 3093–3101.
14. Eddy DM, Schlessinger L, Kahn R (2005) Clinical outcomes and cost-effectiveness of strategies for managing people at high risk for diabetes. Ann Intern Med 143: 251–264.
15. Archimedes model web site. Available: www.archimedesmodel.com. Accessed 2012 Nov 13.
16. Eddy DM, Schlessinger L (2003) Validation of the archimedes diabetes model. Diabetes Care 26: 3102–3110.
17. Mount Hood 4 Modeling Group (2007) Computer modeling of diabetes and its complications: a report on the Fourth Mount Hood Challenge Meeting. Diabetes Care 30: 1638–1646.
18. Colhoun HM, Betteridge DJ, Durrington PN, Hitman GA, Neil HA, et al. (2004) Primary prevention of cardiovascular disease with atorvastatin in type 2 diabetes in the Collaborative Atorvastatin Diabetes Study (CARDS): multicentre randomised placebo-controlled trial. Lancet 364: 685–696.
19. Centers for Disease Control and Prevention (CDC), National Center for Health Statistics (NCHS). National Health and Nutrition Examination Survey Data 1999–2008. Available: http://www.cdc.gov/nchs/nhanes.htm. Accessed 2012 Nov 13.
20. International Expert Committee (2009) International Expert Committee report on the role of the A1C assay in the diagnosis of diabetes. Diabetes Care 32: 1327–1334.
21. American Diabetes Association (2011) Diagnosis and classification of diabetes mellitus. Diabetes Care 34 Suppl 1: S62–69.
22. Nathan DM, Buse JB, Davidson MB, Ferrannini E, Holman RR, et al. (2009) Medical management of hyperglycemia in type 2 diabetes: a consensus algorithm for the initiation and adjustment of therapy: a consensus statement of the American Diabetes Association and the European Association for the Study of Diabetes. Diabetes Care 32: 193–203.
23. Joint National Committee on Prevention D, Evaluation, and Treatment of High Blood Pressure (2003) JNC 7 Express: The Seventh Report of the Joint National Committee on Prevention, Detection, Evaluation, and Treatment of High Blood Pressure. In: National Institutes of Health N, editor. NIH Publication, US Department of Health and Human Services.
Evaluation, And Treatment of High Blood Cholesterol In Adults (Adult Treatment Panel III). JAMA 285: 2486–2497.
25. Grundy SM, Cleeman JI, Merz CN, Brewer HB Jr, Clark LT, et al. (2004) Implications of recent clinical trials for the National Cholesterol Education Program Adult Treatment Panel III guidelines. Circulation 110: 227–239. 26. Lindstrom J, Tuomilehto J (2003) The diabetes risk score: a practical tool to
predict type 2 diabetes risk. Diabetes Care 26: 725–731.
27. Rahman M, Simmons RK, Harding AH, Wareham NJ, Griffin SJ (2008) A simple risk score identifies individuals at high risk of developing Type 2 diabetes: a prospective cohort study. Family Practice 25: 191–196.
28. Tsai AG, Wadden TA (2005) Systematic Review: An Evaluation of Major Commercial Weight Loss Programs in the United States. Annals of Internal Medicine 142: 56–66.
29. Jebb SA, Ahern AL, Olson AD, Aston LM, Holzapfel C, et al. (2011) Primary care referral to a commercial provider for weight loss treatment versus standard care: a randomised controlled trial. Lancet 378: 1485–1492.
30. Lader D (2007) Omnibus Survey Report No. 32: Smoking-related Behaviour and Attitudes, 2006. Newport: Office for National Statistics. 16 p.
31. Ferguson J, Bauld L, Chesterman J, Judge K (2005) The English smoking treatment services: one-year outcomes. Addiction 100 Suppl 2: 59–69. 32. Altman DG, Andersen PK (1999) Calculating the number needed to treat for
trials where the outcome is time to an event. BMJ 319: 1492–1495. 33. Sullivan PW, Ghushchyan V (2006) Preference-Based EQ-5D index scores for
chronic conditions in the United States. Medical decision making : an international journal of the Society for Medical Decision Making 26: 410–420. 34. Coffey JT, Brandle M, Zhou H,Marriott D, Burke R, et al. (2002) Valuing
health-related quality of life in diabetes. Diabetes Care 25: 2238–2243. 35. The Danish Diabetes Association website (nd) Treatment goals. Available: