Compressive Strength, Microstructure and Hydration Products of Hybrid Alkaline Cements
Zahra Abdollahnejada, Petr Hlavacekb, Sergio Miraldoa, Fernando Pacheco-Torgala*,
José Luís Barroso de Aguiarc
aC-TAC Research Centre, University of Minho, Guimarães, Portugal bCzech Technical University in Prague, Prague, Czech Republic cDepartment of Civil Engineering, University of Minho, Guimarães, Portugal
Received: September 1, 2013; Revised: April 8, 2014
Ordinary Portland cement (OPC) is the dominant binder in the construction industry with a global production that currently reaches a total of 3 Gt per year. As a consequence, the cement industry’s contribution to the total worldwide CO2 emissions is of about 7% of the total emissions. Publications on the field of alkali-activated binders (also termed geopolymers), state that this new material is, potentially, likely to become an alternative to Portland cement. However, recent LCA studies show that the environmental performance of alkali-activated binders depends, to great extent, of their composition. Also, researchers report that these binders can be produced in a more eco-efficient manner if the use of sodium silicate is avoided. This is due to the fact that the referred component is associated to a high carbon footprint. Besides, most alkali-activated cements suffer from severe efflorescence, a reaction originated by the fact that the alkaline and/or soluble silicates that are added during processing cannot be totally consumed. This paper presents experimental results on hybrid alkaline cements. The compressive strength results and the efflorescence observations show that some of the new mixes already exhibit a promising performance.
Keywords: hybrid alkaline cements, compressive strength, efflorescences, microstructure
1. Introduction
Ordinary Portland cement (OPC) is the dominant binder in the construction industry with an annual production of almost 3 Gt1. Additionally, the production of one tonne of
OPC generates 0.55 tonnes of chemical CO2 and requires an additional 0.39 tonnes of CO2 in fuel emissions for the baking and grinding activities, resulting in a total of 0.94 tonnes of CO2. In 2000, the cement industry emitted, on average, 0.87 kg of CO2 for every 1 kg of cement produced2. As a consequence, this industry contributes to
about 7% of the total worldwide CO2 emissions3. It is also
expected that the global demand of OPC will have a twofold increase by the year 2050, reaching a total of 6 Gt/year. The urge to reduce carbon dioxide emissions, and also, the fact that OPC structures built a few decades ago are still facing disintegration problems points out the handicaps of OPC. Additionally, Portland cement based concrete presents higher permeability, allowing water and other aggressive media to enter, further leading to carbonation and corrosion issues. The early deterioration of reinforced concrete structures based on OPC is a current phenomenon of significant consequences, both in terms of the cost for the rehabilitation of these structures and as a result of the environmental impacts associated with these operations. Investigations4-8 carried out so far in the development of
alkali activated binders (also termed geopolymers) showed that much has already been investigated, and also, that
an environmentally friendly alternative to OPC is rising. According to Davidovits9, geopolymer production generates
just 0.184 tons of CO2 per ton of binder. These findings, however, were not confirmed by Duxson et al.10. These
authors stated that, although the CO2 emissions generated during the production of Na2O are very high, the production of geopolymers is still associated with a level of carbon dioxide emissions lower than the emissions generated in the production of OPC. Meanwhile, an independent study made by Zeobond Pty LtD concluded that the former was responsible for 80% lower CO2 emissions11. Weil et al.12
compared Portland cement concrete to geopolymeric concrete possessing similar durability reporting that the latter implies 70% lower CO2 emissions, all of which confirming the aforementioned reductions. McLellan et al.13,
in turn, reported a 44 to 64 % reduction in greenhouse gas emissions of geopolymers when compared to OPC. Habert et al.14 confirmed that they are responsible for
lower impacts on global warming when compared to OPC but, on the other hand, demonstrate higher environmental impacts regarding other impact categories. Lower CO2 emissions geopolymers are therefore needed. Nevertheless, the durability of geopolymers is still the subject of some controversy15. In fact, in his research, Duxson et al.10 stated
that this is the most important issue when determining the success of these new materials. Other authors16, mentioned
excess of 30 years, show little degradation, means that geopolymers do therefore appear to stand the test of time. However, since those materials were of the (Si+Ca) type, that conclusion cannot be extended to geopolymers, defined as an “alkali aluminosilicate gel, with aluminium and silicon linked in a tetrahedral gel framework”11. On the
other hand, Juenger et al.1 argue that “The key unsolved
question in the development and application of alkali activation technology is the issue of durability”, and more recently, Van Deventer et al.17 recognized that “whether
geopolymer concretes are durable remains the major
obstacle to recognition in standards for structural concrete”. Efflorescences are an important drawback of two part geopolymers and, so far, have received very little attention. According to Skvara et al.18,19, the bond between the sodium
ions (Na+) and the aluminosilicate structure is weak, thus
explaining the leaching behaviour. Kani et al.20 showed
that efflorescences can be reduced either by the addition of alumina-rich admixtures or by hydrothermal curing at temperatures of 65 °C or higher. These authors found that the use of 8% of calcium aluminate cement greatly reduces the mobility of alkalis and leads to minimum efflorescences (this
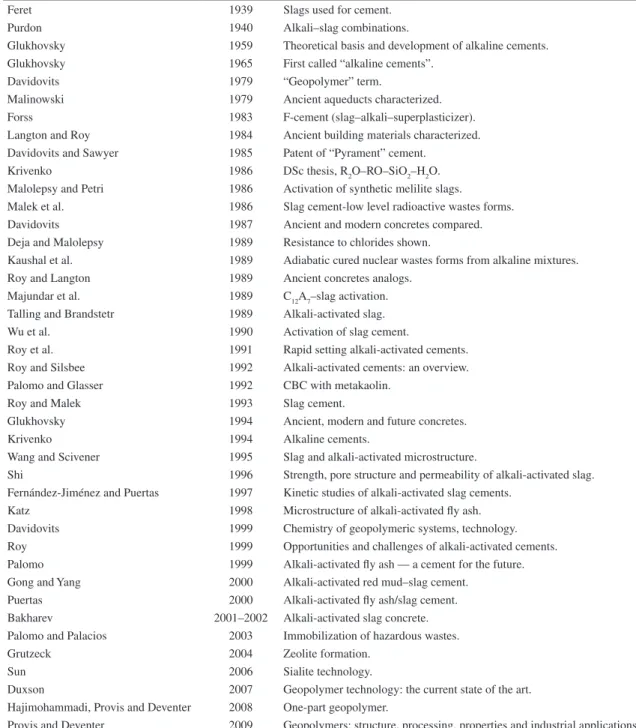
Table 1. Bibliographic history of some important alkali-activated cement/geopolymer related events6.
Feret 1939 Slags used for cement.
Purdon 1940 Alkali–slag combinations.
Glukhovsky 1959 Theoretical basis and development of alkaline cements. Glukhovsky 1965 First called “alkaline cements”.
Davidovits 1979 “Geopolymer” term.
Malinowski 1979 Ancient aqueducts characterized. Forss 1983 F-cement (slag–alkali–superplasticizer). Langton and Roy 1984 Ancient building materials characterized. Davidovits and Sawyer 1985 Patent of “Pyrament” cement.
Krivenko 1986 DSc thesis, R2O–RO–SiO2–H2O. Malolepsy and Petri 1986 Activation of synthetic melilite slags.
Malek et al. 1986 Slag cement-low level radioactive wastes forms. Davidovits 1987 Ancient and modern concretes compared. Deja and Malolepsy 1989 Resistance to chlorides shown.
Kaushal et al. 1989 Adiabatic cured nuclear wastes forms from alkaline mixtures. Roy and Langton 1989 Ancient concretes analogs.
Majundar et al. 1989 C12A7–slag activation.
Talling and Brandstetr 1989 Alkali-activated slag. Wu et al. 1990 Activation of slag cement.
Roy et al. 1991 Rapid setting alkali-activated cements. Roy and Silsbee 1992 Alkali-activated cements: an overview. Palomo and Glasser 1992 CBC with metakaolin.
Roy and Malek 1993 Slag cement.
Glukhovsky 1994 Ancient, modern and future concretes.
Krivenko 1994 Alkaline cements.
Wang and Scivener 1995 Slag and alkali-activated microstructure.
Shi 1996 Strength, pore structure and permeability of alkali-activated slag. Fernández-Jiménez and Puertas 1997 Kinetic studies of alkali-activated slag cements.
Katz 1998 Microstructure of alkali-activated fly ash. Davidovits 1999 Chemistry of geopolymeric systems, technology. Roy 1999 Opportunities and challenges of alkali-activated cements. Palomo 1999 Alkali-activated fly ash — a cement for the future. Gong and Yang 2000 Alkali-activated red mud–slag cement.
Puertas 2000 Alkali-activated fly ash/slag cement. Bakharev 2001–2002 Alkali-activated slag concrete. Palomo and Palacios 2003 Immobilization of hazardous wastes.
Grutzeck 2004 Zeolite formation.
Sun 2006 Sialite technology.
Duxson 2007 Geopolymer technology: the current state of the art. Hajimohammadi, Provis and Deventer 2008 One-part geopolymer.
cement has 28% of CaO). These results are very important because they constitute a step back in the development of geopolymers. For one, the use of hydrothermal curing implies serious limitations for on-site concrete placement operations. Alternatively, the use of calcium based mixtures reduces the acid resistance and raises the chances of ASR occurrence. All of this means that this subject merits further investigations. In 2007 some authors21 disclosed
results on sodium silicate free geopolymers. However, their related mechanical performance around 1 MPa was simply too small for construction purposes. According to those authors an increase in the compressive strength to 4MPa would require 24 h hydrothermal treatment at 100 °C. The use of a much more intensive treatment (140 °C) would increase compressive strength to 12-20 MPa. However, such treatment conditions not only are difficult to implement in the construction industry but more important constitute a set back in terms of energy and carbon footprint when compared to traditional two part geopolymers. The discovery of one-part geopolymers is considered a key event on the evolution of geopolymer technology, having been described for the first time in 2008 (Table 1). These binders can also be termed as hybrid alkaline cements22,23. In this work, experimental
mechanical results (as well as SEM and FTIR observations on these mixtures) are presented (Appendix I). The mixtures under investigation were based on the ones described in the international patent authored by Zheng et al.24.
2. Experimental Work
2.1. Material
The composition of the dry mix in this study was: kaolin, fly ash, ordinary Portland cement (OPC), sodium hydroxide, calcium hydroxide (Ca(OH)2), water and superplasticizer. The OPC is of class I 42,5 R type, containing between 95% to 100% of clinker content, a specific weight of 3.15 g/cm3 and a Blaine fineness of 3842 cm2/g (Table 2).The
superplasticizer (SP) used was SIKA 3002 HE. The referred SP was used to maintain a uniform consistency throughout the different mixes. The chemical composition of the fly ash complies with the minimum requirements indicated in EN-450-1[25] for use as a partial replacement of cement in
concrete. Based on this standard, the fly ash was categorized as class B and group N for the loss of ignition and fineness, respectively. Also, the material in question has a specific weight of 2.42 g/cm3 and a chemical composition as shown
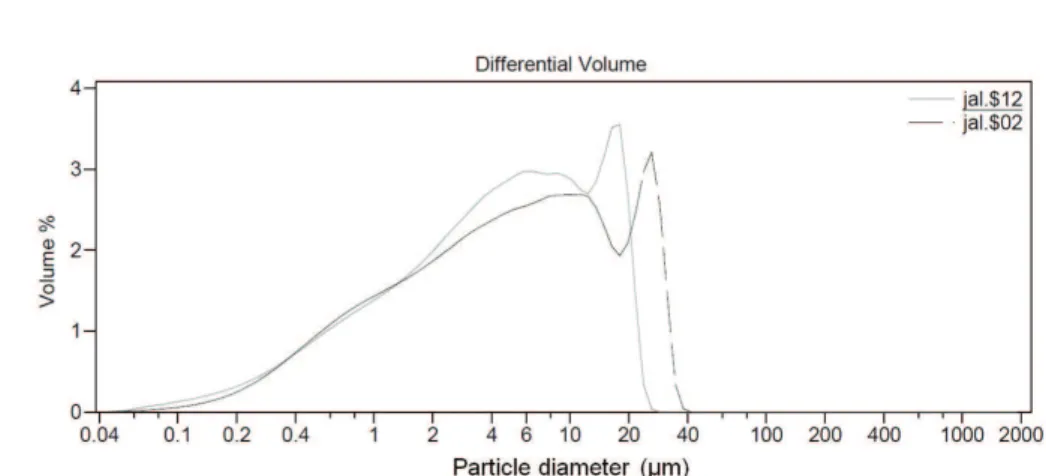
in Table 3.The kaolin has a BET surface area of 21 m2/g
and its particle size is shown in Figure 1, this is crucial information as this parameter influences the dehydroxylation temperature of kaolin. The DTA/TGA curves for kaolin are presented in Figure 2. A well-defined endothermic DTA peak and sharp weight loss in the TGA curve appears between 550 °C and 600 °C. This loss results from the transition to the amorphous and more reactive metakaolin phase.
Table 2. Chemical composition of the Portland cement.
Loss on ignition (%)
Cl– (%) SO
3 (%) CaO Free
(%)
CaO Reactive (%)
SiO2 (%) SiO2 + Al2O3 +
Fe2O3 (%)
MgO (%) Al2O3
(%)
1.7 0.01 2.83 1.53 63.1 20.9 92.29 2.71 5.03
Table 3. Chemical composition and physical properties of the fly ash
Cl–
(%) SO3 (%)
CaO Free (%)
CaO Reactive
(%) SiO2
(%)
SiO2 + Al2O3 + Fe2O3 (%)
MgO (%)
P2O5 (%)
Total alkalis
(%)
Retained on No. 325 sieve
(%)
I.A.28D (%)
I.A.90D (%)
0 0.12 0.1 2.7 40.8 89.9 1.9 1.92 0.25 15 79 99
Figure 2. DTA/TGA curves for kaolin.
Table 4. Mix proportions used in phase A.
Mix Calcined kaolin + sodium or potassium hydroxide
Fly ash OPC Ca(OH)2 W/b Sand(g) SP
1-A 4% 32.5% 30% 33.5% 0.31 ---
---2-A 4% 58.3% 30% 7.7% 0.26 ---
---3-A 4% 58.3% 30% 7.7% 0.34 ---
---4-A 4% 32.5% 30% 33.5% 0.52 2000
---5-A 4% 32.5% 30% 33.5% 0.34
---6-A 4% 58.3% 30% 7.7% 0.31
---7-A 4% 58.3% 30% 7.7% 0.40
---8-A 4% 58.3% 30% 7.7% 0.35 0.8%
9-A 4% 32.5% 30% 33.5% 0.37 1.3%
10-A 4% 32.5% 30% 33.5% 0.35 2.5%
11-A 4% 32.5% 30% 33.5% 0.31 2.4%
12-A 4% 32.5% 30% 33.5% 0.36 1.5%
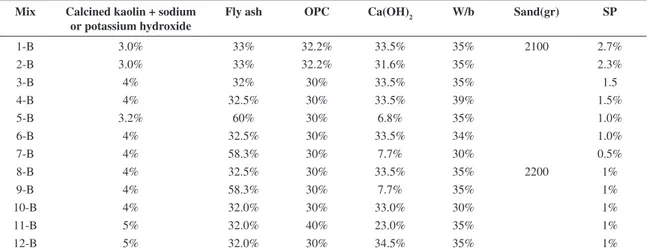
Table 5. Mix proportions used in phase B.
Mix Calcined kaolin + sodium or potassium hydroxide
Fly ash OPC Ca(OH)2 W/b Sand(gr) SP
1-B 3.0% 33% 32.2% 33.5% 35% 2100 2.7%
2-B 3.0% 33% 32.2% 31.6% 35% 2.3%
3-B 4% 32% 30% 33.5% 35% 1.5
4-B 4% 32.5% 30% 33.5% 39% 1.5%
5-B 3.2% 60% 30% 6.8% 35% 1.0%
6-B 4% 32.5% 30% 33.5% 34% 1.0%
7-B 4% 58.3% 30% 7.7% 30% 0.5%
8-B 4% 32.5% 30% 33.5% 35% 2200 1%
9-B 4% 58.3% 30% 7.7% 35% 1%
10-B 4% 32.0% 30% 33.0% 30% 1%
11-B 5% 32.0% 40% 23.0% 35% 1%
2.2.
Mix proportioning and testing
A mixture of kaolin and sodium hydroxide was calcined in a furnace at 650 °C during 140 minutes. The cooled mixture was then ground into powder. Tables 4 and 5 shows the mix proportion respectively used in phases A and B. In the mixes 7 up to 12, potassium hydroxide was used instead of sodium hydroxide. The initial phases were conceived in order to discover the mixtures with the highest compressive strength. Phases C (Tables 6 and 7) and D (Tables 8 and 9) were designed to evaluate the influence of aggregate and calcium hydroxide. Tests were performed on 50×50×50 mm3 concrete specimens, according to NP EN
206-1[26]. The specimens were also placed in the chamber
room, with relative humidity of 58%, during the curing time. The compressive strength, for each mixture, was obtained from an average of the results of 3 cubic specimens. The specimens were tested at the pace of 0.36-0.72 N/s.mm2. The
selection of the speed rate depended on the test’s duration. If a test was feasible at a speed rate of 0.36 N/s.mm2 in
30-90 seconds, the pace was considered acceptable. But, if this pace implied a longer time frame; the pace would have to be increased up to 0.75N/s.mm2. Efflorescences
were evaluated by means of visual observation only. The specimens were immersed in water during 24 hours and then placed at room temperature. After 48 hours, the visualizations were recorded. For examination through scanning electron microscopy (SEM), the samples were covered with 40 nm film of Au-Pd (80-20 weight %); in a high resolution sputter coater, 208HR Cressington Company, coupled to a MTM-20 Cressington High Resolution Thickness Controller. Ultra-high resolution Field Emission Gun Scanning Electron Microscopy (FEG-SEM), NOVA 200 Nano SEM and FEI Company were also used. Backscattering Electron images were achieved through an acceleration voltage of 15kV. Chemical analyses of samples were performed with the Energy Dispersive Spectroscopy (EDS) technique, using an EDAX Si (Li) detector with an acceleration voltage of 20 kV. The FTIR spectra were acquired in the attenuated total reflectance mode (ATR), between 4000 and 550 cm–1,
using a Perkin Elmer FTIR Spectrum BX with an ATR PIKE MIRacleSpecimens for FTIR study were prepared
by mixing 1mg of sample in 100 mg of KBr as .suggested by Zhang et al.27. Spectral analysis was performed over the
range 4000–400 cm–1 at a resolution of 4cm–1.
3. Results and Discussion
3.1. Mechanical strength results
Figure 3 shows the compressive strength of the mixtures test in Phase A. The results show that the most promising mixture (8A) has a compressive strength of around 27 MPa after 28 days curing. This mixture also has the eco-efficient advantage of containing a high percentage of an industrial by-product. The mixture 2A shows high compressive strength performance, due to a low w/b ratio. The results also show that, in general, curing days increases the compressive strength. This is a behaviour not observed in two part alkali-activated cements (in which the compressive strength after just one day can reach 50% to 70% of the compressive strength after 28 days of curing28). However, while this
behaviour is most evident for mixture 8A (the one with the highest compressive strength at 14 days and at 28 days) it is not as evident for mixture 4A (which has lower fly ash content and a higher w/b). The use of a w/b=0.52 leads to compressive strength results below 12 MPa after 28 days curing. This is a very modest performance and reveals an unsuitable mixture for use in future applications. The mixture displaying the lowest 1 day compressive strength result (6A) presents a problem of difficult explanation since it has the same composition as the mixture with the highest 28 days compressive strength (with the exception of the w/b content which is lower). It was also observed that mixtures based on calcined kaolin and sodium hydroxide revealed lower reactivity than the mixtures in which this last constituent was replaced by potassium hydroxide. This confirms the results obtained by other authors29,30 who
also found that geopolymers based on several
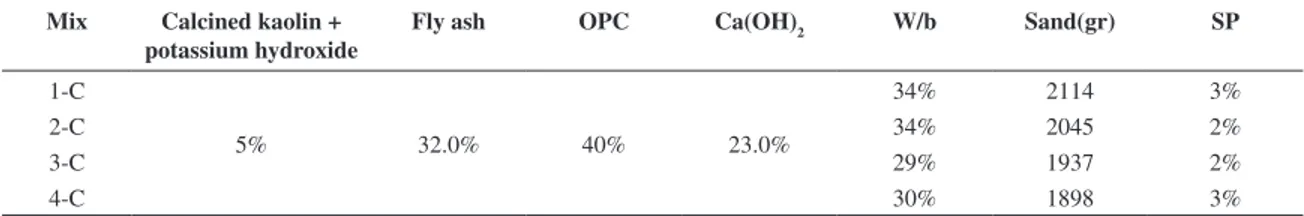
alumino-Table 6. Mix proportions used in phase C.
Mix Calcined kaolin +
potassium hydroxide
Fly ash OPC Ca(OH)2 W/b Sand(gr) SP
1-C
5% 32.0% 40% 23.0%
34% 2114 3%
2-C 34% 2045 2%
3-C 29% 1937 2%
4-C 30% 1898 3%
Table 7. Phase C-Volumetric ratios.
Vs/Vp Vw/Vp Vsp/Vp
1 0.77 0.023
0.95 0.77 0.023
0.9 0.77 0.023
0.85 0.77 0.023
silicate minerals showed higher compressive strength in KOH than in NaOH. This fact is, however, independent of the extent of dissolution being that those minerals display higher dissolution when NaOH is used.Figure 4 shows the compressive strength of the mixtures test in Phase B. The results indicate that a higher compressive strength mixture was obtained (11B) as it reached 30 MPa after 28 days curing. Environmentally speaking, since this mixture possesses 10% more OPC and 15% more calcium hydroxide, it seems that it is as eco-efficient as the previous mixture (8A). An interesting behaviour can be observed when comparing the mixture 11B with mixture 10B. The differences between the two reside in the fact that mixture 10B includes 10% less OPC but 10% more calcium hydroxide, and also, that it has a low w/b. As a consequence, its compressive strength after 28 days curing is almost 10MPa apart from mixture 11B, and probably, if the w/b was the same, the compressive strength difference could be even higher. This suggests the existence of very reactive constituents in OPC. Again, the mixtures where sodium hydroxide was replaced by potassium hydroxide show higher compressive strength. Figure 5 illustrates the compressive strength of the mixtures test in Phase C. In this phase, the mixture 11B was used as reference in order to evaluate the compressive strength variation due to aggregate content. Vs relates to the volume of sand and Vp to the volume of powder (OPC, FA, Kaolin, potassium hydroxide and Ca (OH)2). Increasing the sand content leads to lower compressive strength, this happens because the w/b ratio also increases. Figure 6 shows the compressive strength of the mixtures tested in Phase D. In this phase, the mixture 11B was used as reference in order to evaluate the compressive strength variation due to calcium hydroxide content. The calcium hydroxide is presented as a function of the Portland cement percentage. The results show that there is not a direct linear relationship between the calcium hydroxide content and the compressive strength. The use of calcium hydroxide percentages of as much as 50% of Portland cement leads to the highest compressive strength. Increasing the Ca(OH)2 content beyond that percentage can lead to a decrease in the compressive strength.
3.2.
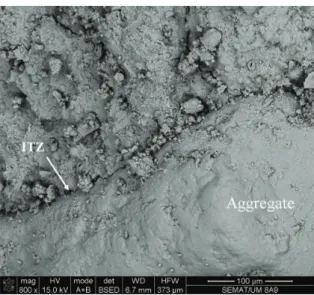
Scanning electron microscopy analysis
Figures 7 and 8 show two SEM micrographs of mixture 8A (the one with highest strength). In contrast with the typical porous interfacial transition zone of Portland cement mixtures, hybrid alkaline cement mortars present
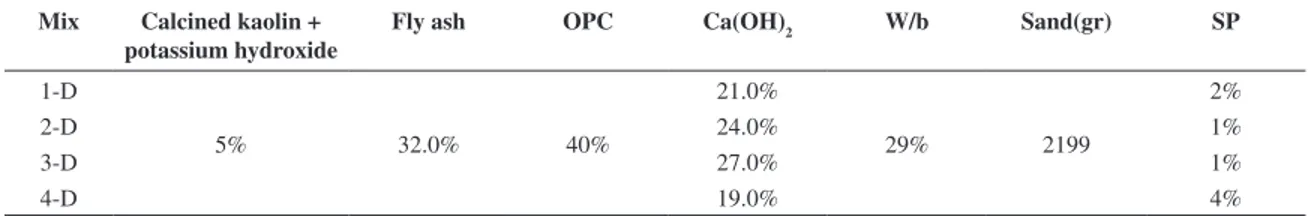
Table 8. Mix proportions used in phase D.
Mix Calcined kaolin + potassium hydroxide
Fly ash OPC Ca(OH)2 W/b Sand(gr) SP
1-D
5% 32.0% 40%
21.0%
29% 2199
2%
2-D 24.0% 1%
3-D 27.0% 1%
4-D 19.0% 4%
Table 9. Phase D-Weight ratios.
WCa(OH)2/Wc WCa/Wc WFA/Wc WSP/Wc
0.45 0.12 0.79 0.01
0.5 0.12 0.79 0.01
0.65 0.12 0.79 0.01
0.7 0.12 0.79 0.01
Figure 4. Compressive strength: Phase B.
Figure 5. Compressive strength: Phase C.
a very dense and uniform ITZ. The molar ratios of the analyses carried out by EDS are displayed in Table 10. Typical C/S ratios in CSH of traditional OPC systems are situated from 1.5 to 2.0[31,32]. However, the areas Z2 and
Z3 present a much lower C/S ratio meaning there has been some sodium replacing Ca2+ in CSH. Some authors have
already demonstrated that sodium incorporation in the CSH phase increases as C/S ratio decreases, and therefore, label it a Na-C-S-H gel33. The areas marked as Z2 and Z3
are identified as some form of calcium silicate with traces of some sodium and aluminum in its composition, which could be associated to a (N,C)-A-S-H gel. According to Garcia-Lodeiro et al.34,35, these gels usually evolve into
compositions with higher calcium and lower aluminum content (with the C–A–S–H gel proposed to be more stable than N–A–S–H, at high pH). Those authors also mention that this is a blank field and that almost nothing has been published concerning the interaction between
aluminosilicate materials containing sodium (or potassium or sulphates) in the formation of N-A-S-H or K-A-S-H type cementitious gels.
3.3. FTIR spectra
The FTIR spectra of the mixture with the highest compressive strength (phase A) is presented in Figure 9. The strong peak band 965 cm-1 is characterized as asymmetric
Si-O-Si or Al-O-Si stretching, which is typical of the polymerization of the silicate group with the formation of CSH.A medium band at 774 cm–1 is formed by a network of
Si-O-Si stretching. The carbonate bands at around 1415 cm–1
arise from the reactions of atmospheric CO2 with calcium hydroxide. This peak intensity changes with the amount of calcium hydroxide. The broad bands in the region of 1648–3466 cm–1 characterized the spectrum of stretching
and deformation vibrations of O-H and H–O–H groups from the weakly bound water molecules (which were adsorbed on the surface or trapped in the large cavities between the rings of alkaline aluminosilicate products).
3.4. Efflorescences
Concerning the occurrence of efflorescences, no presence was observed. This confirmed the observations included in the international related patent24. The explanations for that
can be related to the low amount of (sodium/potassium) as well as to the fact that some sodium/potassium replaced Ca2+
in CSH hydration products. Another factor that influences efflorescences is pore volume and permeability. In Portland cement, the water participates in the hydration products so, as the hydration progresses, the pore volume decreases over time. However, two part alkali-activated binders do not
Figure 7. SEM micrograph of interfacial transition zone.
Figure 8. SEM micrograph of hybrid alkaline cement mortar.
Table 10. EDS Atomic ratio analysis.
Atomic ratio Zone
Z2 Z3
SiO2/Al2 O3 25.6 2.89
Al2O3/ Na2O 2.15 5.44
CaO / SiO2 0.13 0.5
Na2O / CaO 0.13 0.12
MgO/Al2O3 - 0.15
have the same pore volume reduction benefit through the conversion of water into a solid via its incorporation into reaction products17, thus needing a very low w/b ratio to
ensure low permeability.
4. Conclusions
This study has conducted preliminary experimental investigations on the mechanical performance of hybrid alkaline cement mixtures. Based on the experimental results, the following conclusions can be drawn: a compressive strength of 27 MPa after 28 curing days was achieved through the use of a mixture containing only 30% OPC. Also, a general trend was observed linking compressive strength evolution to curing age (which is typical of OPC chemistry). Additionally, mixtures based on calcined kaolin and sodium hydroxide revealed lower reactivity than the mixtures in which this
last constituent was replaced by potassium hydroxide. Furthermore, the results show that there is not a direct linear relationship between the calcium hydroxide content and the compressive strength. None of the mixtures showed any signs of efflorescences. The explanation for this phenomenon can reside in the low amount of sodium/ potassium used, as well as in the fact that some sodium and potassium may have replaced calcium in the hydration products. Hybrid alkaline cement mortars presented a very dense and uniform ITZ. No traditional porous interfacial transition zone was detected in these binders.Further investigations on mixture composition are also needed in order to select mixtures with high compressive strength and high fly ash content. Furthermore, analysis of durability parameters is also needed. Evaluation of LCA of hybrid alkaline cements also merits further investigations to confirm their eco-efficiency.
References
1. Juenger M, Winnefeld F, Provis J and Ideker J. Advances in alternative cementitious binders. Cement and Concrete
Research. 2011; 41:1232-1243. http://dx.doi.org/10.1016/j.
cemconres.2010.11.012
2. Damtoft J, Lukasik J, Herfort D, Sorrentino D and Gartner E. Sustainable development and climate change initiatives.
Cement and Concrete Research. 2008; 38:115-127. http://
dx.doi.org/10.1016/j.cemconres.2007.09.008
3. Pacheco-Torgal F. Introduction. In Pacheco Torgal F, Jalali S, Labrincha JA and John VM, editors. Eco-efficient concrete.
Cambridge: Woodhead Publishing Limited Abington Hall; 2013.
4. Pacheco-Torgal F, Castro-Gomes J and Jalali S. Alkali – activated binders: a review Part 1 Historical background, terminology, reaction mechanisms and hydration products. Construction
and Building Materials. 2008; 22:1305-1314. http://dx.doi.
org/10.1016/j.conbuildmat.2007.10.015
5. Pa c h e c o - To rg a l F, C a s t r o - G o m e s J a n d J a l a l i S.
Alkali – activated binders: a review Part 2 About materials and binders manufacture. Construction and Building
Materials. 2008; 22:1315-1322. http://dx.doi.org/10.1016/j.
conbuildmat.2007.03.019
6. Li C, Sun H and Li L. A review: The comparison between alkali-activated slag (Si+Ca) and metakaolin (Si+Al) cements.
Cement and Concrete Research. 2010; 40:1341-1349. http://
dx.doi.org/10.1016/j.cemconres.2010.03.020
7. Pacheco-Torgal F, Abdollahnejad Z, Miraldo S, Baklouti S and Ding Y. An overview on the potential of geopolymers for concrete infrastructure rehabilitation. Construction and
Building Materials. 2012; 36:1053-1058. http://dx.doi.
org/10.1016/j.conbuildmat.2012.07.003
8. Pacheco-Torgal F, Ding Y, Miraldo S, Abdollahnejad Z and Labrincha J. Are geopolymers more suitable than Portland cement to produce high volume recycled aggregates HPC?.
Construction and Building Materials. 2012; 32:1048-1052.
http://dx.doi.org/10.1016/j.conbuildmat.2012.07.004
9. Davidovits J, Comrie D, Paterson J and Ritcey D. Geopolymeric concretes for environmental protection. ACI Concrete
International. 1990; 12:30-40.
10. Duxson P, Provis J, Luckey G and Van Deventer J. The role of inorganic polymer technology in the development of “Green
Concrete”. Cement and Concrete Research. 2007; 37:1590-1597. http://dx.doi.org/10.1016/j.cemconres.2007.08.018
11. Duxson P and Van Deventer J. Commercialization of geopolymers for construction-opportunities and obstacles. In: Provis J and Van Deventer J, editors. Geopolymers, Structure,
Processing, Properties and Applications. Cambridge:
Woodhead Publishing Limited Abington Hall; 2009. PMid:20092553.
12. Weil M, Dombrowski K and Buchawald A. Life-cycle analysis of geopolymers. In: Provis J and Van Deventer J, editors. Geopolymers, Structure, Processing, Properties and
Applications. Cambridge: Woodhead Publishing Limited
Abington Hall; 2009. p. 194-210.
13. McLellan B, Williams R, Lay J, Van Riessen A and Corder G. Costs and carbon emissions for geopolymer pastes in comparison to ordinary Portland cement. Journal of Cleaner
Production. 2011; 19:1080-1090. http://dx.doi.org/10.1016/j.
jclepro.2011.02.010
14. Habert G, De Lacaillerie J and Roussel N. An environmental evaluation of geopolymer based concrete production: reviewing current research trends. Journal of Cleaner
Production. 2011; 11:1229-1238. http://dx.doi.org/10.1016/j.
jclepro.2011.03.012
15. Pacheco-Torgal F, Abdollahnejad Z, Camões A, Jamshidi M and Ding Y. Durability of alkali-activated binders. A clear advantage over Portland cement or an unproven issue?. Construction
and Building Materials. 2012; 30:400-405. http://dx.doi.
org/10.1016/j.conbuildmat.2011.12.017
16. Provis J, Muntingh Y, Lloyd R, Xu H, Keyte L, Lorenzen L et al.Will geopolymers stand the test of time?. Ceramic
Engineering and Science Proceedings. 2008; 28:235-248.
17. Van Deventer J, Provis J and Duxson P. Technical and commercial progress in the adoption of geopolymer cement.
Minerals Engineering. 2012; 29:89-104. http://dx.doi.
org/10.1016/j.mineng.2011.09.009
18. Skvara F, Kopecky L, Smilauer V, Alberovska L and Bittner Z. Material and structural characterization of alkali activated low-calcium brown coal fly ash. Journal of Hazardous
Materials. 2008; 168:711-720. PMid:19303704. http://dx.doi.
19. Skvara F, Kopecky L, Smilauer V, Alberovska L and Vinsova L.
Aluminosilicate polymers – Influence of elevated temperatures, efflorescence. Ceramics - Silikaty. 2009; 53:276-282.
20. Kani E, Allahverdi A and Provis J. Efflorescence control in geopolymer binders based on natural pozzolan. Cement
and Concrete Composites. 2011; 34:25-33. http://dx.doi.
org/10.1016/j.cemconcomp.2011.07.007
21. Kolousek D, Brus J, Urbanova M, Andertova J, Hulinsky V and Vorel J. Preparation, structure and hydrothermal stability of alternative (sodium silicate free) geopolymers. Journal
of Materials Science. 2007; 42, 9267-9275. http://dx.doi.
org/10.1007/s10853-007-1910-5
22. Shi C, Fernandez-Jimenez A and Palomo A. New cements for the 21st century: The pursuit of an alternative for Portland cement. Cement and Concrete Research. 2011; 41:750-763. http://dx.doi.org/10.1016/j.cemconres.2011.03.016
23. Garcia-Lodeiro I, Fernandez-Jimenez A and Palomo A. Variation in hybrid cemnts over time. Alkaline activation of fly ash-portland cement blends. Concrete Research. 2013; 52:112-122. http://dx.doi.org/10.1016/j.cemconres.2013.03.022
24. Zheng D, Van Deventer JSL and Duxson P. The dry mix cement composition, methods and systems involving same.
International Patent WO 2007/109862 A1; 2007.
25. N O R M A E U RO P E I A . N P E N 4 5 0 - 1: F l y a s h f o r concrete – Part 1: Definition, specifications and conformity criteria. 2005.
26. NORMA EUROPEIA. NP EN 206-1: 2007: Concrete: Part 1. Specification, performance, production and conformity. 2007.
27. Zhang M, Wruck B, Graeme-Barber A, Salje E and Carpenter M. Phonon-spectroscopy on alkali-feldspar: phase transitions and solid solutions. American Mineralogist. 1996; 81:92-104.
28. Pacheco-Torgal F, Castro-Gomes JP and Jalali S. Investigations about the effect of aggregates on strength and microstructure of geopolymeric mine waste mud binders. Cement and Concrete
Research. 2007; 37:933-941. http://dx.doi.org/10.1016/j.
cemconres.2007.02.006
29. Xu H and Van Deventer JSJ. The geopolymerisation of alumino-silicate minerals. International Journal of Mineral
Processing. 2000; 59:247-266. http://dx.doi.org/10.1016/
S0301-7516(99)00074-5
30. Xu H. The geopolymerisation of alumino-silicate minerals
[thesis]. University of Melbourne; 2002.
31. Diamond S. C/S mole ratio of CSH gel in a mature C3S paste as determined by EDXA. Cement and Concrete
Research. 1976; 6:413-416.
http://dx.doi.org/10.1016/0008-8846(76)90105-8
32. Richardson IG. The nature of the hydration products in hardened cement pastes. Cement and Concrete Composites. 2000; 22:97-113. http://dx.doi.org/10.1016/S0958-9465(99)00036-0
33. MacPhee DE. Solubility and aging of calcium silicate hydrates in alkaline solutions at 25 °C. Journal of
American Ceramic Society. 1989; 72:646-654. http://dx.doi.
org/10.1111/j.1151-2916.1989.tb06189.x
34. Garcia-Lodeiro I, Palomo A, Fernández-Jiménez A and MacPhee DE. Compatibility studies between N–A–S–H and C–A–S–H gels. Study in the ternary diagram Na2O–CaO–Al2O3–SiO2–
H2O. Cement and Concrete Research. 2011; 41(9):923-931.
http://dx.doi.org/10.1016/j.cemconres.2011.05.006
35. Garcia-Lodeiro, Fernandez-Jimenez, A, Palomo, A. Alkali-activated based concrete. In: Pacheco-Torgal F, Jalali S, Labrincha J and John VM, editors. Eco-efficient concrete. Cambridge: Woodhead Publishing Limited Abington Hall; 2013. p. 439-487.
Appendix 1. Abbreviations and acronyms.
OPC Ordinary Portland cement
FA Fly ash
SP Superplasticizer
DTA Differential thermal analysis TGA Thermogravimetric analysis SEM Scanning Electron Microscopy FEG Field Emission Gun
EDS Energy Dispersive Spectroscopy ITZ Interfacial transition zone
FTIR Fourier transform infrared spectroscopy CSH Calcium silicate hydrates