THIS REPORT WAS PREPARED EXCLUSIVELY FOR ACADEMIC PURPOSES BY MARTA COLAÇO, A MASTERS IN FINANCE STUDENT OF THE NOVA SCHOOL OF BUSINESS AND ECONOMICS. THE REPORT WAS SUPERVISED BY A NOVA SBE FACULTY MEMBER, ACTING IN A MERE
MASTERS IN FINANCE
After performing the disposal of 17.7 billion euros in NPL and experience a net loss of 11,326 million euros in 2016, UniCredit’s results should exceed 2.5 billion, driving the ROE above 5.5%, the highest of the last 5 years.
Improved macroeconomic conditions in Italy, greater regulatory pressure from the ECB and increased investor’s demand to acquire NPL exposures contributed to a decrease of 27.3 billion euros in Italian bank’s bad debt, reaching only 173.6 billion by July 2017, the lowest value since 2014. Indeed, Italy remains the most active European country in terms of loan sale transactions, with 9.3 and 43.5 billion euros in completed and ongoing transactions (H1 2017), respectively.
However, not every bank resorts to the private sector as UniCredit or Intensa, and 2017 was also marked by the rescue of Veneto Banca, Banca Popolare di Vicenza and Monte dei Paschi, which should cost around 22.4 billion euros to the Italian government (1.33% of Italian GDP in 2016).
Despite being less exposed to insolvent debtors, new challenges might arise with unlikely-to-pay loans, since banks provisions covered for only 33% of these type of loans in 2016. Thus, there is a risk of further losses within UniCredit, since despite the decrease of NPL, UTP exposures still accounted for more than 50% of this (H1 2017). To account for such event in UniCredit’s Valuation, it was performed a scenario analysis.
Company description
UniCredit is an Italian-based financial group, the 11th largest
European bank, with an extensive network across 14 European countries - Italy, Germany, Austria and 11 CEE Countries. UniCredit’s core business lines are Commercial Banking and Corporate and Investment Banking (CIB) divisions.
U
NI
C
REDIT
C
OMPANY
R
EPORT
B
ANKING
S
ECTOR
3
J
ANUARY2018
M
ARTA
C
OLAÇO
[email protected]
Italy’s prodigy bank returns
Italian banks gradually recover, but challenges might persist.
Recommendation: BUY
Vs Previous Recommendation BUY
Price Target FY18: 18.89 €
Price (as of 3-Jan-18) 15.79 €
Reuters: CRDI.MI, Bloomberg: CG:IM
52-week range (€) 11.93 – 18.38
Market Cap (€m) 34.702B
Outstanding Shares (m) 2,225,692,806 Source: Bloomberg
UniCredit VS SX7E index monthly returns
Source: Bloomberg
(Values in € millions) 2016 2017E 2018F
NII 10,307 9,881 9,736 Net Income -11,326 2,813 1,430 NIM 1.36% 1.33% 1.30% Cost/ Income 93.28% 62.45% 61.67% Customer’s Loans 444,607 448,655 447,497 RWA 387,136 373,227 364,132 Equity 43,188 57,850 54,620 Loans/Deposits 93.35% 90.23% 93.32% ROA -1.32% 0.34% 0.18% ROE .26.23% 5.57% 2.54% Capital Ratio 11.66% 15.50% 15.00% Source: Company’s financial reports, analyst’s estimates
Scenarios Probability Share Price
Baseline 35% 23.88 €
Baseline - Lower Perp. ROE 25% 20.37 €
Pessimistic 25% 14.53 €
Pessimistic – Lower Perp. ROE 15% 12.03 € Source: Analyst’s estimates
UNICREDIT GROUP COMPANY REPORT
Table of Contents
COMPANY’S OVERVIEW ... 3
UNICREDIT’S HISTORY ... 3
CURRENT MARKET POSITION ... 5
TRANSFORM 2019STRATEGIC PLAN ... 7
SHAREHOLDERS STRUCTURE ... 8
ECONOMIC OUTLOOK ... 9
Italy ... 9 Germany ... 9 Austria ... 10 CEE ... 11EUROPEAN BANKING SYSTEM ...11
Italian Banking System ... 13
Austrian Banking System ... 13
German banking system ... 14
CHALLENGES AND RISKS ... 15
Non-Performing Loans ... 16
Regulation and Supervisory Mechanisms ... 18
VALUATION ANALYSIS...20
METHODOLOGY ... 20
COST OF EQUITY ... 20
PROJECTED FINANCIAL PERFORMANCE (BASELINE SCENARIO) ... 21
PERPETUITY ANALYSIS ... 24
SCENARIO ANALYSIS ... 26
RELATIVE VALUATION ... 28
APPENDIX ...29
UNICREDIT GROUP COMPANY REPORT
1998
Merge betw een Credito Italiano, Rolo Banca and UniCredito Group
1999 Bank Pekao 2000 Splitska Banka Slovak Pol’nobanka Bulbank 2005 HVB Group Bank Austria Bank PBH
Yapi Ve Kredi Bankasi
2007
Capitalia
Ukrsotsbank
Company’s Overview
UniCredit’s History
UniCredit was created in 1870 with the foundation of Banca di Genova, being renamed Credito Italiano in 1985. In 1998, Credito Italiano, Rolo Banca and UniCredito Group1 merged, creating the UniCredito Italiano Group. Whilst
reinforcing the presence in Italy was desired, the international expansion began in 1999, with the takeover of Bank Pekao SA, the second-largest commercial bank in Poland. In 2000, UniCredito Italiano acquired controlling interests in financial institutions in Croatia, Slovakia and Bulgaria2, becoming the third-largest
western banking group in Central and Eastern Europe (CEE). The merger with the HVB Group (Germany’s second-largest bank at the time) occurred in 2005, with a full takeover of its affiliates, Bank Austria and Polish Bank BPH, becoming the fourth-biggest bank in continental Europe. Additionally, an agreement with Koç Financial Services was performed, in order to acquire 57.4 percent stake of a Turkish bank (Yapi ve Kredi Bankasi A.S). In 2007, UniCredit Group acquired Capitalia (an Italian banking group) and a Ukraine bank (Ukrsotsbank), becoming Europe’s second-biggest bank. The multiple M&A performed throughout time contributed to an increasingly complexity of UniCredit’s structure, which was optimized in 2010, under the One for Clients program, which among others measures, comprised the merge of seven subsidiaries, creating UniCredit S.p.A, the current holding company of the group. In 2015, UniCredit, Santander and affiliates of Warburg Pincus and General Atlantic signed a binding master agreement to combine Pioneer Investments (50% owned by UniCredit and 50% owned by Warburg Pincus and General Atlantic) and Santander Asset Management into a leading global asset manager, a deal that would end by July 2016.
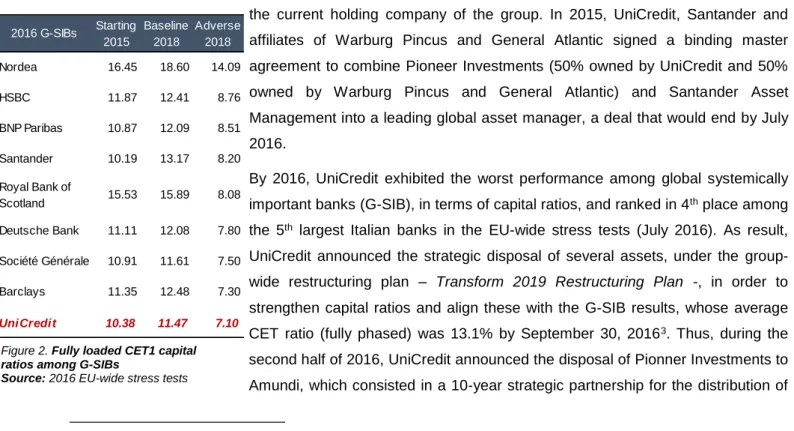
By 2016, UniCredit exhibited the worst performance among global systemically important banks (G-SIB), in terms of capital ratios, and ranked in 4th place among
the 5th largest Italian banks in the EU-wide stress tests (July 2016). As result,
UniCredit announced the strategic disposal of several assets, under the group-wide restructuring plan – Transform 2019 Restructuring Plan -, in order to strengthen capital ratios and align these with the G-SIB results, whose average CET ratio (fully phased) was 13.1% by September 30, 20163. Thus, during the
second half of 2016, UniCredit announced the disposal of Pionner Investments to Amundi, which consisted in a 10-year strategic partnership for the distribution of
1 Cassa di Risparmio di Verona, Cassa di Risparmio di Torino and Cassamarca.
2 Through Splitska Banka, Slovak Pol’nobanka (later named Unibanka) and Bulbank (Bulgaria’s leading bank at the time) respectively. 3 UniCredit data processing based on published financial statements – Annual Report 2016.
Figure 1. Main UniCredit’s Acquisitions Source: Company’s Data
Figure 2. Fully loaded CET1 capital ratios among G-SIBs
Source: 2016 EU-wide stress tests 2016 G-SIBs Starting 2015 Baseline 2018 Adverse 2018 Nordea 16.45 18.60 14.09 HSBC 11.87 12.41 8.76 BNP Paribas 10.87 12.09 8.51 Santander 10.19 13.17 8.20 Royal Bank of Scotland 15.53 15.89 8.08 Deutsche Bank 11.11 12.08 7.80 Société Générale 10.91 11.61 7.50 Barclays 11.35 12.48 7.30 UniCredit 10.38 11.47 7.10
UNICREDIT GROUP COMPANY REPORT
asset management products through UniCredit branches network4. Additionally, it
also announced the disposal of 32.8% of Bank Pekao (the oldest international acquisition held by the group), under the argument of attractive trading multiples and local regulatory limitations, and 20% stake in FinecoBank. Overall, these three strategic disposal enabled to raise more than 8 billion euros5, and by June
2017, UniCredit presented investors a CET 1 fully loaded of 12.8%.6
The historical evolution of UniCredit’s share price clearly illustrates moments of expansion and recession within the financial group. During 1998, the merge of Credito Italiano, Rolo Banca and UniCredito Group enable investors to earn a total stock return of 72%, as UniCredit’s share price increased by 56 euros during that year. Less than 10 years later, between 2005 and 2007, international and domestic growth enabled to reach the highest price ever - around 205 euros per share, by April 2007. However, the beginning of the European Sovereign Debt Crisis reverted all efforts towards growth, as UniCredit’s share price decreased around 104 euros during 2008, and by March 2009, reached a minimum value of 19.3 euros per share. Despite the accentuated decline, UniCredit was able to end 2009 with a price of 74 euros per share. A new decline was experienced during 2011, and since 2014, following the growth of Italian non-performing exposures, the annual average price has been decreasing from 30.0 in 2014, to 29.5 in 2015, and 13.7 in 2016. However, UniCredit might experience a rebound in the share price from 2017 onwards (the annual share price in 2017 was 15.8 euros), as a result of favorable micro and macroeconomic conditions. On one hand, UniCredit’s new management team, led by Jean Pierre Mustier, has been focused on achieving the objectives established in the Transform 2019 Strategic Plan (discussed further in this report). On the other hand, the total volume of bad debts in Italy decreased by 18 billion euros in July 2017, the largest decrease recorded by the Bank of Italy since 19987, as a result of stronger economic
growth and greater investment in the economy8.
4 UniCredit will benefit from intermediation fees from the distribution of Pioneer Investment asset management products, which are now owned by Amundi. 5 “UniCredit's 13-billion-euro share issue almost fully subscribed”, published by Reuters on February 23, 2017.
6 Company’s data - First half 2017 Report.
7 The year in which the Bank of Italy started to record data.
8 “Italian bank’s bad loans fall sharply as economy rebounds”, published by Financial Times on September 12, 2017.
Figure 4. UniCredit’s stock price evolution (1995 – Present) Source: Bloomberg
Figure 3. Fully loaded CET1 capital ratios among 5th largest Italian Banks
Source: 2016 EU-wide stress tests Top 5 Italian Banks Starting 2015 Baseline 2018 Adverse 2018 Intesa Sanpaolo 12.47 12.80 10.31 Banca Popolare 12.39 14.61 9.00 UBI 11.62 13.01 8.85 UniCredit 10.38 11.47 7.10
Banca Monte dei
UNICREDIT GROUP COMPANY REPORT
Current Market Position
UniCredit’s history was written through organic and M&A growth, being currently the 1st, 3rd and 5th largest bank in Italy, Germany and Austria, through UniCredit
S.p.A, HVB Group and Bank Austria respectively, and 11th largest in Europe9. It
supports 25 million clients globally, providing them access to 14 core markets in Europe – Italy, Austria, Germany and 11 CEE countries, being those Bosnia and Herzegovina, Bulgaria, Croatia, Czech Republic, Hungary, Romania, Russia, Slovakia, Slovenia, Serbia, and Turkey - as to another 18 countries worldwide – such as U.S.A., China, India, Brazil, U.K., France, Spain, among others10.
UniCredit operations can be segmented into eight business lines, being those the Commercial Banking (CB) in Italy, CB in Germany, CB in Austria, Central and Eastern Europe (CEE) Division, Corporate & Investment Banking (CIB), Asset Gathering, Non-core11 and the Governance/Group Corporate Centre. The
Commercial banking business line is a key revenue driver within UniCredit’s operations (Figure 7), as this accounts for more than 75% of group’s consolidated revenues, from which the Italian Commercial Banking division contributes with 36%, followed by CEE division with 20%, as the CB Germany and CB Austria, with 14% and 8% respectively.
The current exercise relies in a sum-of-parts valuation analysis, which comprises UniCredit’s holding company - UniCredit S.p.A. -, HVB Group and Bank Austria. UniCredit S.p.A. comprises CB Italy, CEE division, Asset Gathering (through FinecoBank) as CIB services, and HVB Group and Bank Austria focus their operations in Commercial Banking (CB Germany and CB Austria, respectively) and CIB services. Non-Core division, Governance/Group Corporate Centre and additional operations that are not specific to one of the aforementioned subsidiaries, or comprised within the holding company operations, were included in a residual segment designated Others.
UniCredit restructuring program and disposal of strategic assets should result in a decrease of almost 30 billion euros in total assets in 2017, however UniCredit S.p.A., HVB Group and Bank Austria representativeness should remain similar to previous years - 46%, 36% and 13% of consolidated total assets, respectively. Despite the representativeness held by the commercial banking division in which subsidiary, loans and deposits’ structure differ among them. For example, by 2016, UniCredit S.p.A. customer’s loans were fairly divide into household loans, through mortgage loans (44%), and corporate loans, through current accounts
9 When considering Total Assets at 30-06-2017. 10 Either through Branches or Representative Offices.
11 The Non-core division was introduced in the first quarter of 2014, and reports separately non-strategic assets that should be managed with a risk
mitigation approach, as some special vehicles for securitization transactions. Figure 5. Top 15 European Banks
Source: Bloomberg
Data as 30th June 2017 (in bln €)
Figure 7. Group revenues by business line
Source: Company’s data Data as 30th June 2017
Figure 6. Group revenues by geography
Source: Company’s data Data as 30th June 2017
Financial Institutions Total Assets Rank
HSBC 2,492 1 BNP Paribas 2,143 2 Deutsche Bank 1,569 3 Credit Agricole 1,541 4 Santander 1,445 5 Societe Generale 1,350 6 Groupe BPCE 1,238 7 Barclays 1,135 8 UBS 891 9 ING 862 10 UniCredit 827 11
Lloyds Banking Group 815 12
Intesa Sanpaolo 788 13
Credit Suisse 783 14
UNICREDIT GROUP COMPANY REPORT
and other loans (38%). On the other hand, HVB Group and Bank Austria customer’s loans were mainly corporate loans - current accounts and other loans (HVB Group), as finance leases and factoring loans (Bank Austria), held a representativeness of around 60% within each subsidiary, which was 24 p.p. (HVB Group) and 41 p.p. (Bank Austria) higher than the one held by mortgage loans.
Additionally, customer’s deposits illustrate households saving behaviors within each market. While the weight of current accounts and demand deposits is relatively similar across markets (75% in Italy and CEE division, 60% in Germany and 72% in Austria), savings deposits stands out within Germany and Austria, with a representativeness of 25%12 and 18% on total customer’s deposits,
respectively (against a representativeness of only 1% held by the holding company, UniCredit S.p.A.). These results seem to be aligned with 2016 macroeconomic data, as Italy exhibited a household saving rate of 10.5%, which was 6.6 p.p. below Germany, 2.9 below Austria and 1.8 below the Euro Area average. In 2017, forecast rely in a Euro Area household’s saving rate of 12% (1.9 p.p. above Italy, and 4.6 p.p. and 0.7 p.p. below Germany and Austria, respectively).13
The contribution to UniCredit’s consolidated net income seems to be aligned with the balance sheet representativeness held by each division. In this sense, UniCredit S.p.A. accounts with almost 50% of the consolidated operating income and costs, followed by HVB Group and Bank Austria, which account for 20% to 25%, as 10% to 13% of these, respectively. The exposure to the Italian market largely influences UniCredit’s results and justifies earnings volatility exhibited during the last 5 years (max. net income of 2.4 billion in 2014 against a max. net loss of 13.6 billion euros in 2013). For example, by 2016, the net loss was highly influenced by net losses on impairment on customer’s loans, from which 85% resulted from de-risking operations from UniCredit’s holding company, due the disposal of 17.7 billion euros of Italian non-performing exposures (through project FINO).
12 HVB Group saving deposits comprises term and saving deposits.
13 “European Economic Forecast – Autumn 2017”, published by European Commission on November 2017.
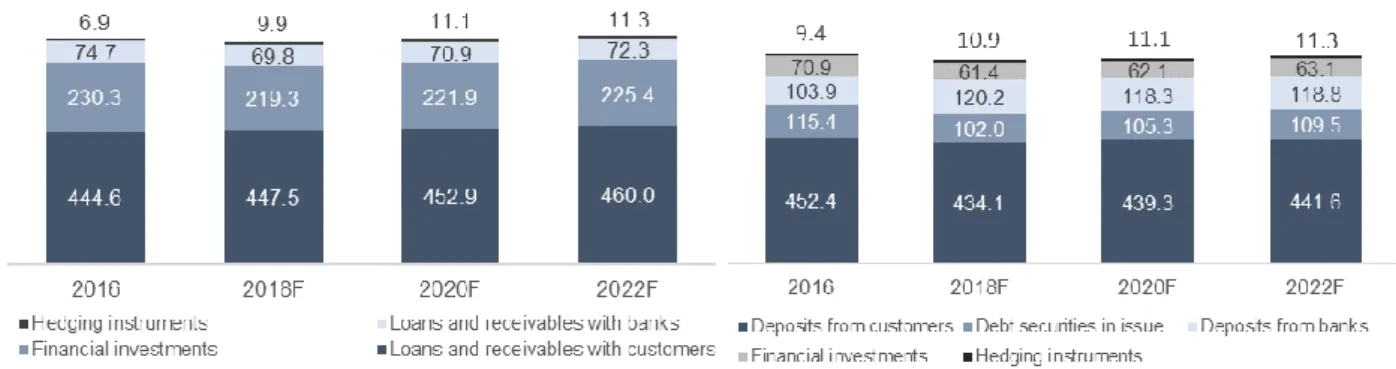
Figure 9. Customer’s deposits decomposition by subsidiaries and holding company (as mln €) Source: Company’s data Data as December 2016 Figure 8. Customer’s loans decomposition by subsidiaries and holding company (as mln €) Source: Company’s data Data as December 2016
Figure 10. Decomposition of UniCredit consolidated net loss (2016) by relevant financial statement items (as mln €) Source: Company’s data
UNICREDIT GROUP COMPANY REPORT
Transform 2019 Strategic Plan
From 2010 onwards, and following the NPL growth within Italian banking sector, UniCredit shift from an M&A growth strategy to a search for operational efficiency and cost cutting through disposals of non-core assets and branch reductions. Despite the reduction of 38,695 employees and closure of 3,101 branches, from which 774 where in Italy, UniCredit’s administrative costs still grew around 6.5% between 2012 and 2016. To boost operational efficiency and face a challenging business environment, characterized by increasingly regulatory pressure and a lengthy period of low growth and low interest rates, it was design a group-wide restructuring plan designated Transform 2019 Strategic Plan. This long-term transformative process aims to (1) reinforce and optimize UniCredit’s capital position, (2) reduce bank’s risk profile by de-risking its balance sheet, (3) improve profitability and (4) transform its operational model to increase client focus and ensure further group’s digitalization.
By 2019, UniCredit aims to reach capital ratios aligned with the best in the G-SIBs class, with a fully loaded CET1 above 12,5%, reach a cost of risk down to 49 bps (0,49%) and a RoTE above 9%. Redesigned business processes and further digitalization should contribute to lower (and sustainable) cost structure, however, the estimated annual recurring costs savings of 1.7 billion euros are mainly due the reduction in the number of employees. Nevertheless, by 2019, UniCredit should reach a cost income ratio below 52% (target). In sum, UniCredit’s current strategy focus on cost reductions and risk discipline, rather than size and growth, which seems to be aligned with market’s expectations. According to a Berenberg analyst, “growth in revenue might be difficult to achieve
and in that sense cutting costs and risk is key to generate shareholder value”14.
Notice that, despite the environment of low interest rates, low average annual revenue growth and regulatory constraints, UniCredit is targeting a 4.7 billion euros net profit in 2019.
In addition to the strategic disposal of assets, such as Bank Pekao, FinecoBank and Pioneer Investments, as aforementioned discussed, UniCredit’s developments accomplished during 2016 and 2017 also comprised the disposal of non-performing loans to third party investors, thought FINO portfolio, as through the introduction of improved management requirements to deal with impaired loans, through PORTO project15.
14 “UniCredit's 13-billion-euro share issue almost fully subscribed”, published by Reuters on February 23, 2017.
15 The PORTO project comprises increases in the provisioning for NPL, aggregation of NPL into well-defined portfolios to foster quicker and more efficient
disposals, as improved valuation of potential recoveries and guarantees.
2016 H1 2017 2019 CET1 11.2% 12.8% 12.5% Cost of risk, bp 91* 55 49 RoTE -28.34% 8.7% > 9% Cost Incom e 61.1%** 59.3% < 52%
Figure 11. Financial Performance VS 2019 Targets
Source: Company’s Financial Reports and Investors Presentations
*adjusted for classification of Pioneer and non-recurring items
UNICREDIT GROUP COMPANY REPORT
On December 2016, UniCredit announced the disposal of two portfolios of non-performing loans to Fortress Investment Group and Pimco, which should hold a majority stake in this transaction. This deal enabled a balance sheet de-risking of 17.7 billion euros, and was officially closed on July 2017, under the average price of 13 percent of the portfolios gross book value (GBV), which is lower than the average recovery rate held by Italian banks. Indeed, the Bank of Italy warned investors not to use this as benchmark, as recent papers published by the national central bank illustrated an average recovery rate on bad loans of 34.7% between 2014 and 2015, which could increase to 43% if considering data since 200616. According to the Bank of Italy, the price gap between the FINO market
price (13% of GBV) and the average recovery rate results from a combination of several effects, such as the firm effect17, the market sale effect, the vintage effect18, the collateralization effect19, among others. From these, the market sale effect was estimated to account for 12.4 p.p. of the price gap, as disposals of
loans to third party investors usually results in lower recovery rates than via internal mechanism20.
During 2016, FINO and PORTO projects contributed to additional loan loss provision of 8.1 billion euros (3.9 from PORTO project and 3.6 billion euros from FINO project). In order to offset bad-loan writedowns and other losses, as to strength bank’s capital position, UniCredit performed a 13 billion euros rights issue at 8.09 euros per share, offering 13 new shares for every 5 shares owned, which implied a discount rate of approximately 38%, based on the theoretical ex-rights price rationale21. This right issue was performed on December 2016, and
by February 2017, around 99.8% had been subscribed22.
Shareholders Structure
Regarding UniCredit shareholder’s structure, approximately 63% is allocated to Institutional Shareholders, from which the company highlights two major shareholders - Capital Research and Management Company, a U.S. based and privately owned investment manager, with more than 1.4 trillion dollars in assets under management23, which owns around 5.072% of ordinary shares, and Aabar
Luxembourg S.A.R.L., which owns 5.038% of ordinary shares. The remaining 36% is divided among Retail Shareholders (13%), Sovereign Wealth Funds (11%), Foundations (6%) and Others (7%). From a geographic criterion, the United States and United Kingdom hold a combined representativeness of 66%
16 “Project Fino: defining a framework to understand market prices and analyzing the main drivers”, published by Banca D’Italia on June 2017. 17 On average, recovery rates for firms are lower than those for households.
18 About one quarter of the FINO portfolio, in terms of value, is composed by old bald loans (average of 12-years).
19 Average recovery rates – and hence market prices – are lower for the unsecured component, and the FINO portfolio is mainly unsecured. 20 “Project Fino: defining a framework to understand market prices and analyzing the main drivers”, published by Banca D’Italia on June 2017. 21 “UniCredit prices rights issue at 38 percent discount”, published by Reuters on February 1, 2017.
22 “UniCredit’s 13-billion-euro share issue almost fully subscribed”, published by Reuters on February 23, 2017. 23 Company’s Website, as of 31th December 2016.
Figure 12. Total Shareholders Composition
Source: Company’s Website Updated on September 2017
UNICREDIT GROUP COMPANY REPORT
on UniCredit’s institutional shares, while only 2% are allocated to its home country - Italy.
The current board of directors is composed of between 9 and 24 members, from which UniCredit Chairman Giuseppe Vita, Vice Chairman Vincenzo Calandra Buonaura and the current CEO Jean Pierre Mustier. During 2018, ordinary shareholders are expected to elect a new board of directors for the financial years of 2018-2020 during the UniCredit Shareholder’s Meeting, usually held in May.
Economic Outlook
Given the high interdependence between the financial sector and the overall economy, as due the representativeness held by macroeconomic indicators (namely GDP growth rate) in UniCredit’s valuation, it was considered relevant to present a brief description of the expected macroeconomic environment in Italy, Germany, Austria and CEE countries, for the next 5 years.
ITALY
Despite the estimated GDP growth rate of 1.5% for 2017, the Italian economy should experience a slow economic recovery, with annual GDP growth rates around 1% for the next five years, and by 2022, the projected GDP growth rate should stand 0.64 p.p. below the Euro Area average. Equipment investment should benefit from the extension of tax incentives and accommodative monetary policy, while slower employment growth and higher inflation on real disposable income might slow down private consumption. Despite this, unemployment is projected to decrease on a yearly basis, reaching 9.7% by 2022 (1.7 p.p. lower than in 2017). After three-years of near-zero inflation, increased energy and unprocessed food prices drove inflation up to 1.4% in 2017, and until 2022, it is expected to remain relatively close to this value. The need for additional resources for the public support of the banking sector and retail investors resulted in a government debt to GDP ratio of 133% during 2017. From 2018 onwards, this is expected to decrease on a yearly basis, and by 2022, Italian government debt should represent around 120.1% of GDP, resulting in a decrease of 12.9 p.p. in 5 years, although it’s still 43.8 p.p. higher than the Euro Area averages.
GERMANY
Robust employment, consumption, constructions and export within Germany, should contribute to a GDP growth rate of 2.1% in 2017. However, IMF forecasts rely on a lower economic growth rate from 2018 onwards, stabilizing at 1.2% in 2022. Both private and public construction investment increased in 2016, and
Figure 13. Institutional Shares by Geography
Source: Company’s Website Updated on September 2017
Figure 14. GDP Growth Rate (as %) Source: IMF WEO Outlook October 2017
The average CEE comprises only the 11 CEE countries in which UniCredit operates
UNICREDIT GROUP COMPANY REPORT
projections rely on strong growth from both supply and demand, mainly due rising house prices and low interest rates. The increase in oil prices, firming domestic demand and wage growth, contributed to the 1.2 p.p. increase in inflation during 2017, and by 2022, this is estimated to be equal to 2.5%. Higher inflation might slow down household consumption, while saving rates are expected to remain high. The labour market will continue to come closer to full employment as unemployment decreases on a yearly basis. By 2022, the unemployment rate should be equal to 3.5%, which is 4.1 p.p. below the Euro area average. It should be highlighted that, despite the recent migration crisis, in 2016 refugees accounted for less than 0.1 p.p. of the unemployment rate.24 Budget surpluses
and favorable macroeconomic developments should contribute to a yearly decrease of the debt-to-GDP gross ratio, and by 2022, German government debt should represent only 50.1% of GDP, which represents a decrease of 14.9 p.p. in 5 years. Despite the favorable macroeconomic projections, investors fear a scenario of housing price bubble25, given the accelerating growth in housing
demand (consequence of strong economic growth and low interest rates environment) and a limited response on the supply side.
AUSTRIA
Austria’s economy grew at 2.3% in 2017, mainly due an increase in domestic demand through increases in private consumption and investment.26 Economic
growth is expected to continue, although at lower annual growth rates, and by 2022, GDP growth rate should be equal to 1.4%, which is only 0.1 p.p. lower than the Euro Area average. Employment growth is expected to continue, mainly due fewer refugees entering and improvements on women and older workers participation in the labour market. Consequently, unemployment rate is expected to decrease, reaching a rate of 5.2% in 2022, which is 2.5 p.p. below the Euro Area average. As in most EU countries, the rise in oil prices lead to an increase in inflation. During 2017, the inflation rate was equal to 1.6%, and it should continue to increase on the following years, stabilizing at a 2.2% rate from 2020 onwards. After the negative impact of the 2016 tax reform on the government budget balance (due necessary structural changes), both household income taxes and corporate profit taxes increased in 2017, due higher employment rates and wage improvements, as stronger exports and growing private consumption. Although a surplus is not expected, an improvement in the government budget balance positively affects the government gross debt, which is expected to
24 European Commission, Economic Forecast Spring 2017, Member State – Germany.
25Notice that Germany’s housing market has been perceived as historically stable, and by 2015 and 2016, house prices registered growth rates of 4% and
5%, respectively, and kept on growing for the past months of 2017.
26 European Commission, Economic Forecast Spring 2017, Member State – Austria.
Figure 15. Inflation Rate (as %) Source: IMF WEO Outlook October 2017
The average CEE comprises only the 11 CEE countries in which UniCredit operates
Figure 16. Unemployment Rate (as %) Source: IMF WEO Outlook
October 2017
The average CEE comprises only the 11 CEE countries in which UniCredit operates
UNICREDIT GROUP COMPANY REPORT
decrease on a yearly basis, from 2017 onwards. By 2022, government debt is projected to represent only 68.3% of GDP, which is 8.0 p.p. below the Euro Area average, and represents a decrease of 11.9 p.p. when compared to 2017 values.
CEE
On average, the 11 CEE countries in which UniCredit operates are expected to exhibit positive economic growth rates until 2022. After two years of negative GDP growth, Russia’s economy grew at 1.8% in 2017, driven by the decrease in inflation and strengthening currency. In Serbia, economic growth is forecasted to strengthen due strong private consumption, while exports and investment are projected to remain robust. Similarly, private consumption and rebounding investment are crucial for economic growth in Hungary and Slovenia. Domestic demand is considered the main growth driver in Turkey - combined with improvements in monetary conditions and internal confidence -, and in Bulgaria. While household consumption is important for Slovakia’s economy, in Romania, fiscal easing and wage increases are highlighted as main economic growth drivers. By 2022, GDP growth rate is expected to stand between 1.5% and 2.5% in most CEE countries, to the exception of Bosnia and Herzegovina (3.0%), Romania (3.3%), Slovak Republic (3.4%), Turkey (3.6%) and Serbia (4.0%). Private consumption is likely to decrease in the next couples of years, as inflation rises. By 2022, inflation rate is projected to be close 2% in most CEE countries, to the exception of Turkey (7.5%), Russia (4.0%), Serbia and Hungary (3.0%). Despite the high rate, Russia’s inflation is expected to exhibit a relatively constant behavior during the forecasted period, after a decrease of 8.5 p.p. in 2016 and 2.8 p.p. in 2017. Current forecasts rely on a gradual decrease of the unemployment rate, and although the average is 8.8%, CEE countries exhibit heterogeneous results when it comes to unemployment. 7 out of the 11 CEE countries are expected to exhibit unemployment rates between 3.5% (Czech Republic) and 6.8% (Slovenia), while Bosnia and Herzegovina (23.5%), Serbia (14.0%), Croatia (12.0%) and Turkey (10.2%) are expected to present considerably high unemployment rates. To the exception of Russia, debt-to-GDP ratio is expected to decrease in all CEE countries. The average debt-to-GDP ratio in CEE countries is 32.8 p.p. lower than the Euro Area average, mainly due Bulgaria (20.4%), Czech Republic (25.4%) and Turkey (27.1%) that exhibit the low debt-to-GDP ratios.
European Banking System
Overcapacity within the European banking sector has been increasingly discussed, with supervisory authorities and bank representatives arguing that in
Figure 17. Government Debt (as %) Source: IMF WEO Outlook October 2017
The average CEE comprises only the 11 CEE countries in which UniCredit operates
UNICREDIT GROUP COMPANY REPORT
order to find stability, European banks would have to consolidate.27 Indeed,
available data points towards banking consolidation within the European banking system during the last decade. Between 2007 and 2016, the number of banks within EU decreased by 71428, mainly due the decrease of 769 small-size
financial institutions, which might not be necessary related with exit of players (i.e. through bankruptcy), since the number of medium size banks (slightly) increased by 60, which might be instead an evidence of consolidation among financial institutions. At the country level, Austria, Germany and Spain registered the largest decrease in the number of domestic banks within the EU spectrum. In September 2016, Mario Draghi, President of the ECB, highlighted overbanking as an additional cause of the low level of European bank’s profitability, besides low interest rates. According to him, overcapacity held by some national banking sectors resulted in increased competition and reduced bank’s margin29. This
issue was also addressed by the IMF, which argues that “consolidation and
downsizing of the banking system might be required so that the remaining banks can enjoy pricing power and sufficient demand to increase the system’s capital generation capacity”.30
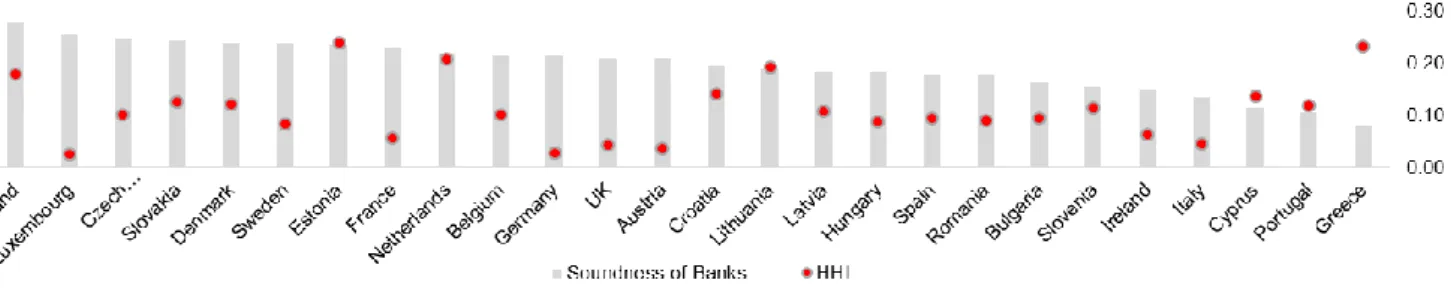
Although, consolidation might promote stability at the bank’s individual level, current data exhibits a mix of relations between increased market concentration and improved soundness of a country banking system, as presented in Figure 19. For example, both Finland and Greece exhibit a Herfindahl index31 above the
sample average (0.1); however, based on the global competitiveness index for soundness of banks (2017-2018), Finland ranks in 1st place while Greece ranks
in 134th, with scores of 6.6 and 2.6, respectively.32
Banking concentration is quite heterogeneous across EU countries. For example, the five largest banks in Greece hold a market share of 97% and countries such as Estonia, Lithuania, Netherlands, Malta, Croatia, Slovakia and Portugal exhibit
27 “Europe’s banks need consolidation to find stability”, Lorenzo Bini Smaghi, published by Financial Times on September 27, 2016. 28 Domestic banks and stand-alone banks (ECB).
29 “Overcapacities in the European Banking Sector”, published by the European Parliament on July 24, 2017. 30 “Potent Policies for Successful normalization”, IMF Global Financial Stability Report, published on April 2016
31 Herfindahl-Hirschman Index (HHI) is a measure of market concentration, that ranges between 0 and 1. As HHI tends to 1, the closer the market is to
become a monopoly.
32 World Economic Forum – Global Competitiveness Index 2017-2018 – Soundness of Banks: it was considered a sample of 137 world countries, and the
score ranges from 1 (extremely low – banks may require recapitalization) to 7 (extremely high – banks are generally healthy with sound balance sheets). Figure 19. Soundness and Concentration in Banking Systems
Source: ECB (HHI) and World Economic Forum (Soundness Score) Figure 18. Evolution in the number of
banks (domestic and stand-alone) between 2007 and 2016
UNICREDIT GROUP COMPANY REPORT
a CR533 above 70%. On the contrary, the market share of the five largest banks
in Luxembourg is only 28%, and Germany, Austria, Italy, Ireland, and France exhibit a CR5 below 50%. Thus, banking consolidation is more likely to occur in these countries, since there is enough scope for further consolidation.
ITALIAN BANKING SYSTEM
Italy’s financial sector has been receiving greater pressure from the national government and the European Central Bank to consolidate, as a strategic response to deal with non-performing loans34, while modernizing the industry. In
January 2017, Banca Popolare di Verona and Banca Popolare di Milano Scarl merged, creating the third biggest lender in Italy (current Banco BPM) with a market value of 5.7 billion euros. Four months later, the European Commission accepted UBI bank’s acquisition of three small banks, which had been rescued by Italian authorities prior in 2015, being those Banca Marche, Nuova Banca Etruria and Nuova Carichieti, after confirming that such acquisition would not distort competition in the Italian banking sector.
Despite holding an aggregated market share of almost 49% and more than 50% of the Italian banking system total assets (around 2.06 from 3.9 trillion euros)35,
there is an accentuated discrepancy in terms of size and market share among the 5th largest Italian banks. As October 2017, UniCredit and Intesa Sanpaolo
exhibited a market share of 11.3% and 19.5%, around 31% of the 49% held by the 5th largest banks, and an average total asset of 808 billion euros, which is
more than 5 times the average total asset held by UBI, BPM and Monte dei Paschi (149 billion euros). Additionally, in terms of financial performance, larger banks tend to exhibit, on average, higher Tier 1 capital ratios, lower levels of non-performing loans (as % of total loans), and improved operational efficiency36.
Thus, one could deduct that (organic) domestic banking consolidation is more likely to occur among medium-size banks, such as Banco BPM, Monte dei Paschi or UBI - which indeed is aligned with M&A events aforementioned -, or among several small-size banks, rather than among UniCredit or Intesa Sanpaolo. The Italian banking system will be further discussed in the Challenges
and Risks section.
AUSTRIAN BANKING SYSTEM
The Austrian banking system is a highly dispersed market, with 481 domestic banks (2016), less 211 financial institutions than in 2007, and a CR5 of 35%. Erste Group Bank is the largest bank in Austria, with 218 billion euros in total
33 CR5 is a concentration measure, and indicates the market share held by the 5 largest banks within a country or geography. 34 Larger banks are able to gather a central management team to deal with NPL in a more efficient way than several small banks. 35 “Italian Banking System Overview”, published by Moody’s Investors Service on October 2017.
36 Notice that the efficiency ratio represents the weight of non-interest expenses over the sum of net interest income and non-interests income; therefore,
higher operational efficiency is given by lower the efficiency ratio. Figure 21. Italian bank’s financial
performance (as %)
Source: Bloomberg and Analyst’s estimates
Figure 20. 5th Largest Italian Banks (as bln €)
Source: Bloomberg and Moody’s Investors Service – Italian Banking System Overview (data as 13th October 2017)
Total assets in bn € Italian Banks Total Assets Market Share Efficiency Ratio UniCredit 827 11.3% 70.5% Intesa Sanpaolo 788 19.5% 53.1% UBI 134 4.6% 74.9% Banco BPM 168 6.2% 32.1% Monte dei Paschi 144 7.0% 85.7%
UNICREDIT GROUP COMPANY REPORT
assets, followed by the Raiffeisen Bank International Bank AG (RBI) and Bank Austria (UniCredit Group), with 138 and 103 billion euros, respectively. When compared to smaller banks, such as Raiffeisenlandesbank Öberoesterreich (RBL) and Hypo Noe Gruppe Bank, which exhibit 39 and 16 billion euros in total assets, respectively, larger banks tend to present improved financial performance, at least in terms of (annualized) Net Interest Margins, Cost efficiency and Return on Equity. By the end of the first half of 2017, Erste Group presented investors with a ROE of 5.7% (1.3 p.p. and 4.4 p.p. higher than Bank Austria and Hypo Noe Gruppe), and Raiffeisen Bank reached a NIM of 2.7% (1.7 p.p. and 1.8 p.p. higher than Bank Austria and RLB).
Due geographical proximity, Austrian banks have extensive networks in CEE countries, including Russia and Turkey, which promotes higher profit margins than the domestic market, but at the expense of greater financial and political volatility. Thus, Austrian banks have been re-focusing their operations on domestic market and reducing exposure to risky assets, as supported by the transfer of the CEE division from Bank Austria to UniCredit’s holding company (UniCredit S.p.A.). Erste Group has a more consistent internal process than its peers do, which creates less urgency to undergone a transformation process. On the other side, due its decentralized structure and the large number of small primary banks, Raiffeisen Bank Group (RBG) exhibits a large restructuring potential, a process that might have started in March 2017, with the merger between the Raiffeisen Bank International AG (RBI) and Raiffeisen Zentralbank Ôsterreich AG (RZB). In general, Austrian banking sector outlook is stable, according to Fitch Ratings, with some positive momentum given the restructuring
progress and benign economic trends in Austria and CEE.37
As a final thought, given the restructuring potential within Austrian banking sector, banks might experience increased earnings stability and foster profitability, which might increase Austrian market attractiveness for M&A activities. Between 2000 and 2016, the financial sector accounted for 27% of all M&A deals in Austria, which corresponded to a total value of 46 billion euros38.
GERMAN BANKING SYSTEM
By 2016, the German banking sector was composed by 1,496 domestic banks (less 160 than in 2007), which represented 65% of total domestic banks within the Euro Area, and exhibited a CR5 of 31%.
German’s “three-pillar” banking system is composed by private commercial banks, public banks (savings banks or Sparkassen, and regional state-owned
37 “2017 Outlook: Austrian Banks”, published by Fitch Ratings on December 2016.
38 “M&A Austria – Mergers & Acquisitions Austria”, IMAA Institute, last viewed on 30th October 2017.
Figure 22. Largest 3 Austrian banks (as bln €)
Source: Bloomberg Data as 30 June 2017
Figure 23. Austrian bank’s financial performance (as %)
Source: Bloomberg and Analyst’s estimates Austrian Banks Total Assets % Loans/ Assets Efficiency Ratio Erste Group 218 64.0% 66.7% RBI 139 58.5% 64.7% Bank Austria 103 60.2% 76.0%
UNICREDIT GROUP COMPANY REPORT
banks, or Landesbanken), and cooperative bank, with the first two controlling around 30% and 50% of banking transactions39. Deutsche Bank is the largest
private commercial bank in Germany, with 1.6 trillion euros in total assets – 3 and 5 times more than Commerzbank and HypoVereinsbank (HVB Group) total assets, respectively. Within the remaining categories, KfW and Landesbank Baden-Wuerttemberg (LBBW) stand out among stated-owned banks, while DZ Bank is German’s largest cooperative bank. On average, private commercial banks tend to exhibit higher annualized net interest margins and Tier 1 capital ratios than cooperative or state-owned banks (landesbank), while the average
ROE among landesbank was 0.6 p.p. higher than in private commercial banks. German bank’s profitability has been increasingly under pressure, similarly to other European banks, due low interest rates, high costs structures and increased compliance costs, which according to a member of the ECB, could be offset by mergers and acquisitions within the German banking sector.40 Indeed,
one could use as example the merge between Deutsche Bank Privat-und Geschäftskunden and Deutsche Postbank, announced in October 2017, which is estimated to generate annual synergies of around 900 million euros, from 2022 onwards, mainly due standardized branch networks, product range alignment and improvement in IT systems and processes. To rival Deutsche Bank merge, there has been discussed the possible acquisition of Commerzbank by UniCredit, thus becoming the largest lender by market share within Germany. However, there might be several constraints of different natures to this deal. First, UniCredit is currently undergoing a rigid restructuring process mainly characterized by a cost and risk discipline strategy, which might not be compatible with the acquisition of a 487 billion euros financial group. Second, the German government might interfere, by either preferring a deal with BNP Paribas, - which would result in a Franco-German powerhouse, and fewer job reductions, given its reduced presence in Germany -, or by preferring a domestic consolidation due
national regulatory purposes.41
Challenges and Risks
Busyness dynamics are expected to reshape the banking sector during the next decade, and at least three macro-economic trends can be highlighted, being those strengthen regulatory and supervisory mechanisms, technological innovation and changes in social-demographics behaviors. In addition, and as a short-term concern, financial institutions must develop a reasonable solution to
39 “Germany – Banking Systems”, published by Export.gov on April 2017.
40 “German banks could soon see more mergers: ECB member”, published by CNBC on March 27, 2017.
41 “UniCredit should focus on its restructuring plan instead of merging with Commerzbank”, published by Seeking Alpha on September 29, 2017.
Figure 24. Large German banks (as bln €)
Source: Bloomberg
Data as June 2017 (* as December 2016)
Figure 25. German bank’s financial performance (as %)
Source: Bloomberg Data as 30 June 2017 German Banks Total
Assets % Loans/ Assets Efficiency Ratio Deutsche Bank 1,569 25.7% 86.9% DZ Bank AG 513 34.3% 89.0% KfW Bank* 507 74.5% -Commerzbank 487 42.6% 98.8% HVB Group 295 42.5% 70.3% LBBW 255 45.1% 69.0%
German Banks Annu. NIM ROE Tier 1 Capital Ratio Deutsche Bank 1.6 1.4 17.3 Commerzbank 1.1 - 1.4 14.1 HVB Group 1.0 3.9 21.2 Deutsche Postbank 1.4 4.1 14.1 DZ Bank AG 0.6 1.9 14.5 LBBW 0.7 1.5 17.2 BayernLB 0.9 3.1 13.3 NORD/LB 0.9 3.7 12.2 Helaba 0.8 2.0 15.3 Private Com m ercial Banks
Cooperative Banks
UNICREDIT GROUP COMPANY REPORT
the non-performing loans issue (NPL), and foster growth under low interest rates environment.
NON-PERFORMING LOANS
Under an economic recession environment, several households and non-financial institutions became unable to repay their debts, leading to an accentuated growth of reported non-performing loans42, during and after the
European Sovereign Debt crisis. Non-performing loans as % of total loans is considerably high in peripheral countries, such as Cyprus, Greece, Italy, Ireland and Portugal. Italy exhibits a NPL ratio of 17%, 12.7 p.p. higher than the Euro Area average and 7.1 p.p. higher than in 2010, while Austria and Germany exhibit non-performing exposures of only 2.7% and 2.0%, respectively. In terms of nature, 23.7% of NPL come from Non-financial Corporations, which is 12.2 p.p. higher than the % of NPL held by households.
The total volume of bad debt held by Italian banks experienced a decreased of 18.4 billion euros between June and July 2017, the largest ever recorded by the Bank of Italy43, reaching 173.6 billion euros, the lowest since June 2014. This
could be seen as a combined result of i) improved macroeconomic conditions in Italy (and in the Eurozone in general), ii) greater regulatory pressure from the ECB on banks to improve their balance sheets loans exposures and iii) increased investor’s demand to buy NPL exposures from banks.
Since 2015, Italy summed up a total of 106 billion euros in loan sales transactions – from which 36 billion in 2016, and 9.3 and 43.5 billion euros in completed and ongoing deal transactions in 2017, respectively -, much higher than other European countries such as UK or Spain (total 73.5 and 63.7 billion euros, respectively). In 2016, UniCredit was the most active seller, with loan sales transactions of 20.6 billion, and the most active buyers were Fortress and Pimco, with 13.5 and 5.2 billion euros, respectively, which is aligned with the disposal of FINO portfolios, aforementioned analyzed. Despite remaining an active market in 2017, Italian loans sale transactions are not expected to reach
42 A bank loan is considered non-performing when more than 90 days pass without the borrower paying the agreed instalments or interest. Non-performing
loans are also called “bad debt”.
43 The Bank of Italy started to record data in 1998.
Figure 26. NPL to Total Gross Loans (as %)
Source: World Bank *Data as 2015
Figure 27. NPL per sector (as %) Source: ECB
Data as December 2016
Figure 28. Italian bank’s bad debt (NPL) (as bln €) Source: Bloomberg and Bank of Italy
Data from July 2011 to July 2017 Country Non-Financial Corporations Households Cyprus 54.9 54.7 Greece 53.9 46.3 Portugal 29.4 8.7 Italy 23.7 11.6 Ireland 15.3 17.4 Spain 10.9 4.5 Austria 7.1 5.7 Germany 6.4 1.8 France 5.8 4.1 U.K. 3.7 2.2 Country 2010 2016 Cyprus 5.8 47.7* Greece 9.1 36.3 Italy 10.0 17.1 Ireland 13.0 14.9* Portugal 5.2 12.0* Spain 4.7 5.6 Euro area 5.6 4.4 France 3.8 4.0* Austria 2.8 2.7 Germany 3.2 2.0* United Kingdom 4.0 1.0*
Figure 29. Loan sale transactions per country (as bln €)
Source: Deleveraging Europe H1 2017 – Deloitte UK
UNICREDIT GROUP COMPANY REPORT
2016 values, as inferred from the available data from the first half of 2017, since not every Italian bank resort to the private sector to de-risk their balance sheet. Indeed, during 2017, the Italian government committed itself with almost 22.4 billion euros to rescue distressed banks, around 1.33% of Italian GDP in 201644.
On June 2017, ECB determined that Veneto Banca and Banca Popolare di Vicenza were failing or likely to fail, which triggered Italian government intervention, offering as much as 4.8 billion in cash injections and 12 billion euros in guarantees to help cover potential losses from both lenders’ bad loan portfolios, which would be transferred to a so-called “bad” bank. Additionally, Intesa Sanpaolo (one of the largest Italian bank) received 5.2 billion euros from the Italian government to acquire certain “good” assets and liabilities from both lenders, at a symbolic price of 1 euro. From those 5.2 billion, 4.8 billion were meant to help the bank to maintain its capital ratios, and additional 400 million in guarantees to help protect it against additional risks. Intensa acquisition excluded NPL, subordinated bonds issued as shareholdings and other legal relationships that the bank considered not “functional to the acquisition”45. Overall, the bailout
of Veneto banks should remove 18 billion euros in non-performing loans from the Italian banking system, as contribute to its consolidation, at a cost of 17 billion euros in state aid.46
On July 2017, the European Commission approved a precautionary recapitalization for Banca Monte dei Paschi di Siena, which comprise a state aid of 5.4 billion euros, under the development of an effective restructuring plan to ensure bank’s long-term viability, which should include the transfer of bad loans to a special vehicle and a salary cap for senior managers.47 The Italian
government should take a 70% stake in the bank, and under the resolution plan, Monte dei Paschi should transfer 26.1 billion euros to a privately funded special vehicle on market terms, with the operation partially funded by Italian banks rescue fund Atlante II48, financed by several financial institutions, namely
UniCredit and Intesa.
Both rescues occurred after an orderly and state aid free rescue of Banco Popular Espanol by Banco Santander, which committed to acquire its rival for a symbolic price of 1 euro. As part of the transaction, Santander planned to perform a 7 billion euros right issue to rebuild Banco Popular balance sheet, which had 37 billion euros in non-performing real estate loans.49 Italian rescues
44
1,680,522.8 million euro, Source: Eurostat.
45 “Intesa Sanpaolo sings contract to acquire certain assets and liabilities of Banca Popolare di Vicenza and Veneto Banca”, published by Intensa Sanpaolo
Press Releases on June 26, 2017.
46 “State aid: Commission approves aid for market exit of Banca Popolare di Vicenza and Veneto Banca under Italian insolvency law, involving sale of some
parts to Intesa Sanpaolo”, published by European Commission – Press release on June 25, 2017.
47 “EU approves Monte dei Paschi Bailout – as it had to, really”, published by Forbes on July 4, 2017. 48 “EU clears taly’s $6billion state bailout for Monte dei Paschi”, published by Reuters on July 4, 2017.
49 “Santander takes over ‘failing’ rival Banco Popular after EU steps in”, published by Financial Times on June 7, 2017.
Figure 30. Top Sellers and Buyers in Italy, 2016 (as bln €)
Source: Deleveraging Europe 2016 – 2017 Deloitte UK
Data as December 2016
Figure 31. Top Sellers and Buyers in Italy, 2017 (as bln €)
Source: Deleveraging Europe H1 2017 – Deloitte UK
UNICREDIT GROUP COMPANY REPORT
resemble the resolution of Banco Espírito Santo in Portugal, which was also split into “bad” and “good” bank (Novo Banco). Novo Banco received a capital injection of 4.9 billion euros, mostly through public funds, and was owned by the Resolution Fund, which is financed by several Portuguese financial institutions, under the supervision of the Bank of Portugal and the Ministry of Finance50. On
October 2017, it was announced the sale of Novo Banco to the U.S. Private Equity Lone Star, which should inject a total of 1 billion euros in capital until the end of the year51.
This allows interesting analysis over the Italian banking system and the EU rules. First, large Italian banks such as UniCredit and Intesa might be called to share the burden of the bailout of other stressed banks, which might revert the efforts towards de-risking balance sheet and capital strengthen performed by them. Secondly, it clearly shows how heterogeneous resolution laws can be within the European Union, which might be simultaneously an effective and challenging approach for regulatory and supervisory mechanisms.
REGULATION AND SUPERVISORY MECHANISMS
Since 2009, there has been an extensive development and decisively improvement of regulatory frameworks, both at the international and the European level. Under the (European) Banking Union project, regulatory mechanisms were strengthen with the implementation of a Single Supervisory Mechanism (SSM) and a Single Resolution Mechanism (SRM). In theory, if the ECB evaluates that a bank is failing or likely to fail, the issue is forwarded to the Single Resolution Board, which can use, among other resolution tools, the Single Resolution Fund. In practice, national authorities might ask for different approaches, as it recently occurred in Italy.
When presented with scenarios of failing or likely to fail, the Italian government conducted the necessary negotiations with the EU regulators to apply national insolvency laws, in the case of Banca Popolare di Vicenza and Veneto Banca, or conduct a precautionary recapitalization52, in the case of Banca Monte dei Paschi
di Siena. In both cases, the objective was to protect domestic investors from further losses, which might have occurred under the EU’s bank-failure law (Bank Recovery and Resolution Directive).
These events allow investors to detect possible flaws in European laws, as to identify challenges and risks that European regulatory and supervisory authorities will have to address in the future. While capital injections and state aid performed in each bailout are in accordance with EU rules, the effectiveness of Banking
50 “Cronologia: da resolução do BES à venda do Novo Banco”, published by Público on March 31, 2017.
51 “Press Release of Banco de Portugal on the conclusion of the sale of Novo Banco”, published by the Bank of Portugal on October 18, 2017. 52 A precautionary recapitalization is a mix of state and private funds as well as debt and equity writedowns to finance the removal of bad debts.
UNICREDIT GROUP COMPANY REPORT
Union mechanisms, namely the SRM, in ensuring that private investors share the burden of bank’s bailout can be questioned. For example, in addition to the 5.4 billion euros state aid in Monte dei Paschi, EU rules also predicted losses among investors, as these should share the burden of rescuing the bank. However, the additional 4.3 billion euros only came from shareholders and junior creditors, thus excluding other investors such as senior bondholders and depositors (those above 100,000 government guarantee)53, which might illustrate a flaw in the law,
and not in the bailout.
On the other hand, it clearly shows the need for heterogeneous regulation schemes, with regulatory decisions being influenced by multiple macro and micro-economic factors. National central banks will become more relevant, and seek to better control financial institutions within national boards, as regulation is increasingly local in nature. While this increases regulation and intervention programs effectiveness, global investors might decreasingly invest in the European banking system due the increasingly uncertainty of outcomes – “for global bank investors, the European banking sector and how to invest in it is very
confusing, not uniform, and difficult to predict.”54.
At the international level, the Basel Committee on Banking Supervision will continue to play a major role in developing strengthen measures of regulation, supervision and risk management for the banking sector, thought the improvement of international regulatory frameworks, such as Basel Accords. In general, there has been a significant progress regarding minimum capital requirements for financial institutions. In the euro area, banks have materially bolstered their capital positions, with the average common equity Tier 1 ratio of significant institutions rising from around 7% in 2008 and 9% in 2012 to 13% by end-2015.55
To conclude, as financial institutions increase in complexity, so does regulatory measures and supervisory mechanisms. Thus, regulators and supervisors are responsible to conduct recurrent comprehensive analysis on the overall effect of those measures and mechanisms in the banking system, in order to avoid overlaps, duplication and other inefficiencies, that ultimately might trigger financial instability, rather than promoting it.
53 “EU approves Monte dei Paschi Bailout – as it had to, really”, published by Forbes on July 4, 2017.
54 “Italy commits up to €17bn to rescue two stricken banks in ‘pragmatic’ interpretation of EU bailout law”, published by The Telegraph on June 26, 2017.
Based on the opinion of David Hendler, founder of Viola Risk Advisors, a credit analysis firm in New York State.
UNICREDIT GROUP COMPANY REPORT
Valuation Analysis
Methodology
In financial institutions, debt and debt payments cannot be easily identified, therefore, Free Cash Flow to Equity (FCFE) rather than the usual Discounted Cash Flow to the Firm should be used. As aforementioned, UniCredit market coverage can be segment into four geographical divisions, being those Italy, Germany, Austria and CEE, which in turn are associated to three companies of the Group: Italy and CEE divisions are included in the report of the holding company, UniCredit S.p.A., while Germany and Austria are directly related to
HVB Group and Bank Austria operations, respectively. Thus, it was performed
a sum of the parts analysis based on the individual valuation of the aforementioned companies, and additionally, it was considered a residual segment, designated “Others”, that reconciles the sum of the three companies with the consolidated amounts of the group.
Cost of Equity
UniCredit’s cost of equity was computed based on the Capital Asset Pricing Model (CAPM), under a risk-free rate proxy of 0.50% (Germany Government 10 years yield) and a market risk premium (MRP) of 5.5%56. UniCredit’s beta
resulted from the regression of UniCredit’s excess returns against STOXX Europe 600 index excess returns (monthly data), for the past 5 years, leading to a raw beta of 2.01. This result is associated with a 95% confidence interval of [1.89;2.12], which provides statistical confidence over the aforementioned result, at least at a 5% significance level. Since betas might exhibit mean reverting properties towards 1 in the long-run, it was rather used the adjusted beta, given by adjusted beta = 0.67×Raw beta + 0.33×1, which was equal to 1.68. By combining all aforementioned elements, it was possible to reach a cost of equity
of 9.72%.
Transform 2019 Strategic Plan aims to increase financial stability and strengthen capital ratios, which might contribute to less volatile earnings, and consequently to less volatile market movements (given by a lower beta). Thus, until 2022 UniCredit’s beta is expected to decrease towards the banking sector average beta of 1.4957, as the bank is perceive to be less volatile, which leads to a cost of
equity of 7.59%. For the perpetual analysis, it was considered a cost of equity of 7.35%, which results from a risk-free rate of 1.25% (Germany Bond 30 years
yield), a MRP of approximately 4% (average last 30 years), and a beta of 1.49.
56 “Equity Market Risk Premium – Research Summary”, published by KPMG on October 19, 2017. 57 Source: Reuters – Valuation Ratios (https://www.reuters.com/finance/stocks/financial-highlights/CRDI.MI).
UNICREDIT GROUP COMPANY REPORT
As returns volatility increase, bank’s systemic risk also increase, which results in a decline of UniCredit’s share price. For example, when considering an adjusted beta of 1.7558 and a perpetual beta of 1.95 - the current average beta from the 5th
largest Italian banks (excluding UniCredit) -, UniCredit’s share price could decrease by 7.63 euros, and investors would demand a minimum short-term and long-term return of 10.13% and 9.23%, respectively.
Actually, from a long-term perspective, investors would choose not to invest in UniCredit, as for every euro invested these would only obtain 83 cents, since the perpetual ROE for the overall group would be smaller than the cost of equity (7.65% < 9.23%). Under the baseline scenario, despite the proximity between the investment and return rate (perpetual ROE and cost of equity of 7.70% and 7.35%, respectively), shareholder’s investment is expected to generate value of 0.35%, per year in perpetuity, as they are expected to receive 1.05€ for every euro invested.
Projected Financial Performance (Baseline Scenario)
Recent restructuring activities - namely the disposal of Bank Pekao and non-recurrent assets - contributed to a 32.4 billion euros decrease in total assets during the first half of 2017, and by December 2017, these are estimated to sum up 829.4 billion euros. From 2019 onwards, UniCredit’s total assets should follow a progressive growth, reaching almost 835 billion euros by 2022.
Customer’s loans account for 55% of UniCredit’s consolidated assets, which are highly influenced by macroeconomic projections, such as GDP growth rate, followed by 27% and 9% from financial investments and loans with bank, which rely on the financial market recovery and inter-bank activity, respectively. On the liability side, Customer’s deposits represent around 54% of UniCredit’s funding structure, followed by bank’s deposits (16%) and debt securities in issue (14%). By 2022, interest bearing assets and liabilities should sum up to 768.96 and 744.26 billion euros, respectively, as presented in Figures 34 and 35.
58 Assuming a raw beta of 2.12 (Upper limit of 95% confidence interval).
ST Beta 1.49 1.68 1.95
1.6 24.2 20.3 16.6
1.68 23.9 20.1 16.4
1.75 23.6 19.9 16.3
Perpetual Beta
Figure 33. Total assets evolution (as bln €)
Source: UniCredit’s financial reports and Analyst’s estimates.
Figure 34. Interest bearing assets by 2022 (as bln €) Source: Analyst’s estimates.
Figure 35. Interest bearing liabilities by 2022 (as bln €) Source: Analyst’s estimates.
Figure 32. Sensitivity analysis for UniCredit’s ST and LT Beta ( in €) Source: Analyst’s estimates and Reuters