Economics of Energy Storage in a Residential
Consumer Context
Dennis Metz
PDSSE Program, FEUP/MIT PhD Program Faculty of Engineering, University of Porto Rua Dr. Roberto Frias, 4200 – 465 Porto
Porto, Portugal [email protected]
João Tomé Saraiva
INESC TEC / DEEC
Faculty of Engineering, University of Porto Rua Dr. Roberto Frias, 4200 – 465 Porto
Porto, Portugal [email protected] Abstract— With the increase of electricity tariffs and the
decreasing costs for distributed generation technologies, more and more residential consumers are deploying local generation systems to satisfy their electricity demand in order to reduce overall cost. Typically, however, a mismatch between electricity generation and demand remains. Storage systems enable consumers to reduce this mismatch by storing locally generated electricity for later consumption, instead of feeding excess generation into the grid. This paper analyzes the economics of storage installations in a residential consumer context. A linear program is presented to determine the optimal dispatch, and Simulated Annealing is used to identify the cost minimizing system configuration. The developed approach is tested for a multi-family house in Germany.
Index Terms— Energy Storage, Cost benefit analysis I. INTRODUCTION
At the 2015 United Nations Climate Change Conference, all 196 parties agreed on the goal to limit the global temperature increase to 2°C [1]. Renewable technologies like photovoltaic systems are considered as one of the keys to reduce CO2 emissions, one of the major drivers of global climate change. However, in order to integrate intermittent renewable technologies into the grid, further investments into storage and transmission networks are required. In this context, the European Commission in their Energy Roadmap 2050 expects private investors to play an important role: “Investments by households and companies will have to play a major role in the energy system transformation. […] Innovative business models are crucial.“ [2].
Such a business model can be the deployment of storage for later consumption of locally generated energy in a residential context. The commercial success thereof is driven by the development of electricity tariffs and feed-in compensation. Electricity prices for residential consumers in Germany have increased by more than 20% over the last 5 years, with taxes and levies meanwhile accounting for more than 50% of the price [3]. On the contrary, feed-in tariffs for the most popular distributed generation technology, photovoltaic systems, are decreasing annually. At the same time, however, installation costs have also sharply decreased. The widening spread between consumption and feed-in tariffs combined with the decreasing installation cost is making the generation of electricity for self-consumption more attractive.
However, the intermittency of photovoltaic generation results in a mismatch between demand and generation. Storage systems are able to bridge this gap. Weniger et al. [4] show that if a battery is installed, self-sufficiency for residential consumers can be increased from around 30% to almost 60%.
The second wide-spread distributed generation technology is cogeneration. While combined heat and power (CHP) plants can be dispatched according to electricity demand, they are usually setup for serving thermal demands and generate electricity as a byproduct. As the feed-in tariff for excess energy is lower than for photovoltaic systems, storage might be even more attractive in this combination. Wind turbines are typically installed independent of buildings and therefore not further considered.
The economic viability of storage in combination with a photovoltaic system was analyzed by e.g. [4], [5] and [6]. Weniger et al. [4] conclude that storage systems are not yet profitable. However, assuming rising electricity tariffs as well as declining investment cost, they expect them to become cost effective in the long term. Werner et al. [5] compare the cost for combined storage and photovoltaic systems for residential self-consumption for different countries. The authors state that the “Most attractive markets are those with a large spread between PV and grid electricity cost.” [5]. Mulder et al. [6] find that batteries are an economically attractive solution, if electricity prices rise. The optimum capacity strongly depends on the expected price increases and the consumption profile. The dispatch of the storage system has been handled twofold. Publications [4]–[6] are based on a simple charge strategy, where the battery is charged whenever there is a surplus of generation over local demand. Once the battery is fully charged, remaining excess is fed into the grid. When demand exceeds local generation, the storage is first discharged before missing energy is taken from the grid. On the other hand, for example Schmiegel and Kleine [7] use linear programming to determine the optimal dispatch. Having in mind these ideas, Section II describes the developed approach to obtain the optimal dispatch for the storage system as well as how to identify the cost-minimizing system configuration. A case study is presented in Section III, with results presented in Section IV. Finally, Section V summarizes the most relevant findings and discusses remaining questions.
II. DEVELOPED APPROACH
While several papers have been published about combined photovoltaic and storage installations, the inclusion of cogeneration units and the consideration of multi-family houses has so far been neglected. Furthermore, we propose to include system cost in the dispatch problem to consider the limited cycle-lifetime of storage, hence only admitting those storage operations whose value exceed attributable depreciation cost. In addition, we also consider the loss of PV generated power, which might result from feed-in limitations. A. Optimal Dispatch Problem
A Linear Programming (LP) formulation is used to determine the optimal storage dispatch. The objective is the minimization of the operating cost by optimizing the storage dispatch schedule (equation (1)).
Index t refers to the time, with T denoting the simulation horizon. Each simulation step has the duration Δt, expressed as fraction of an hour. Decision variables are the power exchange with the grid (PGridImport, PGridExport PVand PGridExport CHP). The power exchange with the grid is weighted according to the tariffs RImport(t) and RExport(t). In addition, the discharge of
the storage system is weighted with its levelized cost. The Levelized Cost of Storage (LCOS) relates the total lifecycle cost (TLCC) of the storage system (investment, maintenance and variable cost) to the energy provided. Assuming that the cycle life-time LCycleStorage is the limiting factor for the storage system, every charge- /discharge-cycle can be associated with a certain depreciation cost (equation (2)). EStorageCapacity refers to the nominal storage capacity and δ denotes the permissible depth of discharge. ) 1 ( −δ × × = Capacity Storage Cycle Storage E L TLCC LCOS (2)
By including these costs in the dispatch problem, the optimization will admit only those storage operations which are exceeding the investment and maintenance cost and therefore contribute to reduce the overall cost. The cost of PV or CHP installations as well as the grid connection fee are independent of the decision variables and therefore not considered in the optimal dispatch decision.
The dispatch problem is constrained by several limitations. Equation (3) ensures the balance of power, with
In Storage
P and PStorageOut referring to the charging and discharging of the storage system. Furthermore, if there is a limitation to the electricity injected in the network by the PV system (for
instance a legal limitation), then an additional variable PWaste
is required to represent the power which is down-regulated by the solar-controller. ) ( ) ( ) ( ) ( ) ( ) ( ) ( ) ( ) ( Import t P t P t P t P t P t P t P t P t P CHP PV Load Waste Out Storage In Storage CHP Export Grid PV Export Grid Grid − − − = + + + + + (3)
Equations (4) and (5) limit the state of charge to the feasible operating range (η represents the storage efficiency).
= = ≤ Δ × × + Δ × × T 1 t out Out Storage T 1 t in In Storage t t P t 1 t 0 P () η () η (4) ) 1 ( 1 ) ( ) ( 1 1 δ η η − × − ≥ Δ × × + Δ × ×
= = Capacity Storage T t out Out Storage T t in In Storage E t t P t t P (5)Equations (6) and (7) constrain power flows of the storage device to its maximum power rating.
Capacity Storage Out Storage t P P ()≤ (6) Capacity Storage In Storage t P P ()≥− (7)
Equations (8) and (9) ensure the correct direction of power flows for the variables.
0 t P t P Out Storage Import Grid (), ()≥ (8) 0 ) ( ), ( ), ( ), (t P t P t P t ≤
PGridExportPV GridExportCHP StorageIn Waste (9) Equation (10) ensures that electricity generated by the CHP and injected to the network does not exceed actual production. ) ( ) (t P t PGridExportCHP ≥− CHP (10)
Similarly, equation (11) ensure that the electricity injected in the network by the PV system does not exceed the actual production or the feed-in limitation.
) ), ( min( ) ( PV PVmax feed in PV Export Grid t P t P P ≥− − (11)
Last, equation (12) limits PWaste to the excess of PV
production regarding the feed-in limitation. ) ) ( ; max( ) ( PV PVmaxfeed in Waste t 0 P t P P ≥− − − (12)
Based on the dispatch from the optimization problem (1) - (12) and assuming that fixed costs are split evenly over the evaluation period, the resulting cash flows can then be calculated as indicated by equation (13).
)) ( ) ( ) ( ) ( ) ( ) ( ( ) ( Import Import t R t P t R t P t R t P t t CF Export CHP CHP Export Grid Export PV PV Export Grid Grid × + × + × × Δ − − = α (13)
= × + × + × + × × Δ = T t P t R t P t LCOS t R t P t R t P t1 CHPExport StorageOut
CHP Export Grid Export PV PV Export Grid Import Import Grid ) ) ( ) ( ) ( ) ( ) ( ) ( ) ( ( cost operating min (1)
The attributable system cost α for each period t are
defined by equation (14), with CFixed and CVariable representing
fixed and variable cost for the different systems. × + × Δ =
= = x PVCHP x Variable x Storage CHP PV x Fixed x C P C t , , , 8760 α (14)As the lifetime of the system components will regularly diverge from the evaluation horizon, their initial investment cost will be considered proportionally according to their calendric lifetime (equation (15)). Investment cost of storage systems are considered according to their cycle-lifetime, where N represents the number of equivalent charge- and discharge cycles. cycle Storage Invest Storage CHP PV x calendricx Invest x L N C L T C CF × − × × − =
= , 8760 ) 0 ( (15)The overall cost of energy supply for a building therefore
equals
=
− Tt CF t
0 ().
B. Optimal system configuration
The optimization problem presented in the previous section determines the optimal dispatch for a given system configuration. However, an investor considering an investment in storage is typically faced with the decision to determine the cost minimizing system configuration. This is oftentimes no longer a linear problem, e.g. due to decreasing per unit cost with increasing system capacities.
To determine the system configuration which minimizes cost, Simulated Annealing will be used. Simulated Annealing is a probabilistic based metaheuristic, which was originally proposed by Kirkpatrick et al. [8] to find the global minimum of a function which may have several local minima. Its general manner of operation follows the physical process of slowly cooling a solid material, whereby the atoms or molecules will arrange themselves in an energy minimizing configuration. The underlying idea of the algorithm is to admit moving sometimes to worse solutions during the process in order to introduce diversity and move away from local minima. Over time, the probability of accepting a worse solution decreases. Therefore, one of the big advantages of this approach is that it can move away from local optima to explore different areas of the search space. In addition, the search process can be easily adapted to specific problems. However, the algorithm does not necessarily identify the global optimum but rather a good quality solution in the sense that a more or less restricted convergence criterion is adopted. A high level overview of this search routine is given in Algorithm 1.
1. Generate a random start point (=system configuration)
2. Calculate its cost
3. Generate a random search point in the neighborhood of
the current location
4. Calculate the cost of the new search point
5. Compare the cost of the new search point and the
current location
a. Move to the new solution if the cost is lower
b. Otherwise: move to the new location with a
decreasing likelihood or reject it
6. Repeat steps 3-5, until a satisfactory solution has been
identified
Algorithm 1: Search process to determine the optimal system configuration The combination of the Simulated Annealing process and the Linear Program detailed before allows to identify the cost minimizing system configuration. The selection of the analyzed system design is done according to the Simulated Annealing process. The evaluation of each selected system configuration requires determining the optimal dispatch and the calculation of the resulting cash flows. Additional constraints, like a budget that cannot be exceeded, can be easily considered in the search.
III. CASE STUDY
To verify and illustrate the application of the developed approach, a case study considering a residential multi-family house located in Germany was implemented. Electricity tariffs for residential consumers are highest, hence they should benefit most from local generation and storage systems. A multi-family house was chosen for two reasons: first, cogeneration units benefit from economies of scale and hence very small scale systems are comparatively expensive. Second, the load-curve is typically much smoother than for single family houses, neglecting modelling errors due to lower data resolution as well as enabling a better match between local generation and demand. The optimization objective is to minimize the overall energy supply cost of the building.
A. Electric Demand
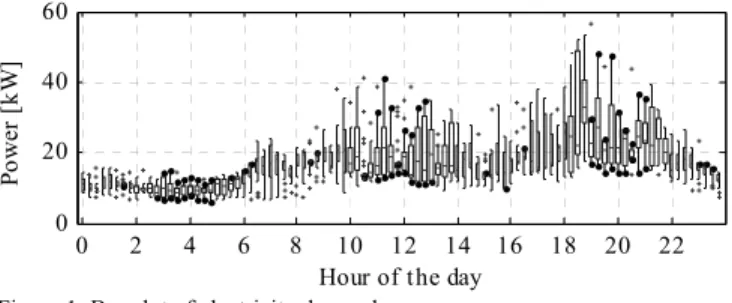
The assumed electricity consumption is based on the VDI guideline 4655, compiled by the Association of German Engineers [9]. It provides an aggregated reference load profile using a 15-minute resolution for multi-family houses with a mutual meter, considering fluctuating demand due to climatic, weekday and seasonal effects. The annual demand is set to 150.000 kWh / year. Figure 1 shows the demand variations along the 24 hours of the day. Over the course of a year, the demand was in excess of 50 kW during 181 periods (45hrs). The majority of time (62%), it was between 10 kW
and 20 kW. The tariff RImport(t) is 0.29 EUR / kWh for
Hour of the day Po w er [k W ] 0 2 4 6 8 10 12 14 16 18 20 22 0 20 40 60
Figure 1: Boxplot of electricity demand
B. Photovoltaic System
Photovoltaic systems convert solar energy into electricity. Their popularity in Germany as distributed generation technology was strongly supported by attractive feed-in tariffs, substantial investment cost reductions over the last few years as well as their easy integration into existing buildings. Historical 15 minute data for Berlin (Germany) for the year 2005 was used to compute photovoltaic generation
PPV(t) [10]. The data was scaled to the expected annual yield
of 950 kWh / kW [11]. Figure 2 shows the generation along the year. 1 2 3 4 5 6 7 8 9 10 11 12 0 4 8 12 16 20 Month H our of th e D ay 0W 200W 400W 600W 800W
Figure 2: Photovoltaic generation along the year for a 1kW installation The electricity from photovoltaic installations injected in the grids is paid according to the German renewable energy
act (EEG) [12]. RPVExport(t) is assumed to be 0.12 EUR / kWh.
The regulation requires a limitation of the maximum feed-in power to 70% of the installed capacity. Investment cost
Invest PV
C is assumed to be 1.350 EUR / kW, annual fixed fees
Fixed PV
C are 100 EUR + 25 EUR / kW. The lifetime Calendric
PV
L
of the panels is set to 20 years. The maximum installation
capacity PPVCapacity is limited to 50 kW.
C. Cogeneration System
Traditionally, heat in single- or multi-family houses is generated from oil or natural gas by a boiler. Combined heat and power plants achieve higher efficiencies by generating both electricity and heat. The heat, which is usually lost as waste heat in centralized power generation, is in this case used to satisfy local thermal demand. Systems for residential usage are usually automatically dispatched according to the thermal requirements and deliver electricity as by-product. To reduce cycling of the plant and cover short-term heat demand peaks, the plant is commonly equipped with a thermal storage and a traditional gas boiler.
The capacity of the cogeneration unit is chosen according to the thermal demand in order to maximize utilization. Therefore, when running the optimal system configuration
search problem, the decision is limited to include the CHP or not. In this case, a cogeneration unit with 33 kW thermal and
16 kW electric output (PCHPCapacity) was found suitable.
The dispatch of the CHP and therefore the electricity generation is determined by the hot water and heating demands. Apart from data for electric demand, VDI guideline 4655 [9] also provides data for thermal demand. The resulting dispatch of the cogeneration unit and therefore the electricity generation is shown in Figure 3.
1 2 3 4 5 6 7 8 9 10 11 12 0 4 8 12 16 20 Month Ho ur o f t he Da y 0kW 4kW 8kW 12kW 16kW
Figure 3: Generation of the cogeneration unit along the year
The injection of electricity generated by cogeneration into the grids is regulated by the Combined Heat and Power Act (KWKG) [13] and in this study we assumed a compensation
) (t
RCHPExport of 0.035 EUR / kWh. Cost for the cogeneration unit, thermal storage component and installation amount to
50.000 EUR (CCHPInvest). Fixed annual cost mainly for
maintenance and repair is estimated at 5.000 EUR (CCHPFixed).
Due to an incentive system, variable operating cost attributable to the electricity generation effectively become
negative, estimated at -0.0141 EUR / kWh (CCHPVariable). The
calendric lifetime of the system (LCalendricCHP ) is limited to 12
years, approximately equivalent to the period of incentive payments (60.000 operating hours).
D. Storage
A generic storage system is assumed, resembling the characteristics of a lithium-ion battery. The battery can have a
capacity of up to 100 kWh (EStorageCapacity), however the
maximum depth of discharge is limited to 20% (δ ).
Maximum charge- / and discharge powers PStoragemax are
assumed to be limited to ¼ of the capacity and independent of the current charging state. Charge- and discharge efficiency η are assumed to be 95% each, resulting in an overall efficiency of 90.25%. Self-discharge is neglected. The expected cycle
lifetime LCycleis assumed to be 5.000 cycles.
The installation cost for the storage system shows that a scale effect exists due to the cost for planning and installation, battery management system as well as inverter. A cost of 3.000 EUR plus 500 EUR for each installed kWh of
capacity was assumed (CStorageInvest ). Fixed costs for maintenance
and insurance were assumed to be 10 EUR per installed kWh
IV. RESULTS
A. Reference case
Under the reference case, no system is assumed to be installed. Hence, the annual energy demand of 150,000 kWh is completely satisfied by the grid. Under the assumed flat tariff, the annual cost would amount to EUR 43,500.
B. Storage and PV
The feed-in tariff for photovoltaic generation is significantly below the regular consumption tariff. However, the difference is not yet sufficient to justify an investment in storage. The cost minimizing solution is the installation of the maximum photovoltaic capacity (50 kW) and no storage. Despite showing decreasing returns with scale (the first installed solar panel is the most profitable one, as almost all energy can be consumed locally), the generation cost of photovoltaic installations is below the feed-in tariff. Overall annual cost including the depreciation charges for the PV installations would be 36,261 EUR, a benefit of 7,239 EUR regarding the annual cost of the reference case.
C. Storage and cogeneration
The feed-in remuneration for electricity generated by cogeneration is considerably below the photovoltaic feed-in tariff. The wider spread provides a favorable setting for storage. The cost minimizing configuration is to install the cogeneration unit combined with a storage capacity of 18.6 kWh. The total annual cost would be reduced to 27,013 EUR, a benefit of 16,487 EUR. However, most of that benefit is due to the CHP installation, which alone would result in an annual cost of 27,215 EUR. Hence, the storage installation reduced the annual cost by an additional 202 EUR.
D. Storage, PV and cogeneration
The results closely resemble the previous case of storage with a cogeneration unit, complemented with a photovoltaic system. The optimal system configuration includes a storage system with 17.9 kWh, the installation of the cogeneration plant with 16 kW electric power and the addition of 50 kW of solar generation. The operation of the storage system is only minimally impacted, as it is under the assumed cost structure still preferable to feed the energy from the photovoltaic system into the grid and take it back later, as the cycle-based levelized cost of storage is still higher than the spread between photovoltaic feed-in and consumption tariff. The total cost would be reduced to 22,984 EUR in this case.
V. CONCLUSIONS AND FUTURE WORK
The economic viability of storage installations in several system configurations for a multi-family house located in Germany was analyzed in this paper. Overall, it was found that storage is still too expensive to incentivize a wide-scale investment. In the case of photovoltaic generation, it was found that it is still preferential to inject energy into the grid instead of storing it for later self-consumption, as the feed-in remuneration compared to consumption tariffs is still
sufficiently attractive. An increasing spread between feed-in and consumption tariff would change this and storage might be deployed with economic merit. Storage was found to be economically today only in combination with cogeneration systems. Due to the much lower feed-in tariff as compared to solar generation, storing the energy for later consumption is more interesting and outweighs storage cost. However, even in this case, the value added by storage was found to be still very limited.
The developed study has a range of limitations, which could be entry points for future research. First, the impact of assuming perfect knowledge in the Linear Program should be analyzed. In a real world environment, e.g. future PV generation can only be estimated. Second, it was assumed that the cogeneration unit is dispatched according to thermal needs. However, using thermal storage, active influence can be taken on the generation of the cogeneration unit. Last, the analysis is based on today’s prices and a reference load profile. A sensitivity analysis with respect to the assumed parameters would provide a better understanding about the drivers of storage profitability. Using actual consumption data would increase the confidence about the obtained results.
ACKNOWLEDGMENT
The first author would like to thank Fundação para a Ciência e Tecnologia, FCT, that partially funded this research work through the PhD grant no PD/BD/105848/2014.
REFERENCES
[1] UNFCCC. Conference of the Parties (COP), “Adoption of the Paris Agreement. Proposal by the President.,” Geneva, Switzerland, 2015. [2] European Commission, “Energy Roadmap 2050,” Brussels, Belgium,
2011.
[3] Eurostat, “Electricity prices for domestic consumers - bi-annual data (from 2007 onwards),” 2015. [Online]. Available:
http://ec.europa.eu/eurostat/data/database#. [Accessed: 01-Jan-2016]. [4] J. Weniger, T. Tjaden, and V. Quaschning, “Sizing of Residential PV
Battery Systems,” Energy Procedia, vol. 46, pp. 78–87, 2014. [5] C. Werner, C. Breyer, A. Gerlach, and O. Beckel, “Photovoltaic With
Energy Storage: An Overview On Economics, System Design And Politics,” in 27th European Photovoltaic Solar Energy Conference, 2012.
[6] G. Mulder, D. Six, B. Claessens, T. Broes, N. Omar, and J. Van Mierlo, “The dimensioning of PV-battery systems depending on the incentive and selling price conditions,” Appl. Energy, vol. 111, pp. 1126–1135, Nov. 2013.
[7] A. U. Schmiegel and A. Kleine, “Optimized Operation Strategies for PV Storages Systems Yield Limitations, Optimized Battery Configuration and the Benefit of a Perfect Forecast,” Energy Procedia, vol. 46, pp. 104–113, 2014.
[8] S. Kirkpatrick, C. D. Gelatt, and M. P. Vecchi, “Optimization by Simulated Annealing,” Science, vol. 220, no. 4598, pp. 671–680, 1983. [9] G. Dubielzig, Referenzlastprofile von Ein- und Mehrfamilienhäusern für
den Einsatz von KWK-Anlagen. Düsseldorf: VDI Verlag, 2007. [10] “SoDa - Free time-series of solar radiation data.” [Online]. Available:
http://www.soda-is.com/eng/services/services_radiation_free_eng.php. [11] “JRC’s Institute for Energy and Transport - PVGIS - European
Commission.” [Online]. Available: http://re.jrc.ec.europa.eu/pvgis/. [12] German Federal Law Gazette, Renewable Energy Sources Act (EEG).
2014.
[13] German Federal Law Gazette, Act on the Retention, Modernisation and Extension of Combined Heat and Power Generation (KWKG). 2002.