P
REDICTORS OFR
EDF
OX(V
ULPES VULPES) H
ELMINTHP
ARASITED
IVERSITY IN THEP
ROVINCES OFS
PAINA.M. Barbosa
1*, J.M. Segovia
2, J.M. Vargas
1, J. Torres
2, R. Real
1& J. Miquel
2 1Grupo de Biogeografía, Diversidad y Conservación, Departamento de Biología Animal, Facultad de Ciencias, Universidad de Málaga, E-29071 Málaga, Spain2Unitat de Parasitologia, Departament de Microbiologia i Parasitologia Sanitàries, Facultat de Farmacia, Universitat de Barcelona, Avda. Joan XXVIII s/n, E-08028 Barcelona, Spain
*Corresponding author. E-mail: [email protected]
Introduction
Understanding the factors that determine the diversity of parasite communities is an
important problem in ecology, as parasites have a significant effect on the structure
and stability of natural communities [1-3]. Hence, identifying the factors that
govern parasite occurrence is critical for managing wild populations and mitigating
risks to human and domestic animal health [4].
The red fox (Vulpes vulpes L., 1758) is the most widespread and abundant wild
carnivore inhabiting Spain, as it occurs practically all over its continental territory.
This canid is also broadly spread in the rest of the European continent, although the
form that inhabits the Iberian Peninsula is considered an endemic subspecies, V. v.
s i l a c e a M i l l e r, 1907, whose northern distribution limit is the Pyrenean mountain
range [5,6]. The red fox is an opportunistic carnivore with a broad food spectrum
that includes small and medium-sized mammals and birds, invertebrates, fruits,
carrion, and rubbish [6,7]. It is often associated with human population nuclei, as it
finds abundant and easily available food supplies in rubbish dumps and livestock
Abstract
We analysed the viscera of 321 red foxes collected over the last 30 years in 34 of the 47 provinces of peninsular Spain, and identified their helminth parasites. We measured parasite diversity in each sampled province using four diversity indices: Species richness, Marg a l e f’s species richness index, Shannon’s species diversity index, and inverse Simpson’s index. In order to find geographical, environmental, and/or human-related predictors of fox parasite diversity, we recorded 45 variables related to topography, climate, lithology, habitat heterogeneity, land use, spatial situation, human activity, sampling effort, and fox presence probability (obtained after environmental modelling of fox distribution). We then performed a stepwise linear regression of each diversity index on these variables, to find a minimal subset of statistically significant variables that account for the variation in each diversity index. We found that most parasite diversity indices increase with the mean distance to urban centres, or in other words, foxes in more rural provinces have a more diverse helminth fauna. Sampling effort and fox presence probability (probably related to fox density) also appeared as conditioning variables for some indices, as well as soil permeability (related with water availability). We then extrapolated the models to predict these fox parasite diversity indices in non-sampled provinces and have a view of their geographical trends. Keywords Diversity indices, geographical trends, human influence, variation partitioning.
ORIGINAL PAPER
carrion. It is also a game species, the main vector of rabies in Europe [8], and a
reservoir host to numerous helminth species that are parasites of the domestic dog,
the wolf and, in some cases, humans [9].
The endoparasitic helminthfauna of V. vulpes is reasonably well characterized
throughout Europe [10-15]. Several studies have also addressed the helminthfauna
of V. vulpes in several areas of the Iberian Peninsula [9,16-19]. More recently, an
ecological analysis of the helminth fauna of the red fox throughout most of Spain,
Andorra, and the Malcata Natural Park (Portugal) was published [20].
Our aims were to measure the diversity of red fox helminth parasites in a number
of sampled provinces of Spain, using different diversity indices; to find
geographical, environmental, and/or human-related predictors of this diversity; and
to predict parasite diversity in all of the Spanish provinces and have an overview of
its geographical trends.
M e t h o d s
The study area, peninsular Spain, covers approximately 493,000 km
2, nearly 85%
of the Iberian Peninsula, in the southwestern end of Europe. It has heterogeneous
climate and orography, and a patent peninsular character, as the isthmus that
connects it with the rest of the European continent is relatively narrow (about
two-fifths of its northern border) and is crossed by the Pyrenees, which complicate
biotic and abiotic exchanges with the adjacent territories.
Peninsular Spain is divided into 47 administrative provinces with surface areas
ranging from 2,000 to 22,000 km
2approximately (mean area ≈ 10,500 km
2). T h e
use of political territory divisions as a basis for biogeographical studies is
sometimes criticized, but these provinces have been considered the best lattice for
obtaining biotic regionalisations for ferns in Spain when compared to river basins,
natural regions, physiographic and geological regions, and mountains and plains
[21]. Besides, human activity patterns, whose influence on fox parasite diversity we
also intended to analyze, often are shaped by political limits, and most of the
variables that reflect them are only available on a political-unit basis. Political
territorial units have been used successfully in a number of other biogeographical
studies [22-24].
O fficial institutions provided the viscera of 321 red foxes collected over the last 30
years in 34 of the 47 provinces of peninsular Spain. We systematically checked all
viscera of each individual for helminth parasites using standard helminthological
methods. All helminths found were removed and processed according to the
species, and identified on the basis of previous descriptions. All aspects concerning
the methodology employed have been previously described in detail [20].
We calculated four indices of parasite infection diversity for each sampled
province. Indices were calculated as described in the literature [25] using the
number of infections (one infection = presence of one parasite species in one
individual of red fox) instead of the number of individuals of each parasite species,
in order to avoid over-representation of species with greater parasite intensity in the
diversity indices.
The indices used were:
a) Species richness:
S = number of species;
b) Margalef’s species richness index:
where S is the number of parasite species and n is the total number of infections;
c) Shannon’s species diversity index:
H’ = -Σpi . ln(pi),
where pi is the proportion of infections by species i in the total of infections;
d) Inverse Simpson’s index:
where p
iis the same as in Shannon’s index.
In order to find out the factors that best predict the diversity of red fox helminth
parasites in the Spanish provinces, we recorded a series of variables related with
topography, climate, lithology, habitat heterogeneity, land use, spatial situation, and
human activity. We also included sampling effort (in the form of number of foxes
analysed) and fox presence probability (related with fox abundance and density; see
Discussion for details), to find out if these factors produced an effect on the diversity
of parasites observed. The 45 variables used and their sources are listed in Table 1.
Table 1. Variables used to model the diversity of red fox (Vulpes vulpes) helminth parasites in
the administrative provinces of peninsular Spain.
R =
S - 1
,
ln (n)
1
=
1
,
D
Σ(p
i)
2 Code VariableAlti* Mean altitude (m) [26]
AMax Maximum altitude (m)
AMin Minimum altitude (m)
AltR* Altitude range (m) (= AMax-AMin)
Slop* Slope (degrees) (calculated from Alti)
HJan* Mean relative air humidity in January at 07:00 hours (%) [27,28]
HJul* Mean relative air humidity in July at 07:00 hours (%) [27,28]
HRan* Annual relative air humidity range (%) (= |HJan-HJul|)
PET* Mean annual potential evapotranspiration (mm) [27,28]
AET* Mean annual actual evapotranspiration (mm) (= min (PET; Prec))
Inso* Mean annual insolation (hours/year) [27,28]
SRad* Mean annual solar radiation (kwh/m2/day) [27,28]
TJan* Mean temperature in January (ºC) [27,28]
TJul* Mean temperature in July (ºC) [27,28]
Temp* Mean annual temperature (ºC) [27,28]
TRan* Annual temperature range (ºC) (= TJul-TJan)
DFro* Mean annual number of frost days (minimum temperature ≤ 0ºC) [27,28]
DPre* Mean annual number of days with precipitation ≥ 0,1 mm [27,28]
Prec* Mean annual precipitation (mm) [27,28]
MP24* Maximum precipitation in 24 hours (mm) [27,28]
Table 1 (Cont.)
Isoline variables (H J a n through L o n g) were digitized using CartaLinx 1.2, and isoline
vertices were interpolated in Idrisi32 from a triangulated irregular network performing
parabolic bridge and tunnel edge removal. Secondary variables, defined in Table 1 by
an algebraic operation in parentheses, were calculated from primary variables using
the Idrisi Image Calculator. Perm was obtained from a categorical map of synthesis of
ground-water aquifers with three different degrees of soil permeability. We determined
Perm by calculating the mean of the permeability values assigned to all pixels within
each province. Distance variables (D H i through D P y r) were calculated using the Idrisi
D I S TANCE module. Density and percentage data (H P D through P a s t) were calculated
dividing the absolute values obtained from the literature by the area of each province.
Fox presence probability was calculated by logistic regression of presence/absence
data (taken from [39]) on a set of environmental, spatial, and human-related variables,
using UTM 10x10-km squares as operational geographic units. We extrapolated the
logistic regression model to 1x1 km squares, and then calculated mean fox presence
probability for each province. The methodology used to obtain and extrapolate fox
presence probability has been described for the European otter [40].
We then performed a stepwise linear regression of each diversity index on the 45
variables, to find a minimal subset of statistically significant variables that account for
the variation in fox parasite diversity. Interactions between factors often result in an
overlaid effect in space, so the sum of the amounts of variation explained by each
Code Variable
Cont Continentality index [28]
Humi Humidity index [28]
PIrr* Pluviometric irregularity [29]
ROff* Mean annual run-off (mm) [30]
Lati* Latitude (degrees N) [31]
Long* Longitude (degrees E) [31]
Perm* Soil permeability [30]
DHi* Mean distance to the nearest highway (km) [31]
U100* Mean distance to the nearest town with more than 100,000 inhabitants (km) [31,32]
U500* Mean distance to the nearest town with more than 500,000 inhabitants (km) [31,32]
DPyr Mean distance to the Pyrenees (km)
NFlo Number of bioclimatic floors [33]
NReg Number of fitogeographic regions [33]
HPD Human population density (inhabitants/km2) [34]
Indu Industry density (factories/km2) [35]
HDen Highway density (m/km2) [36]
RDen Regular road density (m/km2) [36]
HRD Highway+road density (m/km2) [36]
VDen Vehicle density (vehicles/km2) [37]
Wood Woodland area (%) [36]
Crop Cropland area (%) [38]
Past Pasture area (%) [38]
SEff Sampling effort (number of infected foxes analysed)
variable included in a model is usually different from the total amount explained by
the whole model [41,42]. Consequently, in the cases where more than one variable
entered the regression equation, we performed a Partial Regression Analysis [42], a
variance partitioning procedure designed to specify how much of the variation in
diversity explained by each of the variables corresponds to its pure effect, and which
proportions are attributable to interactions between variables.
R e s u l t s
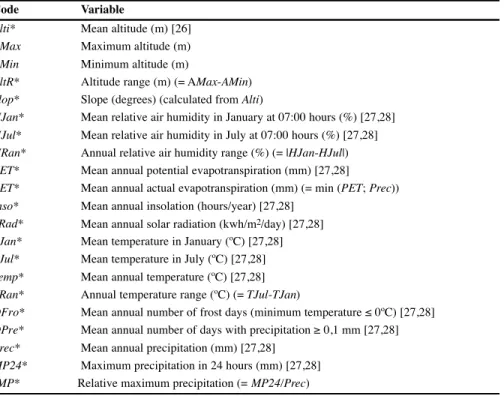
We found 34 helminth parasite species in the foxes analysed (Table 2). The diversity
indices obtained for the 34 sampled provinces are represented in Figure 1.
Table 2: Helminth parasite species found in the red foxes analysed, and the number of
provinces (N) in which each of them was recorded (total number of analysed provinces = 34).
Group and species N
TREMATODA Alaria alata 4 Brachylaima sp. 3 Metorchis bilis 2 Opistorchis felineus 1 CESTODA Taenia crassiceps 6 T. hydatigena 3 T. polyacantha 12 T. taeniaeformis 1 T. pisiformis 8 Joyeuxiella pasqualei 6 J. echinorhynchoides 9 Diplopylidium noelleri 1 Mesocestoides sp. 24 NEMATODA Aonchotheca putorii 1 Eucoleus aerophilus 22 Pearsonema plica 14 Trichuris vulpis 7 Dirofilaria immitis 1 Toxocara canis 19 T. cati 1 Toxascaris leonina 21 Strongyloides sp. 1 Uncinaria stenocephala 23 Vigisospirura potekhinae 1 Angiostrongylus vasorum 13 Crenosoma vulpis 16 Pterygodermatites affinis 23 Molineus patens 3 M. legerae 3 Physaloptera sibirica 8 Cyathospirura sp. 1 Spirocerca lupi 7 Mastophorus muris 2 ACANTHOCEPHALA Macracanthorhynchus catulinus 2
Fig. 1. Diversity indices obtained for the helminth parasites of red fox (Vulpes vulpes) in the
administrative provinces of peninsular Spain. Formulas are shown in the text. Only the
sampled provinces are displayed.
The stepwise logistic regression of fox presence/absence data [39] on the variables
marked in Table 1 yielded the following model:
FPP = 1 - (1 / (1 + EXP (2.29 - 0.00060 Alti + 0.010 Area + 0.0012 AltR + 0.0057
DHi + 0.24 Long + 0.41 Perm - 0.12 TJul - 0.010 U100 + 0.0019 U500 + 0.035
HRan)))
Fox presence probability on 10x10-km squares is shown in Figure 2.
0.00 0.06 0.13 0.19 0.25 0.31 0.38 0.44 0.50 0.56 0.63 0.69 0.75 0.81 0.88 0.94 1.00 1.00 2.13 3.25 4.38 5.50 6.63 7.75 8.88 10.00 11.13 12.25 13.38 14.50 15.63 16.75 17.88 19.00 1.44 1.64 1.83 2.02 2.21 2.41 2.60 2.79 2.99 3.18 3.37 3.56 3.76 3.95 4.14 4.34 4.53 1.00 1.63 2.25 2.88 3.50 4.13 4.75 5.38 6.00 6.63 7.25 7.88 8.50 9.13 9.75 10.38 11.00 0.00 0.16 0.32 0.48 0.64 0.80 0.96 1.12 1.28 1.44 1.60 1.76 1.92 2.08 2.24 2.40 2.56
Fig. 2. Red fox (Vulpes vulpes)
presence probability on the UTM
10x10-km squares of peninsular
Spain, given by logistic regression of
fox presence/absence data [39] on a
series of predictor variables (Table 1).
The stepwise linear regressions of the parasite diversity indices on the variables
listed in Table 1 yielded the following equations:
Species richness = 2.43 + 0.14 SEff + 0.078 U100
R
2= 0.548; p < 0,001
Margalef’s index = 1.91 + 0.017 U100
R
2= 0.234; p = 0.005
Shannon’s index = -1.001 + 4.33 FPP – 0.56 Perm
R
2= 0.281; p = 0.006
Simpson’s index = 3.46 + 0.049 U100
R
2= 0.170; p = 0.016
The predicted values for each diversity index, according to the regression models
obtained, for all peninsular Spanish provinces are shown in Figure 3.
Fig. 3. Predicted values for each fox parasite diversity index in all administrative provinces of
peninsular Spain.
The results of the variance partitioning for species richness and for Shannon’s
diversity index are summarized in Figure 4. Over 40% of the variation in species
richness (S) was explained solely by sampling effort, whereas ca. 14% was
attributed to the distance to urban centres. The total amount of variation explained
by the model (R
2), ≈ 55%, is lower than the sum of the amounts of variation
2.23 2.32 2.41 2.51 2.60 2.70 2.79 2.88 2.98 3.07 3.17 3.26 3.36 3.45 3.54 3.64 3.73 4.37 4.65 4.94 5.23 5.52 5.81 6.10 6.38 6.67 6.96 7.25 7.54 7.83 8.11 8.40 8.69 8.98 0.80 0.91 1.01 1.11 1.21 1.31 1.41 1.51 1.61 1.71 1.81 1.91 2.01 2.11 2.21 2.31 2.41 4.35 5.45 6.55 7.65 8.76 9.86 10.96 12.06 13.17 14.27 15.37 16.47 17.57 18.68 19.78 20.88 21.98
explained exclusively by each of the two variables and, consequently, the shared
effect of both variables on species richness is negative. For Shannon’s diversity
index (H’), 20% of the variation is due exclusively to fox presence probability, and
13% to soil permeability, with a negative shared effect.
Fig. 4. Results of the variance partitioning procedure for species richness (S) and for
Shannon’s diversity index (H’) of fox helminth parasites. Values in the diagrams are the
proportions of the variation attributable to the pure effect of each of the variables included in
the stepwise regression model, and to the interaction between their effects. Variable codes as
in Table 1.
Discussion
The predicted geographical variations in Margalef’s and Simpson’s indices are
remarkably similar, as the distance to urban centres was the only variable selected
for both models. Species richness is predicted by the same variable but also by
sampling effort, so there are common traits between the geographical trends
observed, but a clear effect of the differences in sampling effort is noticed. In
contrast, Shannons’ index is predicted by two other variables and thus exhibits
different geographical trends.
Parasite species richness has been previously related with factors such as host
density, host diet, and habitat diversity, among others (e.g. [4,43,44]). It is also
strongly conditioned by sampling effort [45-47]. In a study of parasite diversity of
Iberian rodents, species richness was found to correlate only with host sample size
[48]. In our study, no diversity measure was sufficiently explained by sampling
effort. Although sampling effort does significantly affect the total number of parasite
species found, the mean distance to urban centres was also selected as a significant
variable. This is particularly important, since sampling effort is negatively correlated
with the distance to urban centres (Pearson’s correlation, r=-0.07), which is why the
variation in S explained simultaneously by SEff and U100 is negative (see Fig. 4).
0.437
0.142
-0.031
SEff
U100
S
0.200
0.129
-0.048
FPP
Perm
H’
From a mathematical point of view, when some of the relations among multiple
variables are negative, the magnitude of co-variation may be limited by the positive
semi-definite (PSD) criterion, which is a property of all correlation matrices that
constrains all eigenvalues and the determinant of each principal minor in a
correlation matrix to values greater than or equal to zero [49]. In a system with three
variables where two of the correlations are positive and one is negative, as it is the
case here, an implication of the PSD criterion is that the shared effect of two of the
variables on the other one is negative (e.g. [24,50]). In other words, sampling effort
and distance to urban centres cause fox parasite diversity to vary in divergent
directions. The pure effect of U100 on S (Fig. 4), which can be obtained by using the
residuals of the regression of parasite species richness on the number of foxes
analysed as the target variable [41,42,51], is then higher than the effect attributable
to U100 regardless of the sampling effort. The importance of the distance to urban
centres is also highlighted by the fact that it is the only variable which significantly
explains both Margalef’s and Simpson’s indices. A higher mean distance to urban
centres characterizes predominantly rural provinces. The fact that fox parasite
diversity is higher in rural environments can be partially attributed to a possible
higher diversity of intermediate and paratenic host species that can transmit more
parasite species to foxes [52]. On the other hand, in the vicinity of urban centres,
foxes feed largely on rubbish and less on potential intermediate or paratenic hosts
[53], thus decreasing transmission of parasite species by prey.
Shannon’s index, however, is best predicted by fox presence probability, which can
be roughly related to fox abundance or density [54], and by soil permeability. Host
density is often considered a key factor affecting parasite species richness [3,4,43],
due to its positive effect on the transmission rates of monoxenous parasites.
However, its effect can be masked by the existence of heteroxenous species among
the parasite community under study, since their diversity is affected not only by the
density of the final host but also by those of the intermediate ones [3]. Soil
permeability has a negative effect on Shannon’s diversity index (r=-0.27), even
when it correlates positively with fox presence probability (r=0.179), which in turn
affects Shannon’s diversity index positively. Soil permeability is negatively related
with superficial freshwater availability (more permeable substrates retain less
water), which may be an important conditioning factor for many of these parasites
or their intermediate hosts, thus conditioning parasite diversity as well. Significant
differences have been detected among the fox parasite communities of two different
types of habitat within the Ebro valley (E Spain), as some helminth species seemed
to prefer irrigated lands, while others selected semiarid ones [6].
A further development of this work will be to search for differences in the predictors
and geographical trends of the diversity of parasites with different types of life cycle,
separating monoxenous species from those that use different groups of intermediate
hosts (e.g. vertebrates vs. invertebrates).
Acknowledgments
We thank the official institutions that provided the foxes, and all the people involved in field sample collection and in laboratory analyses. This work was partially supported by projects BOS 2000-0570-C02-01 and REN 2003-02471/GLO (Ministerio de Ciencia y Tecnología, Spain). A. M. Barbosa’s research is financed by a doctoral grant (SFRH/BD/4601/2001) from Fundação para a Ciência e a Tecnologia, Portugal.
References
1. Anderson, R.M. & May, R.M. 1978. Regulation and stability of host-parasite interactions. I. Regulatory processes. J. Anim. Ecol. 47: 219-247.
2. May, R.M. & Anderson, R.M. 1978. Regulation and stability of host-parasite interactions. II. Destabilizing processes. J. Anim. Ecol. 47: 249-267.
3. Arneberg, P. 2002. Host population density and body mass as determinants of species richness in parasite communities: comparative analyses of directly transmitted nematodes in mammals. Ecography 25: 88-94.
4. Nunn, C.L., Altizer, S., Jones, K.E. & Sechrest, W. 2003. Comparative test of parasite species richness in primates. Am. Nat. 162: 597-614.
5. García-Perea, R. & Gisbert, J. 1997. Lista patrón de los mamíferos de la Península Ibérica, islas Baleares y Canarias. (Standard list of the mammals of the Iberian Peninsula and the Balearic and Canary Islands). Galemys 9 (NE): 1-38.
6. Gortázar, C. 2002. Vulpes vulpes (Linnaeus, 1758). In: Palomo, L.J. & Gisbert, J. (eds.), Atlas de los mamíferos terrestres de España. (Atlas of the terrestrial mammals of Spain). Dirección General de Conservación de la Naturaleza-SECEM-SECEMU, Madrid, pp. 242-245.
7. Blanco, J.C. 1995. El zorro. (The fox). Boletín de la SECEM 6: 4-11.
8. MacDonald, D.W. & Voigt, D.R. 1985. The biological basis of rabies models. In: Bacon, P. J. (ed.), Population dynamics of rabies in wildlife. Academic Press, London, pp. 71-108.
9. Gortázar, C., Villafuerte, R., Lucientes, J. & Fernández de Luco, D. 1998. Habitat related differences in helmith parasites of red foxes in the Ebro valley. Vet. Parasitol. 80: 75-81.
10. Pétavy A.F., Deblock S., Contat F., Gilot B. 1985. Le renard et ses helminthes en France. (The fox and its helminths in France). Rev. .Ecol.-Terre Vie 40: 231-238.
11. Steinbach, G. 1993. Nematode and trematode fauna of red foxes in southern Lower Saxony, Germany. PhD Thesis, Institut fur Parasitologie der Tierarztlichen Hochschule Hannover.
12. Richards D.T., Harris S., Lewis J.W. 1995. Epidemiological studies on intestestinal helminth parasites of rural and urban red foxes (Vulpes vulpes) in the United Kindom. Vet. Parasitol. 59: 39-51. 13. Willingham, A.L., Ockens, N.W., Kapel, C.M. & Monrad, J. 1996. A helminthological survey of wild
red foxes (Vulpes vulpes) from the metropolitan area of Copenhagen. Vet. Parasitol. 70: 259-263. 14. Papadopoulos H., Himonas C., Papazahariadou M. & Antoniadou-Sotiriadou K. 1997. Helminths of
foxes and other wild carnivores from rural areas in Greece. J. Helminthol. 71: 227-231.
15. Wolfe, A., Hogan, S., Maguire, D., Fitzpatrick, C., Vaughan, L., Wall, D., Hayden, T.J. & Mulcahy, G. 2001. Red foxes (Vulpes vulpes) in Ireland as hosts for parasites of potential zoonotic and veterinary significance. Vet. Rec. 149: 759-763.
16. Simón Vicente, F. 1975. Helmintofauna parasitaria de Vulpes vulpes y Genetta genetta en áreas del Oeste de la meseta norte de España. (Parasite helminth fauna of Vulpes vulpes and Genetta genetta in areas of the west of the northern plateau of Spain). XII Congresso da União Internacional de Biologia da Caça 6 (Patologia da Fauna Selvagem): 279-282.
17. Carvalho-Varela, M. & Marcos, M.V.M. 1993. A helmintofauna da raposa (Vulpes vulpes silacea Millar, 1907) em Portugal. (Helminth fauna of the fox (Vulpes vulpes silacea Millar, 1907) in Portugal). Acta Parasitologica Portuguesa 1: 73-79.
18. Feliu, C., Miquel, J., Casanova, J.C., Torres, J., Segovia, J.M., Fons, R. & Ruiz-Olmo, J. 1996. Helminth faunas of wild carnivores in the Montseny Massif; an atypical ecosystem in the northeast of the Iberian Peninsula. Vie Milieu 46: 327–332.
19. Criado-Fornelio, A., Gutiérrez-García, L., Rodríguez-Caabeiro, F., Reus-García, E., Roldán-Soriano, M.A. & Díaz-Sánchez, M.A. 2000. A parasitological survey of wild red foxes (Vulpes vulpes) from the province of Gualadajara, Spain. Vet. Parasitol. 92: 245-251.
20. Segovia, J.M., Torres, J., Miquel, J. & Feliu, C. 2004. Helminthoecological study of the red fox in the Iberian Peninsula. Acta Parasitol. 49: 67-79.
21. Márquez, A.L., Real, R., & Vargas, J.M. 2001. Methods for comparison of biotic regionalizations: the case of pteridophytes in the Iberian Peninsula. Ecography 24: 659-670.
22. Baroni-Urbani, C. & Collingwood, C.A. 1976. A numerical analysis of the distribution of British Formicidae (Hymenoptera, Aculeata). Verhandl. Naturf. Ges. Basel 85: 51-91.
23. Barbosa, A.M., Real, R., Márquez, A.L. & Rendón, M.A. 2001. Spatial, environmental and human influences on the distribution of otter (Lutra lutra) in the Spanish provinces. Divers. Distrib. 7: 137-144. 24. Real, R., Barbosa, A.M., Porras, D., Kin, M.S., Márquez, A.L., Guerrero, J.C., Palomo, L.J., Justo E.R. & Vargas, J.M. 2003. Relative importance of environment, human activity and spatial situation in determining the distribution of terrestrial mammal diversity in Argentina. J. Biogeogr. 30: 939-947. 25. Magurran A.E. 1989. Diversidad ecológica y su medición. (Ecological diversity and its measuring).
Vedrà Publishing, Barcelona.
26. U. S. Geological Survey. 1996. GTOPO30. In: Land Processes Distributed Active Archive Center (LP DAAC), EROS Data Center. http://edcdaac.usgs.gov/gtopo30/gtopo30.asp. Cited 22 Sep 1999. 27. Font, I. 1983. Atlas climático de España. (Climatic atlas of Spain). Instituto Nacional de
Meteorología, Madrid.
28. Font, I. 2000. Climatología de España y Portugal. (Climatology of Spain and Portugal). 2nd edition. Ediciones Universidad de Salamanca, Salamanca.
29. Montero de Burgos, J.L. & González-Rebollar, J.L. 1974. Diagramas bioclimáticos. (Bioclimatic diagrams). ICONA, Madrid.
30. I.G.M.E. 1979. Mapa hidrogeológico nacional. Explicación de los mapas de lluvia útil, de reconocimiento hidrogeológico y de síntesis de los sistemas acuíferos. (National hydrogeological map. Explanation of the maps of run-off, hydrogeologic assessment and synthesis of groundwater aquifers) 2nd ed. Instituto Geológico y Minero de España, Madrid.
31. I.G.N. 1999. Mapa de carreteras. Península Ibérica, Baleares y Canarias. (Road map. Iberian Peninsula and Balearic and Canary Islands). Instituto Geográfico Nacional / Ministerio de Fomento, Madrid. 32. Instituto Nacional de Estadística, 1999. Padrón municipal: cifras oficiales de población desde 1996.
(Municipal population: official population numbers since 1996). In: Cifras de población. http://www.ine.es. Cited 15 Jul 1999.
33. Rivas-Martínez, S. 1985 Biogeografía y vegetación. (Biogeography and vegetation). RACEFN, Madrid.
34. Instituto Nacional de Estadística, 1999. Población de hecho. (Actual population). In: Demografía y población. (Demography and population). http://www.ine.es. Cited 19 Oct 1999.
35. Instituto Nacional de Estadística, 1999. Encuesta industrial de empresas. (Industrial enterprise survey). In: Industria y construcción. (Industry and building). http://www.ine.es. Cited 19 Oct 1999. 36. Instituto Nacional de Estadística. 1999. Anuario estadístico de España, año 1998. (Statistical annuary
of Spain, year 1998) . I.N.E., Madrid.
37. Dirección General de Tráfico. 1996. Anuario estadístico general 1996. (General statistical annuary 1996). D.G.T., Ministerio del Interior, Madrid.
38. Instituto Nacional de Estadística. 1996. Anuario estadístico de España, año 1995. (Statistical annuary of Spain, year 1995). I.N.E., Madrid.
39. Palomo, L.J. and Gisbert, J. 2002. Atlas de los mamíferos terrestres de España. (Atlas of the terrestrial mammals of Spain). Dirección General de Conservación de la Naturaleza-SECEM-SECEMU, Madrid.
40. Barbosa, A. M., Real, R., Olivero, J. & Va rgas, J. M. 2003. Otter (Lutra lutra) distribution modeling at two resolution scales suited to conservation planning in the Iberian Peninsula. Biol. Conser. 114: 377-387.
41. Borcard, D., Legendre, P. & Drapeau, P. 1992. Partialling out the spatial component of ecological variation. Ecology 73: 1045-1055.
42. Legendre, P. 1993. Spatial autocorrelation: trouble or new paradigm? Ecology 74: 1659-1673. 43. Montgomery, S.S. & Montgomery, W.I. 1989. Spatial and temporal variation in the infracommunity
structure of helminths of Apodemus sylvaticus (Rodentia: Muridae). Parasitology 98: 145-150 44. Simková, A., Morand, S., Matejusová, I., Jurajda, P. & Gelnar, M. 2001. Local and regional influences
on patterns of parasite species richness of central European fishes. Biodivers. Conserv. 10: 511 - 5 2 5 45. Poulin, R. 1997. Species richness of parasite assemblages: evolution and patterns. Annu. Rev. Ecol.
Syst. 28: 341-358.
46. Poulin, R. 1998. Comparison of three estimators of species richness in parasite component communities. J. Parasitol. 84: 485-490
47. Guégan, J-F. & Kennedy, C. R. 1996. Parasite richness/Sampling effort/Host range: The Fancy Three-piece Jigsaw Puzzle. Parasitol. Today 12: 367-369.
48. Feliu, C., Renaud, F., Catzeflis, F., Hugot, J.P., Durand, P. & Morand, S. 1997. A comparative analysis of parasite species richness of Iberian rodents. Parasitology 115: 453-66.
49. Cartron, J-L, Kelly, J.F. & Brown, J. H.. 2000. Constraints on patterns of covariation: a case study in strigid owls. Oikos 90: 381-390.
50. Bárcena, S.B., Real, R., Olivero, J. & Va rgas, J.M. 2004. Latitudinal trends in breeding waterbird species richness in Europe and their environmental correlates. Biodivers. Conserv. 13 (11): 1997-2014. 51. Poulin, R. 2001. Another look at the richness of helminth communities in tropical freshwater fish. J.
Biogeogr. 28: 737-743.
52. Fedriani, J. M. 1996. Dieta anual del zorro, Vulpes vulpes en dos hábitats del Parque Nacional de Doñana. (Annual diet of the fox Vulpes vulpes in two habitats of the Doñana National Park). Doñana, Acta Vertebr. 23(2): 143-152.
53. Ruiz-Olmo, J., Grau, J. M. T. & Puig, R. 1990. Comparación de la evolución de las poblaciones de zorro (Vulpes vulpes L. 1758) en el NE Ibérico en base a datos históricos (Siglos XVIII-XIX) y actuales (Siglo XX). (Comparing the evolution of the fox (Vulpes vulpes L. 1758) populations in the Iberian NE based on historical (XVIII-XIX centuries) and current (XX century)). data. Misc. Zool. 14: 225-231.
54. Araújo, M. B. & P. H. Williams. 2000. Selecting areas for species persistence using occurrence data. Biol. Conserv. 96: 331-345.