Full Terms & Conditions of access and use can be found at
https://www.tandfonline.com/action/journalInformation?journalCode=rics20
ISSN: 1369-118X (Print) 1468-4462 (Online) Journal homepage: https://www.tandfonline.com/loi/rics20
Visual cross-platform analysis: digital methods to
research social media images
Warren Pearce, Suay M. Özkula, Amanda K. Greene, Lauren Teeling, Jennifer
S. Bansard, Janna Joceli Omena & Elaine Teixeira Rabello
To cite this article: Warren Pearce, Suay M. Özkula, Amanda K. Greene, Lauren Teeling, Jennifer S. Bansard, Janna Joceli Omena & Elaine Teixeira Rabello (2018): Visual cross-platform analysis: digital methods to research social media images, Information, Communication & Society, DOI: 10.1080/1369118X.2018.1486871
To link to this article: https://doi.org/10.1080/1369118X.2018.1486871
© 2018 The Author(s). Published by Informa UK Limited, trading as Taylor & Francis Group
View supplementary material
Published online: 22 Jun 2018.
Submit your article to this journal
Article views: 2390
Visual cross-platform analysis: digital methods to research
social media images
Warren Pearce a, Suay M. Özkula b, Amanda K. Greene c, Lauren Teeling d, Jennifer S. Bansard e, Janna Joceli Omena fand Elaine Teixeira Rabello g a
iHuman, Department of Sociological Studies, University of Sheffield, Sheffield, UK;bDepartment of Sociological Studies, University of Sheffield, Sheffield, UK;cDepartment of English Language & Literature, University of Michigan, Ann Arbor, MI, USA;dSchool of Communications, Dublin City University, Dublin, Republic of Ireland;eFaculty of Economics and Social Sciences, University of Potsdam, Potsdam, Germany; f
iNOVA Media Lab, ICNOVA, Universidade Nova de Lisboa, Lisbon, Portugal;gSocial Medicine Institute, State University of Rio de Janeiro, Rio de Janeiro, Brazil
ABSTRACT
Analysis of social media using digital methods is a flourishing approach. However, the relatively easy availability of data collected via platform application programming interfaces has arguably led to the predominance of single-platform research of social media. Such research has also privileged the role of text in social media analysis, as a form of data that is more readily gathered and searchable than images. In this paper, we challenge both of these prevailing forms of social media research by outlining a methodology for visual cross-platform analysis (VCPA), defined as the study of still and moving images across two or more social media platforms. Our argument contains three steps. First, we argue that cross-platform analysis addresses a gap in research methods in that it acknowledges the interplay between a social phenomenon under investigation and the medium within which it is being researched, thus illuminating the different affordances and cultures of web platforms. Second, we build on the literature on multimodal communication and platform vernacular to provide a rationale for incorporating the visual into cross-platform analysis. Third, we reflect on an experimental cross-platform analysis of images within social media posts (n = 471,033) used to communicate climate change to advance different modes of macro- and meso-levels of analysis that are natively visual: image-text networks, image plots and composite images. We conclude by assessing the research pathways opened up by VCPA, delineating potential contributions to empirical research and theory and the potential impact on practitioners of social media communication.
ARTICLE HISTORY
Received 24 January 2018 Accepted 5 June 2018
KEYWORDS
Research methodology; visual analysis; social media; climate change
1. Introduction
In this article we present visual cross-platform analysis (VCPA), defined as the study of still and moving images across two or more social media platforms, as a methodological
© 2018 The Author(s). Published by Informa UK Limited, trading as Taylor & Francis Group
This is an Open Access article distributed under the terms of the Creative Commons Attribution License (http://creativecommons.org/ licenses/by/4.0/), which permits unrestricted use, distribution, and reproduction in any medium, provided the original work is properly cited.
CONTACT Warren Pearce warren.pearce@sheffield.ac.uk
response to two key sources of bias in the social media research literature:first, the preva-lence of single-platform analysis over cross-platform analysis and, second, the prevapreva-lence of unimodal, textual analysis over multimodal analysis which includes images. We argue that VCPA can enhance our understanding of ‘platform vernaculars’ (Gibbs, Meese, Arnold, Nansen, & Carter, 2015): the different narrative patterns that shape content
and information flows across platforms. We do this by identifying visual vernaculars, drawing on two collaborative, international research projects examining large social media datasets related to climate change acrossfive platforms: Instagram, Twitter, Reddit, Tumblr, and Facebook.
Following Highfield and Leaver (2016), we argue that existing knowledge of distinct plat-form language patterns needs to be complemented with a sustained programme of research focused on visual elements of social media. VCPA is distinctive in expanding such research across diverse social media platforms to identify visual vernaculars. Such vernaculars are influenced by multiple platform affordances: for example, front-end and back-end struc-tures, platform culstruc-tures, and commercial interests. These affordances combine across differ-ent platforms and social phenomena to form distinctive platform vernaculars, which include the visual alongside the textual. Studying vernaculars enables reflection on the empirical object of social media research; specifically, the extent to which data can be said to reflect the social phenomenon being researched and/or reflect the affordances of the social media platforms from which data are obtained (Marres,2017, pp. 116–140).
We present our argument as follows. First, we provide a rationale for cross-platform analysis of social media, noting the advantages the approach brings to the example of cli-mate change-related social media communication. Second, we justify the move from cross-platform analysis to visual cross-platform analysis, highlighting the literature on multimodal communication, the importance of visual vernaculars, and the integration of these into the VCPA approach. Third, we illustrate the implementation of VCPA for still images by expanding on two experimental projects on climate change social media images conducted at the Digital Methods Initiative Summer School, University of Amster-dam (Niederer & Pearce, 2017; Pearce & Ozkula, 2017). We assess the relationship between text and images in VCPA, image-text networks and image plots as methods for analysing platform vernaculars, and composite images as a creative meso-level approach to comparing platform vernaculars. We conclude with a review of the VCPA approach and identify opportunities for further research.
2. Cross-platform analysis
2.1 Platformisation of the web
Developments in digital methods have provided researchers with approaches and tools with which to study social media sociologically (Baym, 2013; Bennett & Segerberg,
2012; Burgess & Bruns, 2012; Gerrard, 2018; Halfpenny & Procter, 2015; Kennedy, Moss, Birchall, & Moshonas, 2015; Lupton, 2014; Marres, 2017; Rieder, 2013, 2015a,
2015b; Roberts, Snee, Hine, Morey, & Watson,2016; Zimmer & Proferes, 2014). These digital methods have in some ways benefitted from the ‘platformisation’ of the web, in which web applications, including social media, are increasingly integrated with each other and the wider web, facilitating increasedflows of data and information (Helmond,
2015). However, platformisation has also contributed to single-platform research becom-ing the norm, as data provided by platforms replace older methods in which they were scraped from multiple websites (Rogers, 2017a, p. 94). This narrowing in research methods is ironic given that the logic of platformisation is of increasing integration and programmability between platforms (Helmond,2015), and suggests a mismatch between research methods and current trends in digital society.
Platformisation has prompted scholars to question established digital methods for researching the web. For example, Rogers (2017a) highlights two features of social media platforms that have methodological implications: the increasing salience of engagement metrics and the increased importance of application programming inter-faces (APIs) as a source for digital data. Engagement metrics, such as Facebook likes, Twitter retweets, and Reddit upvotes, point researchers towards APIs which afford direct (but limited) access to platforms back-end structures, in which data are stored, organ-ised, and made available. This marks a shift away from previous modes of digital research that scraped content from multiple websites in order to map particular issues. APIs are not only a common pathway for researchers to access and collect data, but their programmability also sets new formats and data infrastructures across the web. In this way, social media APIs have a dual dynamic: they allow the decentralisation of platforms’ features into the web, while also recentralising data from across the web back onto platforms (Helmond, 2015). Platformisation thus enables the coexistence and flow of digital objects alongside different platforms, necessitating a turn to plat-form-specific APIs in order for researchers to access data. While the number of access points has decreased, the volume of data available through APIs is huge. This has enabled research based on impressive ‘big’ data sets derived from single-platform APIs. For example, one study of climate change on Twitter gathered 1.8 million tweets in a single year (Kirilenko & Stepchenkova,2014). In short, platformisation has enabled the supply of cheap and plentiful data, but these data are only accessible to researchers within platform-specific ‘silos’ (Rogers, 2017a).
2.2 From single-platform research to cross-platform research
Of course, bigger does not always mean better, or necessarily enhance accuracy (boyd & Crawford, 2012). The rise of data silos associated with platformisation should temper researchers’ claims that their data sources can provide insights into ‘social phenomena that extend beyond online settings’ (Marres, 2017, p. 128). Yet this is not always the case. For example, prominent research articles into climate change on Twitter claim to ‘comprehensively describe global public discourse on climate change, as reflected … on Twitter’ (Kirilenko & Stepchenkova,2014, p. 172), or that tweets provide‘a proxy for cli-mate change discourse among the general public’ (Kirilenko, Molodtsova, & Stepchen-kova,2015, p. 94). While the data analysed in such articles is of interest to social media and climate change communication scholars, there is scope for greater reflection on what such data represent and the extent to which it provides generalisable findings (Bruns & Stieglitz,2014).
With engorged volumes of platform-specific data, it is easy to lose sight of the impor-tance of researching across multiple social media platforms to tell a rich story about social phenomena such as climate change. Cross-platform analysis also enhances opportunities
to reflect on how social media data are contingent not only upon the social phenomena in question, but also the affordances and structures of the platforms themselves. Recognising the importance of each platform’s distinct affordances and structures implies that researchers must take care when comparing instances of the same social phenomena between different platforms (Burgess & Matamoros-Fernández, 2016). Rogers (2017a) expresses this as a need for cross-platform research to pay special attention to both ‘med-ium research’ and ‘social research’. Medium research covers platform structures such as how platforms display content on screen and deliver data to researchers through APIs, and platform affordances such as cultures of hashtag use and moderation policies. Social research covers the stories that can be told about the phenomena in question once these platform effects are accounted for. The next section highlights two categories of platform effects posing particular challenges to cross-platform research: collapsed objects and digi-tal bias.
2.3 Challenges to cross-platform research: collapsed objects and digital bias
Cross-platform analysis enables researchers to widen their scope to potentially include important forms of content sharing across different social media networks (Bennett & Segerberg, 2012). While potentially providing rich access to a given social phenomena, a focus on medium research brings into question the status and comparability of digital objects found on different platforms (Rogers, 2017a). For example, hashtags are often used as a means of researching events or issues on single platforms but possess plat-form-specific characteristics. Hashtags are used far more liberally on Instagram than Twit-ter, raising the question of their comparative importance on each platform and highlighting that while they may share a name, hashtags on the two platforms should not be‘collapsed’ into a single category of object (Rogers,2017a). Instead, cross-platform research should attend to the platform effects that shape digital objects, both through user cultures and platform structures. Similarly, images play an increasingly important role across all prominent social media platforms, but each platform exhibits particular effects that influence the appearance (or non-appearance) of particular images.
Such platform effects point to a fundamental methodological issue: the extent to which cross-platform research is subject to digital bias. One cannot assume that social media research provides a simple window onto social phenomena. Social media can tell us some-thing about social phenomena such as climate change, but we must acknowledge that social media platforms are hybrid assemblages of users, algorithms, and data (among other things) that require researchers to regularly reflect on the empirical object of their research (Marres, 2017, p. 132). Marres (2017, p. 123) identifies three issues in digital
bias (at a minimum) requiring attention: (1) bias in the selected data and content, as the researcher selects certain snapshots of social media coverage; (2) built-in software bias in the research instruments, for example, bias through embedded algorithms; and (3) bias of methodological nature, for example, social media research tools are more amen-able to textual queries than visual queries, resulting in a bias towards textual analysis that provides only partial analysis of platform content. Marres calls for an ‘affirmative approach’ to digital bias (2017, p. 125); that is, accepting these biases as part of the object of study rather than attempting to neutralise platform effects by disentangling medium research from social research (Pearce, Holmberg, Hellsten, & Nerlich,2014).
Adopting an affirmative approach, we present here an exploratory cross-platform analysis that reviews, addresses and affirms the socio-technical features and discourses specific to individual platforms. Our empirical enquiry follows online visual represen-tations of climate change and their related platform-specific visual vernaculars, as well as the technological features that enable those vernaculars. In the next section, we assess the key issues and challenges of bringing visual vernaculars into cross-platform analysis in this way.
3. Cross-platform analysis: taking the visual into account
Images on social media platforms are a more unwieldy category for comparative work than other collapsed objects such as hashtags. As such, they challenge the feasibility of cross-platform analysis and have thus far marked its limits. Social media research has con-tinued a broader trend in social research of privileging unimodal approaches focused on text (Bruns & Burgess,2015) over multimodal approaches acknowledging the importance of visual content (Highfield & Leaver, 2016; Thelwall et al.,2016). However, while the visual poses particular analytical challenges, we argue that images play a pivotal role within the richly multimodal nature of many platform vernaculars. Visual data provide an essen-tial entry point into the phenomenology of platform vernaculars that captures their story-telling capacities, affective rhythms, and publics, beyond engagement metrics or purely textual content which are easier to analyse at scale. By confining cross-platform studies to textual analysis, researchers miss an important aspect of the narratives and genres that these platforms foster. Thus, Highfield and Leaver call for a concerted investment in social media visual research:
Visual social media content is an important part of everyday activity on platforms from Face-book to Vine, Twitter to Tinder, through profile pictures, memes, information-sharing, and affective imagery, and employed to respond to any number of topics. The large-scale and automated analysis of textual social media activity has generated detailed studies into plat-forms, such as Twitter, but this is not the whole story of how a platform is used. (2016, p. 58)
Taking images seriously and developing visual methodologies is an essential, and currently under-examined, step in enhancing cross-platform analysis’s ability to account for, and grapple with,‘the whole story.’
3.1 From text to images– the rationale for multimodal approaches
The predominance of unimodal analysis reflects wider academic trends that privilege text over images as the most potent subject for research. This‘linguistic imperialism’ (Mitchell,
1986) creates a hierarchy which prioritises reading over seeing, thus neglecting the poten-tial of images as a significant mode of contestation and reflection. As Mirzoeff states, ‘wes-tern culture has consistently privileged the spoken word as the highest form of intellectual practice and seen visual representations as second rate illustrations of ideas’ (1999, p. 6). Scholars have challenged this view of cognition as dominantly linguistic, emphasising the ‘visual intelligence’ of images and their everyday importance as focal points for meaning-making within cultural contexts (DeLuca,2006; Stafford,1998).
Jay (2006) utilises the example of the silentfilm to illustrate the capacity of the visual to overcome linguistic and cultural boundaries while DeLuca argues through his study of the
Earth First! television programme that images in fact dominate language and should be analysed to the‘near exclusion of words’ (2006, p. 189). A more measured approach is adopted by Kress and van Leeuwen (2001) who assert that language is no longer the unchallenged dominant mode in public forms of communication. Further evidence suggests that the importance of images is increasing in key communication fora; for example, the increasing prevalence of images on the front page of the New York Times in recent decades (Begley,2017).
A multimodal approach to communication practices is one which examines textual, aural, linguistic, spatial and, as we highlight in this article, visual resources. One assump-tion of multimodal approaches is that language is but part of this multimodal ensemble and that each mode has the potential to contribute to the production of meaning (Jewitt,
2014). Each mode whether it be language, image, sound, and so on, does different
com-municative work and is shaped by its individual cultural, historical, and social uses (DeLuca,2006). Jewitt (2014) cites examples of both the classroom and workplace to illus-trate that phenomena are often interpreted and explained by modes other than language such as images, models, and demonstrations. As Norris proposed over a decade ago,‘all interactions are multimodal’ and a multimodal approach ‘steps away from the notion that language always plays the central role in interaction, without denying that it often does’ (2004, p. 3).
3.2 The importance of visual vernaculars
Several scholars have already shown the importance of the visual to understanding social media, especially arguing for the image’s increasing imbrication in self-representation, storytelling, affect, and the creation of publics in digital media ecologies. For example, exploring both identity formation and interpersonal communication, van Dijck (2008, p. 57) has suggested that‘digital cameras, camera phones, photoblogs and other multipur-pose devices are used to promote the use of images as the preferred idiom of a new gen-eration of users.’ In this digitally native context, ‘Pixelated images, like spoken words, circulate between individuals and groups to establish and reconfirm bonds’ (van Dijck,
2008, p. 62). Individuals’ experiences are visualised across social media platforms and,
as stated by Mirzoeff, the role of images is not merely a part of everyday life, ‘it is everyday life’ (1999, p. 1, emphasis added).
Mendelson and Papacharissi (2010) have examined how college students’ Facebook
photo posting practices build group identity and are an essential expressive component of the new ‘networked self.’ Focusing on the affective nature of this identity, Palmer (2010) argues that photo sharing sites become ‘emotional archives’ that frame users’ own sense of life narratives. By examining the use of images across social media platforms we can attempt to construct a picture of the visual vernaculars which contribute to mean-ing-making, identity formation and social interaction.
Research into the image cultures of particular platforms and their predominant visual objects has also led to the theorisation of the ‘platform vernacular,’ a concept that is especially salient as online interactions increasingly inform everyday self-making and interpersonal communication. In an article discussing funerary practices on Instagram, Gibbs et al. (2015) coin this term as‘a way of understanding how communication practices emerge within particular SNS [social network sites] to congeal as genres.’ The norms,
protocols, and user cultures of different social media platforms codify their own conversa-tional forms and rhetorics tailored to their respective online contexts. Individual platforms do not just have their own politics (Gillespie,2010), but also particular ways of shaping the creative possibilities of user expression within platform vernaculars (Burgess,2006). Mul-timodal affordances and, especially, ‘social media’s increasingly visual turn’ are at the foundation of this theory (Gibbs et al.,2015).
Gibbs et al.’s (2015) research into platform vernaculars is grounded on a multimodal, image-textual dataset that features visual posts in addition to hashtags and comments. However, despite this emphasis on multimodality and a brief mention of the way platform vernaculars develop across platforms, a fuller theorisation of the vernaculars’ visuality and the rich potential of cross-platform analysis both remain ripe for investigation.
3.3 Moving beyond the single platform: towards VCPA
Thefield of visual social media studies is a nascent one, with scholarship to date confined largely to single-platform studies or even single visual categories within those platforms. One notable exception is Duguay’s (2016) work on LGBTQ self-representation on Insta-gram and Vine, which demonstrates the viability of cross-platform work on images. Examining the different visual self-presentations by celebrity Ruby Rose’ across these two platforms, Duguay suggests that two different narrative models and publics emerge. Methodologically, this research differs markedly in approach and scope from ‘big data’ text-based analyses discussed in the previous section. While offering important insights within its particular context, a more scalable model for cross-platform visual research can supplement this work in productive ways, speaking more broadly at the level of plat-forms’ visual vernaculars as opposed to being limited to the particular cultural producers that the researcher designates as nodal points.
In addition to these practical methodological obstacles, the dearth of visual cross-form studies reflects assumptions that only certain image-dominant social media plat-forms are viable places for visual analysis, in spite of the multimodal makeup of almost all major platforms. For example, although Manovich’s recent monograph (2016) makes a compelling case for considering‘aesthetic visual communication’ online, he sim-ultaneously relegates this activity entirely to Instagram. In a cursory map of platform affor-dances and vernaculars he summarises, ‘if Google is an information retrieval service, Twitter is for news and links exchange, Facebook is for social communication, and Flickr is for image archiving, Instagram is for aesthetic visual communication’ (Manovich,2016, p. 41; original emphasis). While Instagram or Flickr may appear the most intuitive places to turn for image-based scholarship, this understanding of the digital image ecology artifi-cially restricts the possibilities for research. Cross-platform analysis of a more diverse range of platforms, as examined in this paper, can address this distortion by highlighting the diversity of visual vernaculars across multiple platforms, not just those where the image appears to take precedence over text.
The methodology we discuss below aims to address these gaps and expand the possible objects of VCPA. The availability of image-centric data enables exciting new research pos-sibilities. However, given the particular phenomenology of images versus text, the rigorous analysis of visual objects and platform imagery requires more than merely mirroring text-based models. By adapting digital methodologies to investigate visual phenomena, we can
create comprehensive datasets and analytical schema with which to understand platforms’ visual vernaculars.
4. Illustrating VCPA: researching online representations of climate change Having outlined some key opportunities and challenges of VCPA, in this section we bring life to the methodology by reflecting on two projects conducted during the Digital Methods Initiative Summer School, University of Amsterdam (Niederer & Pearce,2017; Pearce & Ozkula, 2017). The projects were characterised by ‘online groundedness’ in that they followed the medium and sought to capture its dynamics (Rogers, 2017a, p. 91). We studied data from Instagram, Facebook, Twitter, Reddit, and Tumblr to answer the following questions: (1) how is climate change represented visually across different social media platforms and (2) how do those different representations reflect visual plat-form vernaculars? Here, we reflect on some of the methods used and present illustrative examples of our approach.
4.1. From text to images: the challenge of data collection
While we focused on visual representations, text nevertheless remained important as images are almost exclusively collected through the intermediary of text-based searches using keywords or hashtags. This form of data collection introduces an inevitable language bias (generally favouring English language content) that researchers should acknowledge. Non-textual search elements such as geographical location or time of post-ing can also prove suitable entrance points on platforms such as Instagram (Rieder,
2015b). We also recognised the specific affordances of the platforms and thus designed platform-specific data collection protocols that reflected typical user journeys. Notable differences, for example, relate to the prominence of hashtags (tags on Instagram and Tumblr), which are centre stage on Twitter but less prominent on Facebook. For Face-book, one might want to consider the role of pages that users like or groups that they join. On Reddit, the‘sub-reddits’ to which users subscribe are essential elements struc-turing the discourse on the platform. Thus, rather than trying to neutralise these plat-form effects by employing one mode of data collection across all of them, we recognised and catered to platform differences by adapting the modes of data collection for each platform (see Supplemental Information for detailed descriptions of the data collection protocols).
Beyond these platform differences, it is important to be mindful of the tendency to pro-vide ‘personalised’ content to online media users (Feuz, Fuller, & Stalder, 2011). For example, the algorithms that govern the display of Facebook and Twitter feeds mean that users are exposed to different content. One way to address biases stemming from these mechanisms of personalisation, is to use‘research browsers’: a separate installation of a web browser, such as Firefox or Safari, which is free of cookies and unencumbered by the researcher’s personal Google account (Rogers,2017b, p. 88). Doing so reduces the ten-dency for personalisation based on elements such as web-history or geographical location. This does not replicate the user experiences but does facilitate a focus on‘generic’ platform representations of issues that form part of the hybrid assemblages that, along with algor-ithms, aid personalisation.
Finally, the affordances of the research tools used for data collection must be considered when designing data collection protocols. While platform-specific tools evidently mirror the platforms’ affordances, every tool bears the marks of its developer and the specific pur-pose for which it was created. In our research project we used the following tools: Visual Tagnet Explorer (Instagram) (Rieder, 2015b), Netvizz (Facebook) (Rieder, 2013), the Twitter Capture and Analysis Toolset (Borra & Rieder,2014), TumblrTool (Tumblr) (Rie-der, 2015a), and Google BigQuery (Reddit). These tools render data in tabular form, including information such as user IDs, time of posting, tags, and engagement metrics. We collected a total of 471,033 social media posts; comprising 17,477 Instagram posts, 100 Facebook posts, 418,111 tweets, 18,448 Tumblr posts, and 16,897 Reddit images. For visual research, we highlight that while tools collect entire text-based elements (such as the body of tweets), images may only be collected in the form of URLs, creating the need for further data collection if one wants to perform visual content analysis. For example, in our project we used the DownThemAll extension for Mozilla Firefox which allowed us to download all the images featured in the posts we collected from the different platforms (Maier, Parodi, & Verna,2016).
4.2. Analysing platform vernaculars: from counting to interpreting images
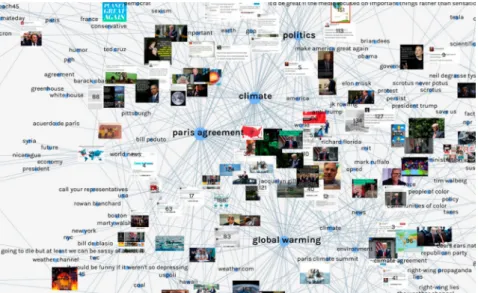
While large datasets collected with digital methods arguably lend themselves well to quan-titative modes of inquiry, we argue that there is merit in combining these with qualitative approaches to add depth to numeric analyses of online discourses. This holds especially true with regards to analysing visual material whereby the results of quantitative analyses, for example, of engagement metrics, can serve as the foundations for qualitative examin-ations. To get a broad sense of the data and identify general patterns, quantitative analyses laid the ground of our mixed-methods approach. For this we considered, among others elements: the share of posts containing images, engagement metrics, and tags associated with the images in our dataset. For example, we found for Tumblr that the share of ‘cli-mate change’ posts with images is relatively constant over our data collection period (27 June 2016–26 June 2017), ranging between 16% and 28%, with a median value of 21%. Focusing on the posts containing images, we examined variations in engagement levels (called ‘notes’ on Tumblr), meaning the number of reblogs, likes, replies, and answers. We found that it varied quite drastically, even among the top 10 images of each month. For example, in June 2017 thefirst ranking picture had 33,822 notes while the 10th only received 6,403 likes, re-blogs, and other reactions. The same holds true for the entire dataset’s top 10 images: the first ranked post had 190,126 notes while the 10th had 39,426. This analysis allowed us to identify which images can be considered as ‘viral’ representations of climate change on the platform. Finally, we conducted an image-textual network analysis tofind out which tags are often associated with Tumblr images on climate change. This, for example, showed the recurrence of the tag ‘#parisa-greement’ in our dataset. The results of this analysis are visualised in Figure 1 in the form of a two-mode network of images and associated tags.
Qualitative content analysis of the tag and image network provides an overview of visual‘vernacular creativity’ on given platforms (Burgess, 2006).Figure 1 illustrates the intermingling on Tumblr of screenshots taken from other social media platforms (notably, Twitter) and image macros with more conventional charts and press photography. It
further shows how these images relate to each other through textual tags within the plat-form. The clustering of Twitter screenshots around the‘politics’ tag provides evidence of connective action on Tumblr: using screenshots to import content where the platforms themselves have no‘native’ functionality with which to perform the task (Bennett & Seger-berg,2012). These linkages further substantiate our call for cross-platform research.
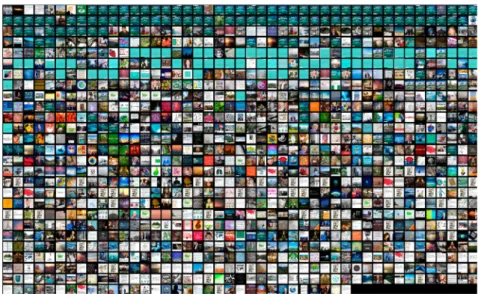
Another approach that provides rich insights into visual platform vernaculars is the plotting of images according to characteristics such as time of posting or colour using soft-ware such as ImageSorter. Arranging the images according to the principle of‘small mul-tiples’ popularised by Tufte (2001, p. 170) enables rapid visual comparison of a large number of images and highlights patterns in the data. In the following, we illustrate this with two plots of images from Instagram featuring the hashtag #parisagreement that were posted over a period of a few days before and after the US government’s 2017 announcement that it planned to withdraw from the 2015 climate agreement.
Organising the images by colour (Figure 2) not only enables the researcher to easily spot images that have been posted with high frequency (as they are enlarged and overlaid over their multiple occurrences), but also to identify homogeneously coloured clusters.
The image plots provide an opportunity to appraise the use of colour in the visual ver-nacular of climate change on Instagram. For example, scientific charts and Twitter screen-shots are prevalent in the white cluster, while the red cluster opens up lines of empirical enquiry focused on warnings and climate change (Mahony & Hulme,2012).
Beyond providing the opportunity for a within-platform analysis, the identification of image types achieved by means of image plotting also strengthens our argument about the value of cross-platform analysis. Indeed, as evidenced inFigure 2, one of the most fre-quently posted images in this dataset is a screenshot taken from Neil deGrasse Tyson’s Twitter account. This provides another example of informal connective action between platforms similar to that highlighted for Tumblr inFigure 1.
Figure 1.Two-mode tag and image climate change network for Tumblr (based on TumblrTool query for‘climate change’ 27 June 2016–26 June 2017). Design: Andrea Benedetti.
Overall, we consider that qualitative comparisons of colour-sorted image plots over time and/or between platforms can provide evidence of the shifting emotional registers of climate change which underpin online meaning-making and social interaction (O’Neill & Smith,2014). Sorting image plots by colour can help guide researchers towards relevant social research questions regarding the type of visual aesthetic communication associated with a social phenomenon.
Turning from social research to medium research, that is sorting images by time, rather than colour, can further provide insights into the affordances of platforms.Figure 3shows the images fromFigure 2reordered by the time posted. Here, it becomes apparent that two of the most frequently posted images‘Dear President Trump’ (light blue) and ‘There is No Planet B’ (black and green) display patterns of rapid reposting. Both images originated from Instagram users with millions of followers (Leonardo Di Caprio (leonardodicaprio),
2017; Tiffany & Co. (tiffanyandco),2017). By contrast, the illustration‘Destroy the patri-archy, not the planet’ (black and white) was also frequently posted (as shown inFigure 2) but over a more dispersed pattern; the image starts to appear approximately halfway through the visualisation.
Image plots provide a means of identifying visual patterns, which not only provide information about the social phenomenon in question (in this example, the Paris climate
Figure 2.#parisagreement image plot of Instagram sorted by colour in Image Sorter (Visual Comput-ing,2018) (based on Visual Tagnet Explorer query for #parisagreement, 1203 images 1 May–1 June 2017). Design: Federica Bardelli, Carlo de Gaetano, Michele Mauri.
agreement) but also aspects of the technology itself. The pattern of rapid and concentrated reposting opens up lines of enquiry about whether such reposts are automated and/or come from fan accounts. While this reposting of images is the most effective means of pre-senting images to other Instagram users, the numbers involved here reveal it to be a rela-tively unusual practice in comparison with‘liking’ an image. For example, there are a total of 117 Instagram posts containing the Planet B image, in comparison with over 300,000 likes for the most-engaged-with post containing the image (Leonardo Di Caprio (leonar-dodicaprio),2017). Instagram users receive notification of these likes, but only in a
separ-ate column away from the main timeline feed. This contrasts with Twitter, where native retweeting inserts posts (containing images) directly into a user’s main timeline1
. This opens up the potential to supplement VCPA with‘walkthrough methods’ that place plat-form-data collected through digital methods in their sociocultural context (Light, Burgess, & Duguay,2016).
Determining the extent to which images constitute‘collapsed objects’ across different platforms and the particular platform effects that influence the posting of images is impor-tant for VCPA. If the circulation of images constitutes bonds between individuals and groups (Van Dijck,2008, p. 62), we suggest that this circulation is more effectively
facili-tated on Twitter than on Instagram. These different platform affordances indicate that while some practices associated with images, such as liking and reposting, may appear similar across platforms, they in fact have different influences on social networks within the platforms. Although Instagram is seen as the more visual platform, it appears that images circulate more readily on Twitter.
In terms of interpreting the images themselves, outputs from ImageSorter provide an overview of the styles and colours of images used in connection with a particular search term, offering opportunities for comparing large datasets such as those shown above. They align with our suggestion that visual data should be presented in visual form.
Figure 3.#parisagreement image plot of Instagram sorted by time posted in Image Sorter (Visual Com-puting,2018), earliest in top left. (based on Visual Tagnet Explorer query for #parisagreement, 1203 images 1 May–1 June 2017). Design: Federica Bardelli, Carlo de Gaetano, Michele Mauri.
However, it is important to note that building the dataset still relies on accessing APIs through textual queries. This constitutes a form of digital bias which may restrict the retrieval of posts and images relevant to a particular research question. Adopting an affirmative approach to such issues of digital bias, one may argue that this is of little con-sequence as the dataset retrieved reflects how social media users may view issue-specific content around hashtags. However, the circulation and consumption of issue-specific images likely goes beyond such text, and may include other text, or no text at all, and still be visually identifiable as related to climate change.
4.3. Moving from single-platform to VCPA
The image-text networks and image plots discussed above open up potentially fruitful lines of enquiry within single platforms, highlighting image-text relationships, temporal patterns, colour usage, and so on, across large datasets. In addition to these macro-level visualisations, there remains an important role for more micro-level qualitative analysis identifying particularly prevalent images for more detailed interpretation. Yet both approaches present problems for cross-platform analysis. Macro-level comparisons of image plots for different platforms offer a ‘bird’s eye’ comparison of colour usage but lack detailed insights into the content of such images. Micro-level comparisons can pro-vide detailed aesthetic analysis, but risk providing too thin a slice of a platform’s visual vernacular.
Here we present composite images, a meso-level visualisation method for VCPA, as one way past this impasse. Composite images are compiled from datasets using criteria rel-evant to the research question at hand; for example, which are the most engaged with cli-mate change images across different social media platforms?2Images from each platform are ‘stacked’ on top of each other within Adobe Photoshop, producing one composite image for each platform. To aid comparability, identical settings are used in the construc-tion of each image stack. In the example below (Figure 4), we display five composite images showing the 10 most engaged with images on each platform. The resulting image combines the qualitative detail with a visual summary of each platform for easy comparability.
Our example demonstrates the analytical advantage of displaying these composite images side by side, again following Tufte’s (2001) principle of small multiples, in order to facilitate a qualitative comparisons of visual platform vernaculars. The beautiful, stylish photography often associated with Instagram (Serafinelli,2017) is in evidence here. This contrasts with the dominant white space and text from Tumblr that again demonstrates the importance of connective action through the screenshotting of iconic moments found on other social media platforms. The Twitter image stack demonstrates the role of multimodal communication on the platform, with text captions integrated into images. Facebook shows an even greater prevalence of integrated text, a combination of both pro-fessionally designed content and more internet meme-style fonts. Finally, Reddit shows a more homogenous vernacular of political symbols:flags, podiums and men in suits.
One thing that these composite images make clear is that aesthetic visual communi-cation takes place not only on Instagram, but across a range of social media platforms. VCPA enables a rich analysis of the platform vernaculars used to communicate particular social phenomena, with composite images providing one way of visualising this for
analysis, and of communicating this more widely. Composite images make sense as a means of analysis that is native to the visual mode. Analysis of text generally produces new text, so we argue that analysis of images can productively produce new images which can aid identification and interpretation of visual vernaculars. This in turn can
Figure 4.Composite images of the top 10 most engaged with images onfive platforms (Design by Federica Bardelli, Carlo de Gaetano, Beatrice Gobbo and Andrea Benedetti).
help to identify the roles of medium research and social research within a specific research question and accompanying datasets. Commonalities between composite images may show important elements of the social phenomenon in question, whereas divergences pro-vide clues as to where medium research requires further consideration. For example, the predominance of press photography on Reddit reflects the role of thumbnail images from the media articles that are voted on by Reddit users. This contrasts with the more directly user-driven visual content on Tumblr and Instagram. Thus our example of VCPA pro-vides a means of engaging in both social and medium research within social media analy-sis, as recommended by Rogers (2017a, p. 104).
4.4 Findings from experimental VCPA projects on climate change
While the focus of this article is on outlining the VCPA approach, we also elaborate on some findings from our experimental research into climate change images. InTable 1, we provide textual summaries of the visual vernaculars visible inFigure 4, with the caveat that a variety of different data collection methods were employed during the experimental projects, and that more robust results could be obtained through a more longitudinal approach (see Supplemental Information).
Suchfindings from VCPA have the potential for broader impact on social media com-munication. For example, guidance has recently been issued by Climate Outreach regard-ing best practice in visual communication of climate change (Corner, Webster, & Teriete,
2015). Recommendations include moving away from visual clichés such as polar bears towards images that better illustrate the human impacts of climate change. VCPAfindings can help to compare popular social media images with‘best practice’ guidance, and con-tribute a more nuanced understanding of visual platform cultures to activists, scientists and other engaged publics who wish to communicate climate change on social media.
5. Conclusion
In this article, we have introduced VCPA as an approach to social media research addres-sing two emerging strands of literature. First, the need to look beyond addres-single-platform research relying on platform APIs towards cross-platform analyses enable researchers to take account of both the social phenomenon (social research) and platform effects (medium research). Second, we have emphasised the crucial role of images in cross-plat-form analysis, moving from currently widespread text-based approaches to more multi-modal approaches which include visual analysis. In doing so, we have contributed to
Table 1.Textual descriptions of visual vernaculars found in experimental climate change projects.
Platform Description of vernacular
Instagram Awareness travelling: aesthetically pleasing travelogue pictures. Experience-based, not informational Tumblr Environmental‘screenshotting’: depicting noteworthy moments from other social media platforms, often
showing‘climate sceptics’ being put in their place
Twitter Controversy and contestation: includes combinations of image and text, sometimes in support of positions counter to mainstream opinion
Facebook Memes and infographics: image and text combinations dominate, with the apparent aim of boosting shareability
Reddit Staged photo ops: thumbnail images from mainstream media articles that appear on Reddit when users post the URL to an article
the methodological literature in both social media research and visual methods. There are nofixed solutions to the methodological issues we have discussed; rather we have illumi-nated two key issues that researchers need to address.
First, we have focused on the issue of‘collapsed objects’; the extent to which digital objects are comparable across different platforms. Our findings suggest that as well as considering engagement metrics such as‘likes’, digital researchers must also be cognisant that images are a category of digital object that have diverse affordances across platforms. In particular, researchers should be aware that images play an important communicative role on social media platforms beyond Instagram and Flickr, and that platform structures and cultures play a crucial role in facilitating or impeding theflow of images between users. Second, we have considered the problem of digital bias. We argue that researchers should follow Marres’ ‘affirmative’ approach to the problem and reflect on whether sources of potential bias should be corrected or are, in fact, part of the empirical object in question. We argue that VCPA addresses two sources of digital bias in need of a corrective: single-platform studies and text-focused research strategies. The latter is of particular interest and in need of further research to identify the potential for visual research that is not beholden to text-based search strategies (for example, using the Google Vision API).
The research is important in opening new avenues for digital methods. Empirically, we have illustrated how VCPA can bring new insights to familiar topics such as climate change communication. Future research could utilise VCPA to more comprehensively analyse the state of the art in social media climate change communication. In terms of the-ory, we have shown how VCPA can contribute to our understanding of connective action, both within platforms (the example of Instagram reposting) and between platforms (the example of Twitter screenshots appearing on Tumblr). Further empirical research could focus on connective action across platforms, whether it is related to particular issues and how screenshotting complements platforms’ native features for circulating content.
With composite images we have identified the potential for creative, artistic methods for VCPA. Our call for researchers to expand their scope beyond the textual also extends to research practices themselves: research questions about images can be addressed with the production of new images to complement textual explanation. The composite images we show here are an early experiment in such methods, but one which we believe warrants further development and methodological reflection; for example, the potential for composite images to extend beyond analysis of high-engagement images to aid deeper analysis of visual vernaculars that co-exist within and between platforms.
Finally, we return to our original definition of VCPA as the study of still and moving images across two or more social media platforms. In this article we have focused on still images, but there is great empirical and theoretical interest in the analysis of videos and GIFs across social media platforms (Highfield & Leaver,2016). Such content is ubiquitous on social media but provides greater methodological challenges in terms of data collection and analysis, particularly at scale, than those presented here for still images. This is the next frontier for VCPA.
Notes
1. Liked posts are also more visible on Twitter than Instagram, as a user sometimes sees posts liked by the users they are following in their main timeline.
2. While this question is of obvious interest to many observers, we are aware that it implicitly prioritises users with more social capital.
Acknowledgements
WP and SO thank the Economic and Social Research Council for funding Making Climate Social (ES/N002016/1) through the Future Research Leaders programme. The authors are grateful to read-ers and reviewread-ers for their helpful comments, especially Helen Kennedy and Ysabel Gerrard. The article came directly from two data sprints at the Digital Methods Initiative Summer School, Uni-versity of Amsterdam in 2017; thanks to the co-ordinators Sabine Niederer, Natalia Sánchez-Quér-ubin and Fernando van der Vlist and Richard Rogers, to the invaluable design assistance of Andrea Benedetti, Beatrice Gobbo, Federica Bardelli, Carlo de Gaetano and Michele Mauri, and to project participants Alessandra Del Nero, Emile den Tex, Lauren Drakopulos, Rahel Estermann, Simon Gottschalk, Esther Hammelburg, Phillip Morris, Rebekka Stoffel, Mischa Szpirt, Sofie Thorsen, Ras-mus Tyge Haarløv, Anne van den Dool and Pieter Vliegenthart.
Disclosure statement
No potential conflict of interest was reported by the authors.
Funding
This work was supported by Economic and Social Research Council [grant number ES/N002016/1].
Notes on contributors
Warren Pearceis a Research Fellow at University of Sheffield within the iHuman institute and the
Department of Sociological Studies. His main research interests are digital methods and the use of scientific knowledge in society. Warren combines these in Making Climate Social, a project inves-tigating social media content and conversations about climate change.
Suay M. Özkulais a Post-doctoral Research Associate in digital sociology at the University of Sheffield. Her research focuses on social media cultures and socio-political empowerment around large-scale societal phenomena including climate change and human rights activism. Prior to Sheffield, she completed a PhD in Sociology at the University of Kent.
Amanda K. Greeneis a doctoral candidate in English Language and Literature, with a certificate in
STS, at the University of Michigan. Her research operates at the nexus of visual culture, digital studies, and the health humanities, attending especially to how new media condition embodied encounters with chronic pain and vulnerability.
Lauren Teelingis the recipient of a postgraduate research scholarship with the School of Communi-cations in Dublin City University (DCU) Ireland. Lauren’s primary research focus is the use of social media by militaries as a tool of strategic communication in a hybrid media environment.
Jennifer Bansardis a doctoral researcher and lecturer at the University of Potsdam’s Chair of Inter-national Politics. Her research centers on the role of knowledge and science-policy networks in the emergence and institutionalization of new issues in global environmental governance, specifically in climate change and marine biodiversity policy.
Janna Joceli Omenais a doctoral researcher in Digital Media UT Austin/Portugal Program at Uni-versidade Nova de Lisboa, in which she integrates iNOVA Media Lab as a member of the scientific commission and coordinator of the SMART Data Sprint. Her research concerns the technicity of social media platforms and how it facilitates or compromises digital research, paying particular
attention to the regimes of functioning of APIs, and natively digital objects. Besides theorizing digi-tal methods, Janna has special interest in software and platform studies.
Elaine TeixeiraRabello is Associate Professor in Social Medicine Institute, State University of Rio de Janeiro, and a guest researcher at Oswaldo Cruz Foundation. She is a psychologist, holding a Collective Health PhD, developing research about science and technology in health, qualitative methodologies and digital methods.
ORCID
Warren Pearce http://orcid.org/0000-0001-6884-3854
Suay M. Özkula http://orcid.org/0000-0002-1674-5491
Amanda K. Greene http://orcid.org/0000-0003-1035-5617
Lauren Teeling http://orcid.org/0000-0002-5460-1501
Jennifer S. Bansard http://orcid.org/0000-0002-5955-5815
Janna Joceli Omena http://orcid.org/0000-0001-8445-9502
Elaine Teixeira Rabello http://orcid.org/0000-0002-8324-1453
References
Baym, N. K. (2013). Data not seen: The uses and shortcomings of social media metrics. First Monday, 18(10). Retrieved fromhttp://www.ojphi.org/ojs/index.php/fm/article/view/4873
Begley, J. (2017). Every NYT front page since 1852. Retrieved fromhttps://vimeo.com/204951759
Bennett, W. L., & Segerberg, A. (2012). The logic of connective action. Information, Communication & Society, 15(5), 739–768.doi:10.1080/1369118X.2012.670661
Borra, E., & Rieder, B. (2014). Programmed method: Developing a toolset for capturing and ana-lyzing tweets. Aslib Journal of Information Management, 66(3), 262–278. doi:10.1108/AJIM-09-2013-0094
boyd, d., & Crawford, K. (2012). Critical questions for big data. Information, Communication & Society, 15(5), 662–679.doi:10.1080/1369118X.2012.678878
Bruns, A., & Burgess, J. (2015). Twitter hashtags from ad hoc to calculated publics. In Hashtag pub-lics: The power and politics of discursive networks (pp. 13–28). New York, NY: Peter Lang. Bruns, A., & Stieglitz, S. (2014). Twitter data: What do they represent? Information Technology, 56
(5), 240–245.doi:10.1515/itit-2014-1049
Burgess, J. (2006). Hearing ordinary voices: Cultural studies, vernacular creativity and digital story-telling. Continuum, 20(2), 201–214.
Burgess, J., & Bruns, A. (2012). Twitter archives and the challenges of“big social data” for media and communication research. M/C Journal, 15(5), Retrieved fromhttp://journal.media-culture. org.au/index.php/mcjournal/article/view/561
Burgess, J., & Matamoros-Fernández, A. (2016). Mapping sociocultural controversies across digital media platforms: One week of #gamergate on Twitter, YouTube, and Tumblr. Communication Research and Practice, 2(1), 79–96.doi:10.1080/22041451.2016.1155338
Corner, A., Webster, R., & Teriete, C. (2015). Climate visuals: Seven principles for visual climate change communication (based on international social research). Oxford: Climate Outreach. DeLuca, K. (2006). Images, audiences, and readings. In S. Manghani, A. Piper, & J. Simons (Eds.),
Images: A reader (pp. 188–193). London: Sage.
Duguay, S. (2016). Lesbian, gay, bisexual, trans, and queer visibility through selfies: Comparing
platform mediators across Ruby Rose’s Instagram and Vine presence. Social Media+ Society, 2 (2), 2056305116641975.
Feuz, M., Fuller, M., & Stalder, F. (2011). Personal web searching in the age of semantic capitalism: Diagnosing the mechanisms of personalisation. First Monday, 16(2),doi:10.5210/fm.v16i2.3344
Gerrard, Y. (2018). Beyond the hashtag: Circumventing content moderation on social media. New Media & Society.doi:10.1177/1461444818776611
Gibbs, M., Meese, J., Arnold, M., Nansen, B., & Carter, M. (2015). #Funeral and instagram: Death, social media, and platform vernacular. Information, Communication & Society, 18(3), 255–268.
doi:10.1080/1369118X.2014.987152
Gillespie, T. (2010). The politics of‘platforms. New Media & Society, 12(3), 347–364.doi:10.1177/ 1461444809342738
Halfpenny, P., & Procter, R. (2015). Innovations in digital research methods. Los Angeles, CA: SAGE Publications Ltd.
Helmond, A. (2015). The platformization of the web: Making web data platform ready. Social Media + Society, 1(2), 2056305115603080.doi:10.1177/2056305115603080
Highfield, T., & Leaver, T. (2016). Instagrammatics and digital methods: Studying visual social media, from selfies and GIFs to memes and emoji. Communication Research and Practice, 2 (1), 47–62.doi:10.1080/22041451.2016.1155332
Jay, M. (2006). The dialectic of enlightenment. In J. Morra, & M. Smith (Eds.), Visual culture: Critical concepts in media and cultural studies (pp. 65–75). London: Routledge.
Jewitt, C. (2014). The Routledge handbook of multimodal analysis (2nd ed.). Abingdon: Routledge. Kennedy, H., Moss, G., Birchall, C., & Moshonas, S. (2015). Balancing the potential and problems of digital methods through action research: Methodological reflections. Information, Communication & Society, 18(2), 172–186.doi:10.1080/1369118X.2014.946434
Kirilenko, A. P., Molodtsova, T., & Stepchenkova, S. O. (2015). People as sensors: Mass media and local temperature influence climate change discussion on Twitter. Global Environmental Change, 30, 92–100.
Kirilenko, A. P., & Stepchenkova, S. O. (2014). Public microblogging on climate change: One year of Twitter worldwide. Global Environmental Change, 26, 171–182.doi:10.1016/j.gloenvcha.2014.02. 008
Kress, G. R., & van Leeuwen, T. (2001). Multimodal discourse: The modes and media of contempor-ary communication. Oxford: Oxford University Press.
Leonardo Di Caprio (leonardodicaprio). (2017, May 1). Instagram post by Leonardo DiCaprio. Retrieved fromhttps://www.instagram.com/p/BTjxCxPhqq-/
Light, B., Burgess, J., & Duguay, S. (2016). The walkthrough method: An approach to the study of apps. New Media & Society, 1461444816675438.doi:10.1177/1461444816675438
Lupton, D. (2014). Digital sociology. London: Routledge.
Mahony, M., & Hulme, M. (2012). The colour of risk: An exploration of the IPCC’s “burning
embers” diagram. Spontaneous Generations: A Journal for the History and Philosophy of Science, 6(1), 75–89.doi:10.4245/sponge.v6i1.16075
Maier, N., Parodi, F., & Verna, S. (2016). DownThemAll! (Version 3.0.8) [Mozilla Firefox]. Retrieved fromhttps://addons.mozilla.org/en-US/firefox/addon/downthemall/
Manovich, L. (2016). Instagram and contemporary image. Manovich.net. Retrieved fromhttp:// manovich.net/index.php/projects/instagram-and-contemporary-image
Marres, N. (2017). Digital sociology. Bristol: Polity Press.
Mendelson, A. L., & Papacharissi, Z. (2010). Look at us: Collective narcissism in college student Facebook photo galleries. In Z. Papacharissi (Ed.), A networked self: Identity, community and cul-ture on social network sites (pp. 251–273). New York, NY: Routledge.
Mirzoeff, N. (1999). An introduction to visual culture. London: Routledge.
Mitchell, W. J. T. (1986). Iconology: Image, text, ideology. Chicago: University of Chicago Press. Niederer, S., & Pearce, W. (2017). Making climate visual part II: Climate change imagery after
Trump announced the US withdrawal from the Paris Agreement. Amsterdam: University of Amsterdam. Retrieved fromhttps://digitalmethods.net/Dmi/ClimateChangeAlpsWikipedia
Norris, S. (2004). Analyzing multimodal interaction: A methodological framework. London: Routledge.
O’Neill, S. J., & Smith, N. (2014). Climate change and visual imagery. Wiley Interdisciplinary Reviews: Climate Change, 5(1), 73–87.doi:10.1002/wcc.249
Palmer, D. (2010). Emotional archives: Online photo sharing and the cultivation of the self. Photographies, 3(2), 155–171.
Pearce, W., Holmberg, K., Hellsten, I., & Nerlich, B. (2014). Climate change on Twitter: Topics, communities and conversations about the 2013 IPCC Working Group 1 Report. PLOS ONE, 9(4), e94785.doi:10.1371/journal.pone.0094785
Pearce, W., & Ozkula, S. M. (2017). Studying platform visual vernaculars using digital methods. Amsterdam: University of Amsterdam. Retrieved from https://wiki.digitalmethods.net/Dmi/ MakingClimateVisible
Rieder, B. (2013). Studying Facebook via data extraction: The Netvizz application. In Proceedings of the 5th annual ACM web science conference (pp. 346–355). ACM. Retrieved fromhttp://dl.acm. org/citation.cfm?id=2464475
Rieder, B. (2015a). TumblrTool: A small script to create a networkfile from co-tagging on tumblr. PHP. Retrieved fromhttps://github.com/bernorieder/TumblrTool
Rieder, B. (2015b). Visual Tagnet Explorer (Version 1.1). Retrieved from https://tools. digitalmethods.net/netvizz/instagram
Roberts, S., Snee, H., Hine, C., Morey, Y., & Watson, H. (2016). Digital methods for social science– an interdisciplinary guide to research innovation. Basingstoke: Palgrave Macmillan.
Rogers, R. (2017a). Digital methods for cross-platform analysis. In J. Burgess, A. Marwick, & T. Poell (Eds.), The SAGE handbook of social media (pp. 91–110). London: SAGE.
Rogers, R. (2017b). Foundations of digital methods: Query design. In M. T. Schäfer, & K. van Es (Eds.), The datafied society: Studying culture through data (pp. 75–94). Amsterdam: Amsterdam University Press.
Serafinelli, E. (2017). Analysis of photo sharing and visual social relationships: Instagram as a case study. Photographies, 10(1), 91–111.doi:10.1080/17540763.2016.1258657
Stafford, B. M. (1998). Good looking: Essays on the virtue of images. Cambridge, MA: MIT Press. Thelwall, M., Goriunova, O., Vis, F., Faulkner, S., Burns, A., Aulich, J., & D’Orazio, F. (2016).
Chatting through pictures? A classification of images tweeted in one week in the UK and USA. Journal of the Association for Information Science and Technology, 67(11), 2575–2586. Tiffany & Co. (tiffanyandco). (2017, May 9). Instagram post by Tiffany & Co. Retrieved fromhttps://
www.instagram.com/p/BT3u0i5gtpJ/
Tufte, E. R. (2001). The visual display of quantitative information (2nd ed.). Cheshire, CT: Graphics Press USA.
van Dijck, J. (2008). Digital photography: Communication, identity, memory. Visual Communication, 7(1), 57–76.
Visual Computing. (2018). Visual Computing Group at the HTW Berlin. Retrieved June 7, 2018, fromhttps://visual-computing.com/
Zimmer, M., & Proferes, N. J. (2014). A topology of Twitter research: Disciplines, methods, and ethics. Aslib Journal of Information Management, 66(3), 250–261. doi:10.1108/AJIM-09-2013-0083