A Work Project, presented as part of the requirements for the
Master of Science in Economics Degree from Nova School of Business and Economics.
Should We Fear the Walking Dead?
The Role of Zombie Firms for Productivity
Developments in Portugal
Christian Osterhold, 3086
A project carried out in cooperation with the Portuguese Ministry of Finance under the supervision of:
Ana FONTOURA GOUVEIA(GPEARI – Ministry of Finance)
and Susana PERALTA(Nova SBE)
Should We Fear the Walking Dead?
The Role of Zombie Firms for Productivity Developments in Portugal
Abstract
Productivity growth is slowing down among OECD countries. A recent strand of literature focuses on the role of unviable firms, so-called “zombie firms”, to explain the slowdown. Using comprehensive firm-level data, we find that by being unproductive and by obstruct-ing the rest of the economy through resource misallocation, zombie firms stifle firm perfor-mance in Portugal. This is a precarious finding as the share of zombie firms in Portugal has risen steadily from 2008 to 2013, exceeding the OECD average. Furthermore, we show that recent structural reforms in Portugal have potentiated the exit of zombie firms by reducing policy-induced exit barriers.
Keywords: Zombie Firms, Labor Productivity, Firm Exit
Acknowledgments
I express my sincerest gratitude to Ana Fontoura Goveia (GPEARI – Ministry of Finance and Nova SBE) for guidance and motivation and Susana Peralta (Nova SBE) for additional supervision and helpful suggestions. I am thankful for Ana Filipa Fernandes’ treatment of the database and for Mónica Simões’ helpful advice (both GPEARI – Ministry of Finance). Moreover, I would like to thank Banco de Portugal, in particular Carla Ferreia (Banco de Portugal), for providing the database and helpful information and Luísa Farinha (Banco de Portugal) on guidance for relevant variables. I would like to thank Dan Andrews, Müge Adalet McGowan and Valentine Millot (all OECD) for providing guidance on the STATA code and clarifications. I thank Tiago Martins for advice on sourcing and treating indus-try data and Daniela Cruz for helpful additional information (both GPEARI – Minisindus-try of Finance).
1
Introduction
The last two decades have seen enormous progress in information and communication technolo-gies (ICT), improved healthcare and a better than ever educated workforce (Peña-López, 2017; Jack and Lewis, 2009). These are conditions that should provide the basis for the economy to strive and to be more productive. However, aggregate data show a slowdown in global pro-ductivity growth, the key long-term determinant of living standards, which has raised a debate about the underlying reasons of this development (Adler et al., 2017).
So far, the debate has often been held at the macro-level. Structural headwinds like an aging workforce, slowing global trade and a fading ICT boom are being named as contributors to the productivity growth slowdown (Adler et al., 2017). Robert Gordon (2017) argues in his New York Times bestseller “The Rise and Fall of American Growth” that innovation has stalled and that current innovations at the technological frontier will not have comparable impacts on our economy like the steam engine had in the past. On the contrary, Brynjolfsson and McAfee (2014) are convinced, that a new growth disruption will start in the near future, once the potential of new technological advances is fully exploited, enabling a second economic (growth) revolution. The answer to who is right or wrong is somewhat subject to the personal optimism or pessimism towards technology, as innovation is per se unpredictable.
A less subjective and more quantitative argument is mis-measurement of productivity in the digital economy, implying that overall performance is growing, but existing economic measures fail to capture it. Adler et al. (2017) show that mis-measurement is an issue, but the contribution of this new digital industry to the overall output is too small to explain a major part of the productivity slowdown. Analyses of aggregate data identified a decrease in labor productivity as the primary driver of the productivity growth slowdown (OECD, 2016).
Even if we agree with the previously named argumentation, further analysis of aggregate data might not yield additional meaningful insights, as the considered aggregation level does not capture firm heterogeneity. Increasing use of firm-level data in empirical analyses uncov-ered asymmetric firm-level dynamics between countries and even within narrowly defined in-dustries (ECB, 2017). A sole focus on analyzing country or industry-average productivity data can, therefore, result in misleading conclusions of the drivers of the productivity slowdown (Andrews and Petroulakis, 2017).
Shifting the debate to a micro-perspective has shown to yield more conclusive insights on the contributors to the global productivity slowdown. Firm-level data revealed asymmetric firm dynamics in OECD countries, in the form of a growing performance gap between the most productive firms (those at the frontier) and the rest, the so-called “laggards”(Adalet McGowan et al., 2017a). Likewise, this “winner takes it all dynamics”, p. 7, Andrews et al. (2016), can be observed in Portugal, where industry frontier firms are improving their performance, whereas less productive firms (non-frontiers) stagnate in growth (Figure 1).
Figure 1: Productivity Developments in Portugal from 2006 to 2015
.9 1 1.1 1.2 la bor produc ti vi ty (i nde xe d t o 2006) 2006 2007 2008 2009 2010 2011 2012 2013 2014 2015 year
frontier firms (top 10 %) laggard firms
Source: Authors own computations based on firm-level data from Portugal.
Notes: Non-financial and non-farming 2-digit NACE Rev. 2 business industry averages. Labor productivity defined as Gross Value Added (GVA) per worked hour. Frontier firms are the top 10 % most productive companies in each two-digit sector industry in each year. Overall results are robust, when defining the frontier as the top 5 %, when defining the frontier at different industry-levels and when using the number of workers instead of worked hours to compute labor productivity.
A recent strand of literature, led by the OECD, is focusing on the role of so-called “zombie” firms in explaining this diversion in productivity and the overall productivity slowdown (Adalet McGowan et al., 2017a/b/c). Zombie firms are the result of a “depressed creative destruction” process as Adalet McGowan et al. (2017a) p. 6 argue, which lead to a prolonged existence of unviable firms in the market. By capturing resources in low productive activities, these zom-bie firms contribute to the increasing divergence between frontier and laggard firms, dragging aggregate productivity down (Adalet McGowan et al., 2017a).
the economy from 2006 to 2015, we take stock of the prevalence and characteristics of zombie firms in Portugal. Furthermore, the impact of zombie firms on non-zombie firms as well as the exit propensities of zombie firms will be analyzed.
The thesis constitutes a horizontal addition to existing cross-country research on zombie firms done by the OECD productivity work-stream (Adalet McGowan et al., 2017a). In contrary to the OECD, which is using a possibly biased sample, we investigate the complete population of firms and thus obtain a better depiction of the economy. In addition to existing research, we provide an analytical way of analyzing firm dynamics by modeling the probability of exit com-paring zombie and non-zombie firms and the effectiveness of insolvency regimes. As Portugal has performed a number of relevant reforms (section 3), it can be seen as a case study on the effects of the insolvency regime changes.
We show that the share of zombie firms increased in the Portuguese economy from 2008 to 2013 by 35 % and decreased afterward. Even when considering the decrease of zombie firms, the values are still well above the OECD average. This is concerning when considering our findings that zombie firms are on average larger and less productive than their non-zombie counterparts. Furthermore, we show, that zombie congestion stifles productivity performance of non-zombie firms via negative spillover effects. Our analysis of firm dynamics however reveals, that well-designed insolvency regimes are one remedy to the problem and beneficial for improving the exit margin of zombie firms. The year 2013 marks a turning point in zombie congestion, which is partly driven by recent structural reforms in Portugal.
The thesis is organized as follows. Section 2 provides a literature review of the current research on the emergence of zombie firms and illustrates their consequences for the economy in different countries. This is followed by a presentation of the firm-level database Informação Empresarial Simplificada (IES), explaining in detail the main variables, and a description of the insolvency indicator and the industry-level data of our analysis. Section 4 takes stock of the prevalence and characteristics of zombie firms in the Portuguese economy from 2008 to 2015 and compares them to the OECD benchmark. Empirical frameworks for assessing the impact of zombie congestion on non-zombie firms and the firm dynamics of zombie firms are developed in section 5 and their estimates are presented in section 6, followed by the conclusion.
2
Literature Review on Zombie Firms
The productivity work-stream, led by the OECD, has started an extensive body of research explaining part of the productivity slowdown through policy-induced barriers that hinder a well functioning creative destruction process (Adalet McGowan et al., 2017a/b/c). These policy dimensions appear in the form of structural policy weaknesses (i.e. high barriers to corporate restructuring), weak banking health and bank forbearance, loose monetary policy and post-crisis support of small and medium-sized enterprises (Adalet McGowan et al., 2017a). Following the definition of the OECD productivity work-stream, we define zombie firms as businesses that are at least ten years old (not to capture start-ups which are in a developing phase) and whose operating income cannot cover the interest expenses for at least three consecutive years. This section investigates the aforementioned policy dimensions and their connection to how zombie firms emerge and concludes with the consequences of zombie congestion.
So far the literature has focused on barriers to market entry. However, micro-evidence shows the importance of the exit margin as a source of productivity weakness. Three policy induced structural weaknesses can be identified, which foster the emergence of zombie firms by slowing down the functioning of the creative destruction process and thus impairing the exit margin (Andrews and Petroulakis, 2017).
First, a breakdown in the technological diffusion mechanism, in the form of a widening gap between global frontier and laggard firms (in each industry), leads to an increasing productiv-ity dispersion (Andrews et al., 2016). This dispersion is a surprising result, considering either the Neo-Schumpeterian growth theory, where laggard firms should be forced to exit, or models of competitive diffusion, where laggard companies are supposed to adapt frontier technology without too much research and development effort. These theories would predict the gap to close rather than to widen (Andrews et al., 2016). Second, rising capital misallocation has made it increasingly difficult for productive firms to access resources as shown in Gopinath et al. (2017) and ECB (2017). Within-industry resource allocation is one of the primary drivers of productivity growth slowdown and it is another source of concern (Andrews and Petroulakis, 2017). Third, rising productivity dispersion and a decrease in productivity-enhancing capital al-location are related to a reduction in business dynamism and declining firm entry rates (Decker et al., 2016). These inter-connected structural weaknesses represent sources of zombie
con-gestion but consequences in themselves, which makes a strict distinction between sources and consequences of zombie prevalence difficult.
In addition to structural weaknesses, poor banking sector health constitutes another source of zombie congestion. The Outright Monetary Transactions (OMT) Program by the European Central Bank in 2012 has been named as a contributor to the survival of zombie firms. Acharya et al. (2017) show that OMT windfalls have been used by banks to increase the amount of loans to weak firms that they already have been in connection with, rather than with new companies, which are potentially young and innovative. Moreover, they show that new funds have not been used for investments or employment, but rather for unproductive tasks like building up cash reserves.
Literature shows that the zombie firm phenomenon is widespread. Historically, the analysis of zombie firms originated with the Japanese macroeconomic stagnation in the 1990’s, with a focus on bank forbearance (Caballero et al. 2008; Adalet McGowan et al., 2017a). Lam et al. (2017) have illustrated the prevalence and strong linkage of zombie firms to state-owned enterprises in China. Schivardi et al. (2017) investigated zombie developments in Italy and found that undercapitalized banks were less likely to stop giving credit to unviable firms.
Investigating the sources of zombie firms is one crucial aspect, but one has also to consider the consequences of a high prevalence of zombie firms in an economy. On average, zombie firms are less productive than their non-zombie counterparts, dragging aggregate productivity down through themselves. Moreover, they have negative spillover effects on all other com-panies by draining out resources (i.e. labor and investments) from the average non-zombie firm and hindering the expansion of productive companies by not exiting the market. The re-sulting resource misallocation leads to overall negative effects on firm performance. Highly zombie-congested industries tend to show less employment growth in non-zombie firms, which indicates that firm expansion is more restricted (Caballero et al., 2008). Reduced investments by non-zombie firms lead to shortcomings in innovation and technology advances, which de-press within-firm productivity growth (Cooper et al., 1997; Adalet McGowan et al., 2017a). Furthermore, the productivity gap between zombies and non-zombies increases due to addi-tional market entry barriers imposed by the presence of zombies, (i.e. higher salaries and lower product prices due to unprofitable business plans) which a newly founded firm has to trespass
(Caballero et al., 2008). Thus, only the most productive firms can enter the market. Capital misallocation caused by zombie firms in Italy decreased the exit probability of zombie firms and increased the failure rate of non-zombie firms (Schivardi et al., 2017). In China zombie firms are contributing to lower productivity by themselves while also being a significant part of rising corporate debt (Lam et al., 2017).
3
Data
3.1
Firm-Level Data
We rely on Portuguese firm-level data for the period 2006 to 2015, obtained from Informação Empresarial Simplificada (IES) provided by Banco de Portugal. IES is a firm-level database, covering the entire population of Portuguese firms, including profit and loss, balance sheets, trade and employment data with an overall of 3,840,634 observations. The classification of industries is made in accordance with the Statistical Classification of Economic Activities in the European Union, Revision 2 (NACE Rev. 2). Our data cover the non-farm and the non-financial business industries, NACE Rev. 2 industry codes 10-83, excluding 64-66. This restriction excludes industries that are providing public services (i.e. education and healthcare) as their business models are not primarily focused on profit maximization. We drop self-employed and inactive businesses. Values are deflated by industry-specific gross value added (GVA) deflators and industry-specific gross fixed capital (GFCF) formation deflators at one-digit level, obtained from Statistics Portugal (INE).
A number of adjustments to the dataset are performed to ensure the robustness of the results. Negative, missing and nil values for the variables turnover, assets, intangibles and tangible assets, total workers, paid workers, worked hours and labor costs are dropped. Assumptions of feasible working hours and viable revenues per employee have been made to account for outliers and misreporting. Firms with overall more than a one-year reporting gap are discarded. If a firm fulfills all zombie criteria, but has a one year research gap, the "three consecutive year" criterion does not hold, hence the firm would falsely be classified as a zombie. To account for this case and not to bias the zombie identification in favor of non-zombies, one year reporting gaps have been interpolated linearly. Data adjustment through linear interpolation has been
done by various researchers, such as Bassanini and Duval (2006) and OECD (2003). After data treatment the unbalanced panel dataset includes 288,545 firms and 1,820,742 observations, which constitutes 47 % of the original database.1
Figure 2: Descriptive Statistics for Portuguese Firm-Level Data, 2008 to 2015
Variable Unit Mean Median Std. Dev. Min Max
Turnover 10# € 1,411 157 28,031 0 9,699,709 Tangible Assets 10# € 460 23 15,944 0 4,646,097 Labor Productivity € / h 10 7 52 -7716 19,610 Labor Costs 10# € 198 38 2,258 0 415,122 GVA 10# € 298 46 5,012 -139117 1,287,741 EBIT 10# € 42 3 2,365 -379964 792,503 Interest Paid 10# € 26 1 1,250 0 783,815 No of Employees unit 12 4 110 1 23,768
Variable Unit Mean Median Std. Dev. Min Max
Turnover 10# € 1401 151 29029 0 9.699.709
Tangible Assets 10# € 456 22 15652 0 4.615.280
Intangible Assets 10# € 91 0 8879 0 2.964.748
Δlog Investment 9 9 2 -18 26
Labor Productivity € / h 10 7 52 -7716 19.610
Total Workers (Emp) per firm 12 4 114 1 22.768
∆log Emp -0,012 0 0,315 -6,974 5,437
Exit dummy 0,084 0 0,278 0 1
Exit Non-Zombie dummy 0,081 0 0,273 0 1
Exit Zombie dummy 0,132 0 0,339 0 1
Source: Authors own computations based on IES.
Notes: Non-financial and non-farming 2-digit business industry averages. Labor productivity de-fined as Gross Value Added (GVA) per worked hour. The variable Exit is only available from 2008 to 2014.
A change in accounting standards has taken place from 2009 to 2010, which is being ac-counted for by using ratios and time controls where needed (Banco de Portugal, 2011). The accounting rules for tangible and intangible assets have changed a lot as a result of the system change. Especially, intangible assets are clearly underreported and their measurement is prone to weaknesses. Capital will thus be defined as the stock of tangible assets, excluding intangible assets, as it has been found to be the best fitting approximation with the available data. Ro-bustness checks with varying definitions of capital including intangible assets are conducted as well.
One of the key variables of our analysis is labor productivity, which is defined as gross value added (GVA) per hour. We calculate GVA as the sum of turnover and operating subsidies, minus cost of goods sold and supplies and external services, following Banco de Portugal (2014) as far as data availability allows. Robustness checks with varying definitions of labor input are also conducted. Other key variables are earnings before interest and tax (EBIT) calculated following
1Excluding a sizable amount of observations is common when working with this kind of data and topic, see
Banco de Portugal (2014), as far as data availability allows, which is divided by a firms interest expenses to calculate the interest coverage ratio (ICR).
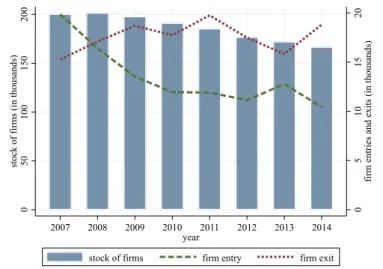
Figure 3: Portuguese Firm Entry and Exit from 2008 to 2015
0 5 10 15 20 fi rm e nt ri es a nd e xi ts (i n t hous ands ) 0 50 100 150 200 st oc k of fi rm s (i n t hous ands ) 2007 2008 2009 2010 2011 2012 2013 2014 year
stock of firms firm entry firm exit
Source: Authors own computations based on IES.
Notes: Non-financial and non-farming 2-digit business industry averages. The variable Exit is only available from 2007 to 2014.
Values for firm entry, exit and the age of firms as shown in Figure 3 have been calculated using the "tsspell" command in STATA. The overall number of firms in Portugal decreased over the considered time period, which is caused by decreasing firm entry and higher, but volatile, firm exit rates.2
3.2
Industry-Level Data and Insolvency Indicator
To analyze the link between insolvency regimes and firm exit, we use new country-level OECD insolvency indicators, which we break down to industry-level by using the natural firm turnover rates of the United States (US) and the United Kingdom (UK). The original OECD indicator range from 0 to 1, where value 0 represents "good insolvency regimes", meaning low barriers to exit and value 1 represents high barriers to restructuring or exit. By circulating a questionnaire covering mainly yes/no questions and numbers, the indicator was designed to understand key features of insolvency regimes in eight areas over the timeframe of 20 years in 5-year intervals. Examples of interest areas are "treatment of management during restructuring" and the
"possi-2Decreasing firm entry rates suggest a declining business dynamism, as shown in Decker et. al (2016) for the
bility and priority of new financing". When the composite indicator is high, meaning close to 1, insolvency regimes are not well designed, and the attached exit costs will most likely lead to a delay in the initiation of the insolvency process and furthermore, prolong the duration of the proceedings (Adalet McGowan et al., 2017b).
The original OECD Data is annualized for Portugal by considering major legislative changes that improved Portuguese insolvency regimes in a respective year. Several legislative changes have been made in the observed time period. In 2008 voluntary liquidation of commercial enterprises was introduced by legislation. Moreover, insolvency was made more accessible by removing the necessity of a formal insolvency notice in newspapers, speeding up the insolvency process for small debtors and introducing new practices to accelerate payments to insolvency administrators in 2009 (World Bank, 2017). After the financial crisis, Portugal requested exter-nal advisory by the Troika in April 2011. Therefore, a memorandum of understanding including a three-year structural reforms program (i.e. amendments to the existing insolvency policies) was developed and executed between 2011 and 2014 where major structural changes have been implemented (Dinis and Cordas, 2017; European Commission, 2016). In 2013 legislation en-acted a law that accelerates liquidation processes and introduces advanced in and out of court fast-track procedures (World Bank, 2017). By implementing structural reforms, Portugal ex-hibited one of the best improvements (highest declines) in the OECD indicators from 2010 to 2016 in comparison to the OECD counterparts. The OECD indicator as well as yearly weighted values can be found in the Appendix.
Data on industry firm turnover rates, computed as the entry rate plus exit rate, following Bottasso et al. (2017) and Adalet McGowan et al. (2017c) of the UK and the US are used to indicate the exposure of an industry to insolvency regimes. Higher turnover industries are more prone to policy-induced insolvency regime changes than industries with lower turnover rates. Markets of the UK and the US are relatively unregulated and will thus be used to approximate natural turnover rates of each two-digit industry. By using natural turnover rates, we account for endogeneity issues when comparing Portuguese sectors as their industry-level firm turnover rates could be biased by existing national and sectoral regulations (Correira and Gouveia, 2017). For the UK, data of the "SDBS Business Demography Indicators (ISIC Rev. 4)" database from the OECD is used to compose a three-year average between 2012 and 2014 in NACE Rev. 2
industry classification. For the US, data of the "SDBS Business Demography Indicators (ISIC Rev. 3)" has been matched to ISIC Rev. 4 classification and aggregated to 2-digit NACE Rev. 2. A six-year average between 2007 and 2012 has been composed for the US.
4
Zombies in the Portuguese Economy from 2008 to 2015
Following Adalet McGowan et al. (2017a), we define zombie firms as those that are at least ten years old and whose interest coverage ratio (ICR) is smaller than one for at least three consecutive years. Data is available as of 2006, hence the analysis starts in 2008, since it is the first year in which a firm could possibly trespass the "three consecutive years" condition to be classified as a zombie firm. The timeframe covers the beginning of the financial crisis in 2008 and the sovereign debt crisis including the bailout period that started in 2011 for Portugal. The developments, need to be taken under consideration when assessing the Portuguese economy.
Figure 4: Zombie Share in Portugal
0 1 2 3 4 5 6 7 8 9 10 zom bi e fi rm s / a ll fi rm s (i n %) 2008 2009 2010 2011 2012 2013 2014 2015 year
Source: Authors own computations based on IES.
Notes: Non-financial and non-farming 2-digit business industry averages, zombie share de-fined as (zombie firms/total firms).
Figure 5: Zombie Share in Industries
0 5 10 15 zom bi e fi rm s / a ll fi rm s (i n %) C D E F G H I J L M N one-digit NACE industry
zombie share in 2015 zombie share in 2010
Source: Authors own computations based on IES.
Notes: Non-financial and non-farming 2-digit business industry averages, zombie share de-fined as (zombie firms/total firms) in Portugal. Footnote 3 explains industries.
This section explores the prevalence of zombie firms in the Portuguese economy. Figures 4 and 5 show the zombie share (number of zombie firms / number of all firms) in Portugal from 2008 to 2015 and an average for different portuguese industries for the years 2012 and 2015.
Figure 6: Zombie Congestion over Time 0 5 10 15 20 25 30 re sourc es s unk i n % 2008 2009 2010 2011 2012 2013 2014 2015 year
workers employed in zombies / all workers capital in zombies / total capital
Source: Authors own computations based on IES.
Notes: Non-financial and non-farming 2-digit business industry averages, zombie share de-fined as (zombie firms/total firms).
Figure 7: Zombie Congestion in Sectors
0 10 20 30 40 re sourc es s unk i n % C D E F G H I J L M N one-digit NACE industries
capital of zombies / total capital workers employed in zombies / total workers
Source: Authors own computations based on IES.
Notes: Non-financial and non-farming 2-digit business industry averages, zombie share de-fined as (zombie firms/total firms). Footnote 3 explains industries.
and started declining afterwards, reaching 7.5 % in 2015 (Figure 4). These results hide con-siderable sectoral heterogeneity (Figure 5). The zombie share ranges from less than 4 % in professional, scientific and technical activities to almost 14 % for the accommodation and food service industry.3 Heterogeneity not only exists at sectoral-level, there is also variation over
time.
In terms of international comparisons, the overall value for Portugal in 2013, the latest year available in Adalet McGowan et al. (2017a), is higher than that of the sub-set of OECD countries (5 %) used in the OECD study (Belgium, Finland, France, Italy, Korea, Spain, Sweden and the United Kingdom). The values are close, but below, to those of Spain, the country with one of the highest zombie shares in the aforementioned OECD paper. A sole focus of the number of zombie firms leads to an incomplete assessment, since the presented zombie firms are larger than their non-zombie counterparts.
Figures 6 and 7 depict the share of the economies capital and employment that is sunk in zombie firms. In line with the results of Adalet McGowan et al. (2017a), the share of sunk
3Industries: C - manufacturing, D - electricity, gas, steam and air conditioning supply, E - water supply.
Sewer-age, waste management and remediation, F - construction, G - wholesale and retail trade, repair of motor vehicles and motorcycles, H - transportation and storage, I - accommodation and food service activities, J - information and communication, L - real estate activities, M - professional, scientific and technical activities, N - administrative and support service activities.
employment (employees in zombie firms/total employees) and sunk capital (capital of zombie firms/total capital) in zombie firms is significantly higher than their share in the total number of firms (Figure 4). Zombies are absorbing almost 15 % of total employment (Figure 7) and 22 % of capital in 2015 (Figure 7). Although still very high, especially in comparison with the sub-set of OECD countries, these figures are improvements vis-à-vis 2013 data, with reductions of more than 2 percentage points (p.p.) in terms of employment and of close to 7 p.p. for capital.
One considerable criticism that could be raised against the argumentation of this thesis is that we classify firms as zombies, but that their performance is indifferent to their non-zombie counterparts. Having characterized zombie firms, we now show that they are quite different from non-zombie ones in a number of important observables.
Table 1: Comparison of the Average Zombie and non-Zombie Firm, 2010 to 2015
Variable Unit Zombie Non-Zombie p-value*
Total Workers unit 23,36 15,19 0.000
Turnover 10# € 3183,45 1987,17 0.000
Operating Length years 23,93 21,86 0.000
Labor Productivity € 3,574 11,58 0.000
No of Obs unit 83.552 500.540
*p-value for the null hypothesis that each variable is statistically different when comparing zombie to non-zombie firms using the Mann-Whitney test.
Source: Authors own computations based on IES.
Notes: Non-financial and non-farming 2-digit business industry averages. Only firms older than 10 years have been considered. The dataset includes firms that do not report interest expenses. But it is not possible to differentiate whether the firm actually pays no interest and finances itself through eq-uity, or if it does not report those payments with our available data. To account for that, we conducted robustness checks using only observations with reported interest rates. Labor productivity is defined as GVA per hour worked. The considered years are 2010 to 2015.
Table 1 compares the characteristics of an average zombie firm with an average non-zombie firm, which is at least 10 years old to make the two groups comparable and confirms previous findings. Results of Table 1 are tested for statistical significance. The Shapiro-Wilk W test for normal distribution shows that the variables are not normally distributed. Thus a Mann-Whitney test, a generalized t-test, is being used to show that all five considered variables are statistically different when comparing zombie to non-zombie values. The evolution of zombie and non-zombie productivity over time is analyzed in the Appendix. It shows that zombie firms and non-zombies are displaying rather constant levels of productivity, where zombie firm
productivity is higher than non-zombie productivity. Since the share of zombie firms increases, we can derive a resulting decrease in aggregate productivity.
In Figures 8 and 9 analyze the different age and size categories. The percentage of zombies is higher in companies with more employees as indicated in Figure 8. The share of zombie firms in different age categories indicates that the chances of a firm being a zombie increase with firm age. Among others, this finding might also be caused by a reversed causality mechanism, in which firms that managed to operated as zombies for a long time, establish some kind of internal survival structure, that makes them more resilient (Figure 9).
Figure 8: Share of Zombie Firms in Dif-ferent Size Categories, 2008 to 2015
0 2 4 6 8 10 12 14 16 zombieshare in % 1−9 10−19 20−49 50−99 100−249 250+ sizecategory
Source: Authors own computations based on IES.
Notes: Non-financial and non-farming 2-digit business industry averages, zombie share de-fined as (zombie firms/total firms).
Figure 9: Share of Zombie Firms in Dif-ferent Age Categories, 2008 to 2015
0 2 4 6 8 10 12 14 16 18 20 zombieshare in % 10−12 13−17 18−29 30−59 60+ agecategory
Source: Authors own computations based on IES.
Notes: Non-financial and non-farming 2-digit business industry averages, zombie share de-fined as (zombie firms/total firms). A robustness test where the minimum age of the firm was low-ered to 3 years to avoid a start-up bias.
Overall results of the descriptive analysis are consistent with OECD findings and indicate that zombie firms are on average larger, incorporating more resources in the form of capital and labor and display significantly lower levels of labor productivity in comparison with non-zombie firms in Portugal. Furthermore, Portuguese firm-level data reveal considerable industry heterogeneity. Certain industries show over-proportionally high zombie share in terms of total firms which are zombies, capital that zombie firms hold and the number of employed people in zombies. This raises the question of the consequences of high level zombie congestion, which is addressed in the following section. The year 2013 indicates a turning point, at least a very
short-term one, after which zombie congestion decreased considerably. It raises the question if there are statistical differences in exit probabilities of zombie and non zombie firms, which will be investigated in sections 5.2 and 6.2.
5
Empirical Framework
Section four has laid the groundwork for understanding the characteristics and the prevalence of zombie firms in the Portuguese economy. The further consideration of this thesis explores the impact of this zombie congestion on the productivity of non-zombie companies. In a second step, zombie and non-zombie dynamics will be analyzed, focussing on the probability of exit of firms and the effectiveness of insolvency regimes.
5.1
Zombie Congestion and Firm Performance
Zombies firms are dragging productivity down because, as we have seen, they are less produc-tive and they have been increasing in numbers. To test whether they also they have negaproduc-tive spill over effects on all other firms we use the the following econometric specification on panel data from 2008 to 2015 to estimate the impacts of zombie congestion (resource misallocation) on different performance indicators of the average non-zombie firm, following Caballero et al. (2008) and Adalet McGowan et at. (2017a).
It can be assumed that the performance of a firm depends on previous year’s performance, as well as on general year-specific effects and on industry-specific effects. To account for that, a fixed effects regression specification is being used, controlling for cyclical industry and year-fixed effects, to analyze industry zombie congestion:
Yi,s,t = β0 + β1nonZi,s,t+ β2nonZi,s,t× RSs,t+ β3f controlsi,s,t−1+ F Es,t+ εi,s,t (1)
where Y denotes a performance measure, which, depending on the specifications, will be the investment rate, employment growth, or labor productivity of a firm i in a 2-digit industry s, in year t between 2008 and 2015. Real investment is created following Gal (2013), where the cur-rent book value of fixed tangibles is subtracted by the lagged book value of fixed tangibles plus
depreciation. By applying log differences, our dependent variable represents the relative growth in real capital stock. The log change puts more emphasize on smaller values, which needs to be kept in mind when interpreting the results. This partly accounts for outliers and misreporting that has not been captured in the data cleansing. Employment growth is calculated as the log change in total workers from one year to another, following Adalet McGowan et at. (2017a). Labor productivity is measured as GVA per worked hours on levels. The dummy nonZ takes the value 1, if it is a non-zombie firm and 0 otherwise. RS is a measure of industry resources sunk in zombie firms, which depending on the specification, will be measured either in KS or LS taking values between 0 and 1. The primary measure of interest KS1 represents the share
of tangible assets of zombie firms as a fraction of total tangible assets of all firms in each 2-digit sector. Since there could be validity concerns a second definition of capital including intangi-ble assets is employed for robustness purposes (KS2). The share of total workers employed in
zombie firms as a fraction of all workers employed is denoted by LS. Specification (1) includes firm controls, accounting for the age of a firm (young=1, if age < 6 years) and different firm sizes (1-2, 3-5, 6-10, 11-20, 21-100 and 101+ employees per firm). Robust standard errors are obtained and clustered by industry and by year (Adalet McGowan et al., 2017a).
We predict the β1 coefficient to be positive, as higher investment rates, more employment
growth and a higher level of labor productivity are expected from non-zombie firms. The second coefficient β2is expected to take a negative value according to our reasoning that more industry
resources sunk in zombie firms, representing higher misallocation of capital and labor, adversely affects the performance of non-zombie firms by crowding out investment and employment.
5.2
Exit Policies and Zombie Firms
Weak market competitiveness and severe resource misallocation could enable a prolonged sur-vival of unviable firms, resulting in an insignificant difference between zombie and non-zombie exit rates. Consequently, it is important to understand whether zombie firms die faster than non-zombie firms and if well designed insolvency regimes are fostering the exit of unprofitable firms, which has not yet been explored. To test whether or not zombie firms have a higher propensity of leaving the market and to what extent exit barriers might hinder or foster the exit of such firms, a linear probability fixed effects specification is employed:
Exiti,s,t= β0+ β1Zi,s,t−1+ β2exbs,t+ β3Zi,s,t−1× exbs,t+ F Es,t+ εi,s,t (2)
where Exit is a dummy variable, indicating whether a firm i exits (Exit = 1) or stays in the market (Exit = 0) in year t. The variable exb denotes a measure of the height of barriers to exit imposed by the insolvency regime in Portugal in year t in each 2-digit industry s. The indicator exb is calculated using the 2-digit industry natural firm turnover rate from the US and, for additional robustness, the UK multiplied by the annualized OECD insolvency indicator, with a higher value indicating higher barriers to insolvency. The dummy Z takes the value 1 for zombie firms and 0 for non-zombies. In addition to the baseline specification RS from equation (1) is included.
We employ fixed effects as unobserved heterogeneity is likely to be correlated with the outcome variable, due to the nature of our specification.4 Different regressions are run including
firm-fixed, industry-fixed and time-fixed effects.
We predict β1to be positive, since zombie firms are expected to have a higher probability of
exiting the market. To grasp the magnitude of the coefficients β2and β3an understanding of the
theory behind the insolvency indicator exb is key. The higher the number of the index, the higher the exit barriers, the less likely a zombie firm exits the market. Thus, we expect the coefficient β2 to be negative, since higher exit barriers should contribute to a firms prolonged survival.
Coefficient β3 is of special interest. If negative, good insolvency regimes foster especially the
exit of zombie firms and vice versa. We hypothesize that the coefficient is negative.
Additionally, we employ a logit model to check the robustness of our results. The right hand side (RHS) of specification (2) does not change and the dependent variable is the same binary response, predicting the probability of exit P r(Exiti,s,t) of a firm i in sector s and year
t. Population averages, year and industry fixed effects have been employed. We expect the coefficients to support our previous findings and predictions, i.e. β1 should be positive, as
the probability of exit should increase when being a zombie firm. Moreover, β2 and β3 are
expected to be negative for "bad" insolvency regimes, in form of higher barriers of exit, enable and incentives firms to stay in the market and decrease the probability of firm exit.
4A Hausman-Test confirms the assumption. Random effects are not consistent and thus a fixed effects
6
Empirical Results
6.1
Consequences of Zombie Congestion
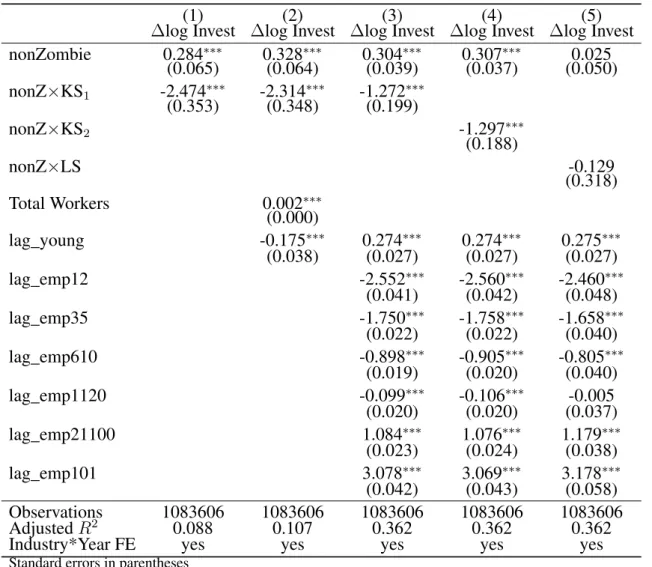
Tables 2 to 4 present the estimates of equation (1), where the effects of industry-level resources (captured) sunk in zombie firms on the average non-zombie firm in the respective time and industry are investigated.
Table 2 shows that the average non-zombie firm has a higher relative investment growth compared to the average zombie firms, ceteris paribus (c.p.). This is to be expected, when look-ing at the previous descriptive statistics (section 3) that display statistically different levels of labor productivity. The interaction term (nonZ×KS1) reveals new evidence that an increase in
the capital share that is being held by zombie firms is associated with lower non-zombie invest-ment growth, however labor sunk in zombie firms does not affect the relative investinvest-ment growth, which is shown in column 5. When introducing categorical firm size controls in columns 3 and 4 a difference between larger and smaller firms in terms of relative investment growth can be seen. Larger firms (more than 20 employees) tend to have higher relative investment rates than their smaller counterparts. Younger firms show larger investment growth than older ones. A robustness control for capital confirms previous findings.
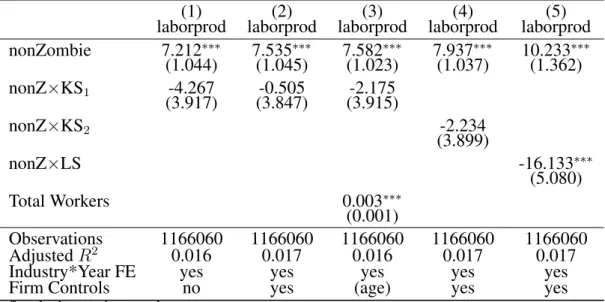
Table 3 presents the impact of zombie congestion on employment. The dummy coefficient shows that, on average, non-zombies have higher employment growth (around 7-9 %) for all 5 columns. This growth is hampered around -0.3 % if the overall industry share of resources captured in zombies in form of capital or labor increases by 10 %. This result is robust when controlling for firm age and size. The interaction term is even more significant when adding a continuous operating-length (firm age) variable. With increasing firm age (operating-length) the growth of employment decreases, but only in a small magnitude 0.1 % per year. Results are robust for the second definition of capital as well. These results suggest that a high number of zombie firms in a given industry make it more difficult for non-zombies to obtain the needed workers to expand and thus confirms our previous hypothesis. This is especially concerning, when considering widespread industry heterogeneity and a previously shown concentration of zombie firms, which puts even higher burdens on non-zombies in certain industries (section 4). Table 4 supports our previous assessment that non-zombie firms have a 7-10 e per hour
Table 2: Impact of Zombie Congestion on non-Zombie Investment
(1) (2) (3) (4) (5)
∆log Invest ∆log Invest ∆log Invest ∆log Invest ∆log Invest nonZombie 0.284∗∗∗ 0.328∗∗∗ 0.304∗∗∗ 0.307∗∗∗ 0.025 (0.065) (0.064) (0.039) (0.037) (0.050) nonZ×KS1 -2.474∗∗∗ -2.314∗∗∗ -1.272∗∗∗ (0.353) (0.348) (0.199) nonZ×KS2 -1.297∗∗∗ (0.188) nonZ×LS -0.129 (0.318) Total Workers 0.002∗∗∗ (0.000) lag_young -0.175∗∗∗ 0.274∗∗∗ 0.274∗∗∗ 0.275∗∗∗ (0.038) (0.027) (0.027) (0.027) lag_emp12 -2.552∗∗∗ -2.560∗∗∗ -2.460∗∗∗ (0.041) (0.042) (0.048) lag_emp35 -1.750∗∗∗ -1.758∗∗∗ -1.658∗∗∗ (0.022) (0.022) (0.040) lag_emp610 -0.898∗∗∗ -0.905∗∗∗ -0.805∗∗∗ (0.019) (0.020) (0.040) lag_emp1120 -0.099∗∗∗ -0.106∗∗∗ -0.005 (0.020) (0.020) (0.037) lag_emp21100 1.084∗∗∗ 1.076∗∗∗ 1.179∗∗∗ (0.023) (0.024) (0.038) lag_emp101 3.078∗∗∗ 3.069∗∗∗ 3.178∗∗∗ (0.042) (0.043) (0.058) Observations 1083606 1083606 1083606 1083606 1083606 Adjusted R2 0.088 0.107 0.362 0.362 0.362
Industry*Year FE yes yes yes yes yes
Standard errors in parentheses ∗p < .10,∗∗p < .05,∗∗∗p < .01
Note:∆log Invest refers to the relative growth of real capital stock in log differences, which has been calculated
following Gal (2013). NonZombie is a dummy (1=non-zombie firm) and 0 otherwise. KS represents the industry
capital sunk (from 0 to 1) in zombie firms, where KS1and KS2denote capital defined as (tangible assets) and
(tangible assets + intangible assets), respectively. LS represent the share of total workers employed (sunk) in zombie firms of all workers. Young is a dummy (young=1, if age < 6 years). Robust standard errors are obtained and clustered by industry and by year. The considered NACE Rev. 2 industry-level is 2-digit where possible.
higher labor productivity than their non-zombie counterparts. Moreover, the estimates support the hypothesis, that zombie congestion has negative effects on non-zombie productivity. In con-trast to the previous regressions, the only significant interaction term is labor sunk (nonZ×LS), which suggests that the amount of total workers employed in zombie firms creates barriers for non-zombie recruitment. This finding is backed by Caballero et al. (2008) that suggests salaries of zombie firms are exaggerated relative to their productivity.
Overall, our results for Portugal are in line with the previously drawn conclusions on zombie firms and the findings of the OECD (Adalet McGowan et al., 2017a). Higher zombie
conges-Table 3: Impact of Zombie Congestion on non-Zombie Employment
(1) (2) (3) (4) (5)
∆log Emp ∆log Emp ∆log Emp ∆log Emp ∆log Emp nonZombie 0.084∗∗∗ 0.065∗∗∗ 0.070∗∗∗ 0.065∗∗∗ 0.063∗∗∗ (0.007) (0.006) (0.006) (0.006) (0.005) nonZ×KS1 -0.024 -0.035∗ -0.043∗∗ (0.021) (0.020) (0.019) nonZ×KS2 -0.036∗ (0.020) nonZ×LS -0.038∗ (0.022) Operating-length -0.001∗∗∗ (0.000) Observations 1166060 1166060 1166060 1166060 1166060 Adjusted R2 0.023 0.039 0.037 0.039 0.039
Industry*Year FE yes yes yes yes yes
Firm Controls no yes (firmsize) yes yes
Standard errors in parentheses ∗p < .10,∗∗p < .05,∗∗∗p < .01
Note: ∆logEmp refers to the relative growth of employment in log differences. nonZombie (nonZ) is a dummy
variable taking the value 1 for a non-zombie firm and 0 otherwise and Operating-length represents the age of a firm. All other specifications are equal to Table 1.
Table 4: Impact of Zombie Congestion on non-Zombie Productivity
(1) (2) (3) (4) (5)
laborprod laborprod laborprod laborprod laborprod nonZombie 7.212∗∗∗ 7.535∗∗∗ 7.582∗∗∗ 7.937∗∗∗ 10.233∗∗∗ (1.044) (1.045) (1.023) (1.037) (1.362) nonZ×KS1 -4.267 -0.505 -2.175 (3.917) (3.847) (3.915) nonZ×KS2 -2.234 (3.899) nonZ×LS -16.133∗∗∗ (5.080) Total Workers 0.003∗∗∗ (0.001) Observations 1166060 1166060 1166060 1166060 1166060 Adjusted R2 0.016 0.017 0.016 0.017 0.017
Industry*Year FE yes yes yes yes yes
Firm Controls no yes (age) yes yes
Standard errors in parentheses ∗p < .10,∗∗p < .05,∗∗∗p < .01
Note: laborprod refers to the level of labor productivity defined as GVA per hour. nonZombie (nonZ) is a dummy variable taking the value 1 for a non-zombie firm and 0 otherwise and Total Workers depicts the number of workers. All other specifications are equal to Table 1.
tion, in form of capital and labor sunk, lead to lower investment rates, lower labor productivity and a decrease in employment growth of the average non-zombie firm. This subsection clearly shows the negative impacts of a higher zombie share on non-zombie performance, which can be seen as substantial threat towards a productivity growth recovery.
6.2
The Walking Dead? Exit Probabilities of Zombie Firms
Table 5 presents the estimates of equation (2) which analyzes the probability of firm exit. Columns 1 to 4 refer to the linear fixed effects specification, and columns 5 and 6 depict es-timates of the logit specification. Zombie firms are around 5 % more likely to exit the market in a given year, compared to their non-zombie counterparts, which suggests that the market selection mechanisms are still working and higher barriers to corporate restructuring lead to a lower exit probability of the average firm. The interaction term in columns 1 to 4 shows policy-relevant results. When increasing the weighted barrier to exit indicator by 1 point, zombie firms are 0.3 % less likely to exit the market in a given year and industry. This translates into an average impact of insolvency regime in a increasing probability of exit of an average zombie firm in 2012 of 1.1 %.5 Column 5 and 6 are not interpretable, due to the nature of the probit specification. Better insolvency regimes are contributing to the exit of zombie firms and thus decrease the capital misallocation, which has been discussed in the previous section. Results are robust when controlling for industry and year fixed effects and considering population averages.
Table 5: Propensity of Firm Exit
(1) (2) (3) (4) (5) (6)
Exit Exit Exit Exit Pr(Exit) Pr(Exit)
Lag Zombie (Lag Z) 0.057∗∗∗ 0.043∗∗∗ 0.045∗∗∗ 0.055∗∗∗ 0.358∗∗∗ 0.224∗∗∗ (0.004) (0.004) (0.004) (0.004) (0.034) (0.035) Barriers to Exit -0.023∗∗∗ -0.014∗∗∗ -0.014∗∗∗ -0.008∗∗∗ -0.052∗∗∗ -0.055∗∗∗
(0.000) (0.001) (0.001) (0.001) (0.006) (0.006) Lag Z X Exitbarriers -0.003∗∗∗ -0.003∗∗∗ -0.003∗∗∗ -0.002∗∗∗ -0.010∗∗∗ -0.007∗ (0.000) (0.000) (0.000) (0.000) (0.004) (0.004)
Industry Labor Sunk -0.036∗∗∗ -0.847∗∗∗
(0.007) (0.065)
Industry Capital Sunk 0.001
(0.004)
Observations 1018555 1018191 1018191 1018555 1018537 1018191
Fixed Effects yes yes yes no (pa) (pa)
Year FE no yes yes yes yes yes
Industry FE no no yes yes yes yes
R2 within 0.063 0.097 0.097 0.092
R2 overall 0.000 0.001 0.000 0.005
R2 between 0.157 0.331 0.331 0.075
Standard errors in parentheses ∗p < .10,∗∗p < .05,∗∗∗p < .01
Note: Columns 1-4 refer to the linear fixed effects specification for the exit of a firm. Columns 5-6 depict estimates of the logit model. The considered time period is 2008 to 2014. Exit barriers are defined as the OECD insolvency indicator weighted by the natural turnover rate of the US. Industry Labor and Capital sunk are defined as previous tables (1-4).
7
Conclusion
This thesis provides evidence that there is a high zombie prevalence in Portugal and that zom-bie firms are in fact a problem for the productivity development and firm performance in the Portuguese economy. Zombie firms are on average larger and less productive than non-zombie ones, incorporating almost 15 % of total employment and 22 % of total capital in 2015.
This is a precarious finding as the share of zombie firms as part of all firms has risen con-siderably from 6.5 % in 2008 to nearly 9 % in 2013, which represents an increase in totals of 35 %. Standalone, zombie firms are less productive, and they have been increasing in numbers dragging down aggregate productivity. In addition to being unproductive, they have negative spillover effects on the performance of non-zombie firms by misallocating resources. We find that a higher share of industry resources sunk in zombie firms leads to lower investment rates, lower labor productivity levels and a decrease in employment growth of other firms (i.e. a 10 % increase in zombie labor share, decreases employment growth of the average non-zombie firm by 0.3 % in the respective industry).
In a second string of analysis, we investigate the exit margin of zombie firms. Our results suggest that market mechanisms in Portugal are overall still functioning and that zombie firms are more likely to exit the market than other firms. Moreover, we show that recent structural reforms of insolvency regimes have potentiated the market exit of zombie firms in Portugal (i.e. approximately by 1.2 % between 2011 and 2012). The year 2013 appears to be a turning point after which the share of zombie firms decreases considerably. When assessing the contribution of insolvency regimes to that development, one has to account for policy complementaries as well. For instance Acemoglu et al., 2013 have shown, that tax subsidies for R&D are only fully effective when functioning exit policies are in place to enable the freeing of resources (Adalet McGowan et al., 2017b). Thus, the magnitude of recent insolvency reforms will be even more pronounced in the future.
Although the short-term outlook regarding zombie congestion for Portugal is positive, this thesis provides evidence that zombie firms stifle the overall firm performance and should, there-fore, be subject to further attention.
8
References
Acemoglu, Daron, Ufuk Akcigit, Harun Alp, Nicholas Bloom, and William R. Kerr 2013. "Innova-tion, reallocation and growth." NBER Working Paper, No. 18993.
Acharya, Viral V., Tim Eisert, Christian Eufinger, and Christian W. Hirsch. 2017. "Whatever it takes: The real effects of unconventional monetary policy." CEPR Discussion Paper, No. DP12005. Adalet McGowan, Müge, Dan Andrews, and Valentine Millot. 2017a. "The walking dead?: Zom-bie firms and productivity performance in OECD countries." OECD Economics Department Working Papers, No. 1372.
Adalet McGowan, Müge, Dan Andrews, and Valentine Millot. 2017b. "Insolvency Regimes, Zombie firms and capital reallocation." OECD Economics Department Working Papers, No. 1399.
Adalet McGowan, Müge, Dan Andrews, and Valentine Millot. 2017c. "Insolvency Regimes, Tech-nology Diffusion and Productivity Growth: Evidence from Firms in OECD Countries." OECD Eco-nomics Department Working Papers, No. 1425.
Adler, Gustavo, Romain Duval, Davide Furceri, Sinem Kiliç Çelik, Ksenia Koloskova, and Marcos Poplawski-Ribeiro. 2017. "Gone with the Headwinds: Global Productivity." IMF Staff Discussion Notes, 17/04.
Andrews, Dan, Chiara Criscuolo, and Peter N. Gal. 2016. "The Best versus the Rest: The Global Productivity Slowdown, Divergence across Firms and the Role of Public Policy." OECD Productivity Working Papers, No. 5.
Andrews, Dan, and Filippos Petroulakis. 2017. "Breaking the Shackles: Zombie Firms, Weak Banks and Depressed Restructuring in Europe." OECD Economics Department Working Papers, No. 1433. Bassanini, Andrea, and Romain Duval. 2006. "Employment patterns in OECD countries." OECD Social, Employment and Migration Working Papers, No. 35.
Banco de Portugal. 2011. "Statistical Press Release." Accessed October 20. http://bportugal.pt/sites/default/files/anex os/documentos-relacionados/nota%20de%20informacao%20estatistica%20cb%2022-12-2011_en.pdf.
Banco do Portugal. 2014. "Sector Table and Enterprise and Sector Tables Methodological Notes, Long Time Series 1995-2013." Central Balance-Sheet Studies, No 19.
Bottasso, Anna, Maurizio Conti, and Giovanni Sulis. 2017. "Firm Dynamics and Employment Pro-tection: Evidence from Sectoral Data." Labour Economics, Vol. 48.
Brynjolfsson, Erik, and Andrew McAfee. 2014. The second machine age: Work, progress, and prosperity in a time of brilliant technologies. WW Norton and Company.
Caballero, Ricardo J., Takeo Hoshi, and Anil K. Kashyap. 2008. "Zombie lending and depressed restructuring in Japan." The American Economic Review 98(5): 1943-1977.
Cooper, Russell, John Haltiwanger, and Laura Power. 1999. "Machine Replacement and the Busi-ness Cycle: Lumps and Bumps." The American Economic Review, 89(4): 921-946.
promoting employment and productivity? A difference-in-differences approach." GEE Papers, No. 84. Decker, Ryan A., John Haltiwanger, Ron S. Jarmin, and Javier Miranda. 2016. "Changing Business Dynamism: Volatility of Shocks vs. Responsiveness to Shocks?" Mimeo.
Dinis, David S., Nair M. Cordas. 2017. "The Restructuring Review - Edition 10, Portugal". Accessed
December 31 The Law Review. http://thelawreviews.co.uk/edition/the-restructuring-review-edition-10/1147156/portugal. ECB. 2017. "Firm heterogeneity and competitiveness in the European Union." ECB Economic Bulletin,
Issue 2 / 2017.
Euopean Comission. 2016. "Ex Post Evaluation of the Economic Adjustment Programme, Portugal, 2011-2014." European Economy Institutional Paper, No 040.
Farinha, Luisa, Pedro Prego. 2013. "Investment Decisions and Financial Standing of Portuguese Firms? Recent Evidence." Economic Bulletin and Financial Stability Report Articles, Banco de Portu-gal.
Gal, Peter N. 2013. "Measuring total factor productivity at the firm level using OECD-ORBIS." OECD Economics Department Working Papers, No. 1049.
Gonçalves, Daniel, and Ana Martins. 2016. "The Determinants of TFP Growth in the Portuguese Manufacturing Sector." GEE Papers, No. 62.
Gopinath, Gita, Sebnem Kalemli-Özcan, Loukas Karabarbounis, and Carolina Villegas-Sanchez. 2017. "Capital allocation and productivity in South Europe." The Quarterly Journal of Economics, Vol. 132 (4).
Gordon, Robert J. 2017. The rise and fall of American growth: The US standard of living since the civil war. Princeton University Press.
Jack, William, and Maureen Lewis. 2009. "Health investments and economic growth: Macroeco-nomic evidence and microecoMacroeco-nomic foundations." Policy Research Working Paper, Vol. 4877.
Lam, W. Raphael, Alfred Schipke, Yuyan Tan, and Zhibo Tan. 2017. "Resolving China’s Zombies: Tackling Debt and Raising Productivity." IMF Working Paper, No. 17/266.
OECD. 2003. "The Sources of Economic Growth in OECD Countries". OECD Publishing. OECD. 2016. "OECD Economic Outlook." OECD Publishing. Vol. 2016 (1).
Peña-López, Ismael. 2017. "World development report 2016: Digital dividends." World Bank.
Schivardi, Fabiano, Enrico Sette, and Guido Tabellini. 2017. "Credit Misallocation During the European Financial Crisis." CEPR Discussion Paper, No. DP11901.
World Bank. 2017. "Doing Business Reforms." Accessed December 31. http://www.doingbusiness.org /data/exploretopics/resolving-insolvency/reforms.
9
Appendix
Figure A1: OECD Insolvency Indicator for Portugal
Year OECD Composite Indicator (yearly average) US Weighted Indicator Weighted Indicator (yearly average) UK
2006 0,55 9,11 12,16 2007 0,55 9,13 12,20 2008 0,55 9,13 12,24 2009 0,55 9,14 12,27 2010 0,52 8,65 11,62 2011 0,52 8,65 11,63 2012 0,29 4,83 6,49 2013 0,29 4,83 6,49 2014 0,29 4,82 6,49 2015 0,29 4,81 6,47
Source: Authors own computations based on OECD and SDBS Business Demography Indicators database.
Notes: OECD Composite Indicator has been weighted by 2-digit NACE Rev. 2 turnover rates.
Figure A2: Labor Sunk in Zombies, by Industry
0 50 0 50 0 50 2008 2010 2012 2014 2016 2008 2010 2012 2014 2016 2008 2010 2012 2014 2016 2008 2010 2012 2014 2016
C− manufacturing D− electricity E− water supply F− construction
G− wholesale trade H− transp. & storage I− accomodat. & food J− ICT
L− real estate M− profes. activi. N− administ. service
capital sunk in %
year Graphs by NACE_Rev2
Source: Authors own computations based on IES.
Notes: Non-financial and non-farming 2-digit business industry averages. The red line is the average of labor sunk in zombie firms over all industries and years and acts as a benchmark.
Figure A3: Capital Sunk in Zombies, by Industry 0 50 0 50 0 50 2008 2010 2012 2014 2016 2008 2010 2012 2014 2016 2008 2010 2012 2014 2016 2008 2010 2012 2014 2016
C− manufacturing D− electricity E− water supply F− construction
G− wholesale trade H− transp. & storage I− accomodat. & food J− ICT
L− real estate M− profes. activi. N− administ. service
labor sunk in %
year Graphs by NACE_Rev2
Source: Authors own computations based on IES.
Notes: Non-financial and non-farming 2-digit business industry averages. The red line is the average of capital sunk in zombie firms over all industries and years and acts as a benchmark.
Figure A4: Productivity Evolution Zombies vs. non-Zombies in Portugal
0 5 10 15 20 25
Mean Labor Productivity
2008 2009 2010 2011 2012 2013 2014 2015
Year
Zombies non Zombies
Source: Authors own computations based on IES.
Notes: levels. Non-financial and non-farming 2-digit business industry averages, Labor productivity defined as GVA per worked hour, levels. Only firms age ≥ 10 years considered to make groups comparable.
Figure A5: Zombie Firms Share of all Firms that Exit the Market 0 2 4 6 8 10 12 14 16 % 2009 2009.5 2010 2010.5 2011 2011.5 2012 2012.5 2013 2013.5 2014 Year
Source: Authors own computations based on IES.
Notes: The results provide insights into the effectiveness of past structural reforms in enabling zom-bie firms to exit and might provide scope for future policies. Interesting would be to see the overall development of zombie firms, how many new or how many existing in the same chart. It indicates that the percentage of zombie firms that leave the market in comparison to non-zombie firms that leave the market increases, which supports findings of our Exit analysis.
Table A5: Impact of Zombie Congestion on non-Zombie Employment, Complete Table
(1) (2) (3) (4) (5)
∆log Emp ∆log Emp ∆log Emp ∆log Emp ∆log Emp nonZombie 0.084∗∗∗ 0.065∗∗∗ 0.070∗∗∗ 0.065∗∗∗ 0.063∗∗∗ (0.007) (0.006) (0.006) (0.006) (0.005) nonZ×KS1 -0.024 -0.035∗ -0.043∗∗ (0.021) (0.020) (0.019) nonZ×KS2 -0.036∗ (0.020) nonZ×LS -0.038∗ (0.022) Operatinglength -0.001∗∗∗ (0.000) lag_young6 0.045∗∗∗ 0.045∗∗∗ 0.045∗∗∗ (0.002) (0.002) (0.002) lag_emp12 -0.604∗∗∗ -0.586∗∗∗ -0.604∗∗∗ -0.606∗∗∗ (0.005) (0.004) (0.005) (0.005) lag_emp35 -0.690∗∗∗ -0.675∗∗∗ -0.690∗∗∗ -0.692∗∗∗ (0.004) (0.003) (0.004) (0.005) lag_emp610 -0.695∗∗∗ -0.681∗∗∗ -0.695∗∗∗ -0.697∗∗∗ (0.004) (0.003) (0.004) (0.005) lag_emp1120 -0.695∗∗∗ -0.681∗∗∗ -0.695∗∗∗ -0.697∗∗∗ (0.004) (0.003) (0.004) (0.005) lag_emp21100 -0.689∗∗∗ -0.673∗∗∗ -0.689∗∗∗ -0.690∗∗∗ (0.004) (0.004) (0.004) (0.005) lag_emp101 -0.683∗∗∗ -0.663∗∗∗ -0.683∗∗∗ -0.685∗∗∗ (0.005) (0.004) (0.005) (0.006) Observations 1166060 1166060 1166060 1166060 1166060 Adjusted R2 0.023 0.039 0.037 0.039 0.039
Industry*Year FE yes yes yes yes yes
Standard errors in parentheses ∗p < .10,∗∗p < .05,∗∗∗p < .01
Note: ∆logEmp refers to the relative growth of employment in log differences. nonZombie (nonZ) is a dummy
variable taking the value 1 for a non-zombie firm and 0 otherwise. KS represents the industry capital sunk in
zombie firms, where KS1and KS2denote capital defined as (tangible assets) and (tangible assets + intangible
assets) respectively. LS represent the number of total workers employed (sunk) in zombie firms divided by all workers employed. Robust standard errors are obtained and clustered by industry and by year. The considered NACE Rev. 2 industry-level is 2-digit where possible.
Table A5: Impact of Zombie Congestion on non-Zombie Productivity, Complete Table
(1) (2) (3) (4) (5)
laborprod laborprod laborprod laborprod laborprod nonZombie 7.212∗∗∗ 7.535∗∗∗ 7.582∗∗∗ 7.937∗∗∗ 10.233∗∗∗ (1.044) (1.045) (1.023) (1.037) (1.362) nonZ×KS1 -4.267 -0.505 -2.175 (3.917) (3.847) (3.915) nonZ×KS2 -2.234 (3.899) nonZ×LS -16.133∗∗∗ (5.080) Total Workers 0.003∗∗∗ (0.001) lag_young6 -2.125∗∗∗ -2.784∗∗∗ -2.127∗∗∗ -2.136∗∗∗ (0.376) (0.321) (0.376) (0.381) lag_emp12 3.456∗∗∗ 3.302∗∗∗ 1.558∗ (0.579) (0.602) (0.874) lag_emp35 4.723∗∗∗ 4.569∗∗∗ 2.821∗∗∗ (0.553) (0.560) (0.945) lag_emp610 6.033∗∗∗ 5.878∗∗∗ 4.129∗∗∗ (0.575) (0.577) (1.052) lag_emp1120 7.245∗∗∗ 7.088∗∗∗ 5.337∗∗∗ (0.655) (0.641) (1.170) lag_emp21100 8.976∗∗∗ 8.817∗∗∗ 7.051∗∗∗ (0.630) (0.620) (1.172) lag_emp101 12.115∗∗∗ 11.948∗∗∗ 10.146∗∗∗ (0.636) (0.638) (1.119) Observations 1166060 1166060 1166060 1166060 1166060 Adjusted R2 0.016 0.017 0.016 0.017 0.017
Industry*Year FE yes yes yes yes yes
Standard errors in parentheses ∗p < .10,∗∗p < .05,∗∗∗p < .01
Note: laborprod refers to the level of labor productivity defined as GVA per hour. nonZombie (nonZ) is a dummy variable taking the value 1 for a non-zombie firm and 0 otherwise. KS represents the industry capital sunk in
zombie firms, where KS1and KS2denote capital defined as (tangible assets) and (tangible assets + intangible
assets) respectively. LS represent the number of total workers employed (sunk) in zombie firms divided by all workers employed. Robust standard errors are obtained and clustered by industry and by year. The considered NACE Rev. 2 industry-level is 2-digit where possible.