A Work Project, presented as part of the requirements for the Award of a Master Degree in Finance from the
NOVA – School of Business and Economics.
THE EXPANSION OF ROYAL CARIBBEAN CRUISES
CARLOTA BOTELHO DA COSTA REIS & 33823
MAFALDA ERBERT SILVA MANGO FERNANDES &
34055
A Project carried out on the Master in Finance Program, under the supervision of:
Francisco Antunes da Cunha Martins
Abstract
The present master thesis “The Expansion of Royal Cruises” was developed in order to
give investors’ a recommendation about Royal Caribbean Cruises, Ltd.
Royal Caribbean Ltd. is the second largest cruise line, behind Carnival Corp. Although the
company was settled since 1968, it continues to innovate and keep up with new trends.
RCL will expand substantially its fleet, following the prospects of future growth in the
global ocean passengers carried, worldwide.
A deep analysis was performed regarding RCL’s industry, competitors, business model,
trends, financial situation, etc. which was reflected in our valuation through the Discounted
Cash Flow model.
Keywords
Cruise, ships, tourism, expansion
This work used infrastructure and resources funded by Fundação para a Ciência
e a Tecnologia (UID/ECO/00124/2013, UID/ECO/00124/2019 and Social
Sciences DataLab, Project 22209), POR Lisboa
(LISBOA-01-0145-FEDER-007722 and Social Sciences DataLab, Project 22209) and POR Norte (Social
Sciences DataLab, Project 22209).
MASTER IN FINANCE
THIS REPORT WAS PREPARED EXCLUSIVELY FOR ACADEMIC PURPOSES BY [INSER STUDENT S NAME], A MASTER IN FINANCE STUDENT
OF THE NOVA SCHOOL OF BUSINESS AND ECONOMICS.THE REPORT WAS SUPERVISED BY A NOVA SBE FACULTY MEMBER, ACTING IN
A MERE ACADEMIC CAPACITY, WHO REVIEWED THE VALUATION METHODOLOGY AND THE FINANCIAL MODEL.
(PLEASE REFER TO THE DISCLOSURES AND DISCLAIMERS AT END OF THE DOCUMENT)
The tourism sector has been growing at a substantial pace. In the first two quarters of 2019, the international number of new arrivals grew 4% worldwide, in comparison to the same period in the previous year.
The number of Global Ocean Cruise Passengers has been increasing every year, reaching the 30 million mark of passengers carried in 2019, translating into a 6.38% growth.
To meet the expected increase in the number of passengers carried, RCL will increase its fleet by at least 19.23%, representing 31,550 additional berths.
As a consequence, RCL will continue to present high investments levels superior a 1 billion dollars, until 2021.
According to the valuation estimated by the DCF model, it was obtained a target price of $139.60 for RCL, which translates a positive return of 5.51% compared to the actual price. Considering the expected Shareholders Gains of $2.53 it is obtained a total return of 7.42%.
Hence, the valuation model reflects the analysts assessments which translates into a BUY recommendation. Company description
Royal Caribbean Cruises Ltd (RCL). Is a cruise company that operates 4 global cruise lines, being the second largest in terms of revenues. It offers more than 1,000 itineraries on all continents through their 60 ships. RCL is incorporated in Liberia with headquarters in Miami, Florida.
R
OYAL
C
ARIBBEAN
C
RUISES
C
OMPANY
R
EPORT
H
OTELS
,
R
ESORTS
&
C
RUISE
L
INES
3
JANUARY2020
C
ARLOTA
R
EIS
&
M
AFALDA
F
ERNANDES
33823@novasbe.pt & 34055@novasbe.pt
The expansion of Royal Caribbean
Cruises
Cruising through the end of a decade
Recommendation: BUY
Price Target FY20: 139.60 $
Price (as of 3-Jan-20) 132.31 $
Reuters: RCL.N, Bloomberg: RCL US Equity
52-week range ($) 94.50-134.80
Market Cap ($m) 28 227
Outstanding Shares (m) 209.631
Source: Bloomberg
Source: Bloomberg and Analyst Estimates
(Values in $ millions) 2019 2020F 2021F Revenues 10 640 11 414 12 057 EBITDA 2 899 3 205 3 452 Net Profit 1 557 1 763 1 942 NOPLAT 677 402 451 CAPEX 2 234 1 175 1 301
“ROYAL CARIBBEAN CRUISES” COMPANY REPORT
Page 1/31
Table of Contents
EXECUTIVE SUMMARY ... 2
COMPANY OVERVIEW... 2 COMPANY DESCRIPTION ... 3THE SECTOR ... 5
GLOBAL TRAVEL &TOURISM AND THE CRUISE INDUSTRY ... 5
CRUISE INDUSTRY:PARTICIPANTS ... 8
CRUISE INDUSTRY:ECONOMIC IMPACT ... 12
CRUISE INDUSTRY:KEY FACTORS &CHALLENGES ... 12
MACROECONOMICS ANALYSIS ...14
NORTH AMERICA ... 14 EUROPE ... 14 ASIA/PACIFIC... 15 OTHER REGIONS ... 15VALUATION ...16
VALUE DRIVERS –REVENUES ... 16
OPERATING MARGIN ... 18 INVESTMENT STRATEGY ... 20
WACC ...21
ASSUMPTIONS ... 21 COST OF DEBT ... 22 COST OF EQUITY ... 22DEBT-TO-EQUITY RATIO ... 23
DISCOUNTED CASH FLOWS MODEL ... 23
PERPETUITY GROWTH ... 23
SCENARIO ANALYSIS ... 24
APPENDIX ...26
FINANCIAL STATEMENT –BALANCE SHEET ... 26
FINANCIAL STATEMENT –INCOME STATEMENT ... 27
“ROYAL CARIBBEAN CRUISES” COMPANY REPORT
PAGE 2/31
Executive summary
Company Overview
Royal Caribbean Cruises, Ltd. (RCL) is a cruise company that offers more than
1,000 destinations on all continents1. It was founded in 1968 as a partnership in
Norway and nowadays is the second-largest cruise line in revenues. It is incorporated in Liberia although the headquarters of the group is located in Miami, Florida with offices and networks around the world.
Royal Caribbean provides cruise vacations through their numerous vessels all over the globe. It sells passenger tickets through their primary source of sales, the travel agencies partners or whether directly to the customers online. Moreover, it also offers online assistance regarding the customers’ reservations, transportations, hotel booking, if necessary, and air transportation before and after the cruise, through their Air Transportation Program which provides plane tickets with prices close to the cost.
The company’s revenue streams are mostly delivered through the sale of passenger tickets and the proceeds derived from the onboard activities available and the services provided, Chart 1. In 2019, RCL’s revenues grew 12.07% mainly due to the increase in the sale of passengers’ tickets as well as onboard revenues, which is mostly explained with the introduction of 2 new ships. Hence, the revenues’ behaviour is positively impacted by the addition of new ships on the company’s fleet since it grants the possibility to carry more passengers and to obtain more proceeds from the cruise services, Chart 2.
In order to maintain its operations running, RCL, historically, on average, spent 61% of its total revenues with operating expenses. Being commissions, transportation and others, other operating expenses (related to the ship's usage), payroll and related expenses and fuel consumption, the main operating expenses. As for the firm’s fiscal policy, RCL taxes expenses are marginal. Alongside the other industry competitors, most of the firm’s income is exempt from taxation.
Something mainly due to regimes and codes that the company’s earnings are
under as is the case of Section 883 of the U.S. Internal Revenue Code (IRC) and the U.K. Tonnage Act.
1 2018 Company Report
Source: Company Annual Reports; Analysts estimates
Chart 1 - RCL revenues by source
0 2,000,000 4,000,000 6,000,000 8,000,000 10,000,000 12,000,000
Chart 2 - RCL total revenue and nº of ships
Source: Company Annual Reports; Analysts estimates 0 10 20 30 40 50 60 70 $2,000,000 $4,000,000 $6,000,000 $8,000,000 $10,000,000 $12,000,000 $14,000,000 $16,000,000 2 0 1 4 2 0 1 5 2 0 1 6 2 0 1 7 2 0 1 8 2 0 1 9 E 2 0 2 0 E 2 0 2 1 E 2 0 2 2 E 2 0 2 3 E 2 0 2 4 E 2 0 2 5 E 2 0 2 6 E
“ROYAL CARIBBEAN CRUISES” COMPANY REPORT
PAGE 3/31
Company Description
Royal Caribbean Cruises Ltd (RCL), refers to the company’s subsidiaries and/or affiliates, namely: “Royal Caribbean International” (RCI), “Celebrity Cruises” (CC),
“Azamara Club Cruises” (ACC) and “Silversea Cruises” (SC),which constitutes the
company’s Global Brands. The company also owns interests in “TUI Cruises” (50%
joint venture interest) and “Pullmantur” (49%), making them as Partner Brands.
Collectively, they operate a total of 60 ships in the cruise vacation industry with an
aggregate capacity of 135,520 berths, as of 31st December 2018.
The company’s goal is to attract new customers while focusing on maintaining loyal guests through differentiated services, alongside an updated fleet that covers a variety of itineraries. RCL has the flexibility to capture different cruise market segments through its portfolio of brands, each with their marketing strategy and ship and crew composition.
▪ Global Brands
As of December 2018, RCL’s Global Brands operate 50 ships, Table 1, in the
industry with an aggregate capacity of approximately 113,320 berths. It currently has 9 ships on order until 2024, with 4 of them already available this year. Relatively to the Global Brands, RCI is the cruise line with the higher number of ships (50%), followed by CC, SC and ACC, in the same order for the percentage of passengers carried, Chart 3. Although the differences in marketing, target customers and capacity, Global Brands are treated as a single business given the similarities in the costs and revenue elements.
RCI is positioned to cover the broadest market segments within the industry. It has differentiated onboard activities such as modern waterslides, surf pools, escape rooms, skydiving simulators, bumper cars and a wide array of itineraries, which accomplished to appeal both contemporary and premium customers including families with children, younger couples and older ones. The brand operates 25 ships with an aggregate capacity of 82,500 berths and has 5 ships on order with an aggregate capacity of 25,300 berths, Chart 4, increasing its share within Global Brands. The cruise lengths within this brand vary between 2 and 23 nights. CC, however, is dedicated to the premium segment in the industry through modern and more luxurious experiences. For instance, it provides a Michelin star chef onboard, ballet theatres, luxurious spas, contemporary art exhibitions and ships conceived by engineers and designers with modern concepts. It also offers a wide Chart 3 - Passengers carried in 2018
per brand
Source: Company 2018 Report
74.1% 1.8%
1.8% 22.3%
RCI SC ACC CC
Source: Company Annual Report; Analysts estimates
Table 1 - RCL Global Brands, relevant numbers
R C I C C A C C SC N º o f shi p s 25 13 3 9 A g g r eg at e C ap aci t y 82,500 26,070 21,000 2,650 A ver ag e C r ui se Leng t h 2-23 2-19 4-21 6-25 Shi p s o n o r d er 5 4 - 3
Source: Company Annual Reports; Analysts estimates
Chart 4 - RCI Capacity
0 20000 40000 60000 80000 100000 120000
Source: Company Annual Reports; Analyst estimates
Chart 5 - CC Capacity 0 5000 10000 15000 20000 25000 30000 35000 40000
“ROYAL CARIBBEAN CRUISES” COMPANY REPORT
PAGE 4/31 range of routes through their 13 ships with an aggregate capacity of 26,070, Chart
5. It currently has 4 ships on order that will result in additional 9,400 berths.
ACC was intended to target a premium market though in specific geographical areas such as North America, United Kingdom and Australia. This luxurious market features small ships with higher standards of services and accommodation, as well as exotic destinations. The brands’ program consists of delivering exclusive experiences through their distinctive itineraries, hence having longer cruise lengths ranging from four to 21 nights. Currently, it only operates 3 ships with an aggregate capacity of 2,100 berths, Chart 6.
SC is also an ultra-luxury and expedition cruise line with similar characteristics as Azamara Club Cruises (smaller ships, high standards and personalized and exotic itineraries). Nonetheless, it comprises different remote destinations including the Galapagos Islands, Antarctica and the Arctic. Silversea has 3 vessels on order and operates 9 ships with an aggregate capacity of 2,650 berths, Chart 7, with cruise
lengths ranging from 6 to 25 nights. This cruise line was only acquired in the 31st
of July 2018 and it was a crucial procurement since it added more than 500 new destinations, allowing more exotic routes.
▪ RCL Operations – Value Drivers
As previously mentioned, RCL main source of income is a result of passenger’s
ticket sales and onboard revenues2. The average ticket price by RCL in the future
must have into account the past practised prices, an adjustment to changes in inflation and likely changes resultant from the acquisition of new ships, in each respective region. The number of passengers carried is a result of the predicted
occupancy rates3 under the annual predicted capacity4. As for the revenues’
resultant of onboard services and activities of RCL’s ships, it is generated having as basis the number of cruisers carried and the individual revenues generated during a day by each one of them, having as basis historical revenues and adjustments to changes in the regional number of arrivals and inflation.
For RCL run its operations, the firm has several crucial operating expenses. Approximately 37%, Chart 8, of these expenses vary with the firms’ revenues (commissions, transportations and others with ticket sales and onboard and other expenses with onboard revenues). Payroll and related expenses, food and other operating expenses, (representing approximately 48% of the firm’s operating expenses) are highly dependent on the company’s number of ships. Relatively to
2 Also, through other revenues representing, on average, 3.6% of total revenues. Therefore, not considered as one of the main sources.
3Occupancy rate had in consideration the regional number of arrivals as well as the growth of the tourism sector.
4 The predicted capacity is a consists on the Available Passengers Cruise Days (APCD) / Average cruise days.
27% 10% 17% 10% 15% 21%
Commissions, transportation and others Onboard and other
Payroll and related Food
Fuel Other operating
Source: Company Report;
Chart 8 - RCL's historical operating expenses
Source: Company Annual Reports; Analyst estimates
Chart 7 - SC Capacity 0 500 1000 1500 2000 2500 3000 3500 4000 4500
Source: Company Annual Reports; Analyst estimates
Chart 6 - ACC Capacity
0 500 1000 1500 2000 2500
“ROYAL CARIBBEAN CRUISES” COMPANY REPORT
PAGE 5/31 the payroll, it relies on the cost per employee adjusted to the inflation and the number of employees per ship. Concerning food and other expenses, both depend on the cost associated for each individual ship. As for fuel expenses, represent 15 % of overall operating expenses not only depending on future changes in the oil prices but also on the firms’ annual consumption.
▪ Shareholder Structure
As of 14th February of 2019, Royal Caribbean’s common stockholders were about
1,3985, including institutional shareholders, with approximately 210 million shares
outstanding. RCL shareholder’s structure is comprised of 43.17% mutual fund
holders, 32.60% other institutional holders and the remaining representing individual stakeholders, Chart 9. The most significant RCL’s shareholders include
Arne Alexander Wilhelmsen, which is the company co-founder and has a 12%
stake. Right after there’s The Vanguard Group with 8.55% share and Capital
Research & Management Co. with 5.51%6.
RCL’s shareholders are mainly institutional holders, which act on behalf of their clients. This can have a negative impact on the company since this type of holders
usually is more distant from the company and from their long-term objectives,
which might result in a lower involvement compared to the individual shareholders. Regarding the mutual funds’ investors, they can choose to disinvest, hence, the investment manager has no control and may be forced to liquidate the holding. As a result, this relationship doesn’t encourage long-term commitment.
The Sector
Global Travel & Tourism and the Cruise Industry
Over the decades the tourism sector has been proving to be one of the fastest growing economic sectors in the world, not only a result of persistent growth, Chart10, but also a result of the diversity of the travel and entertainment options
developed and the competition among the many available destinations. According to the World Tourism Organization (UNWTO), international arrivals grew 4% in the first two quarters of 2019 in comparison to the same period in the previous year.
5 2018 Company Report
6
MarketScreener. 2019. Royal Caribbean Cruises Ltd. Accessed 23rd
October. https://www.marketscreener.com/ROYAL-CARIBBEAN-CRUISES-14206/company/
Chart 10 - International Tourism, growth in the number of arrivals -15.0% -10.0% -5.0% 0.0% 5.0% 10.0% 15.0% 20.0% Arrivals Receipits
Source: World Tourism Organization (UNWTO), July 2019. Source: CNN Business. 2019. Royal Caribbean Cruises Ltd
Chart 9 - RCL Shareholder Structure
43.17%
32.60% 24.23%
Mutual Funds Other Institutional Holders Individual stakeholders
“ROYAL CARIBBEAN CRUISES” COMPANY REPORT
PAGE 6/31 As for the cruise industry it has been reinventing itself year after year. Nowadays, the focus is to transform the customer experience. Since the late 1960s, this industry has grown and continues to grow substantially in scale.
Since the word of mouth between passengers has an important impact on the decision of cruising, regardless of the company, an increase in the global cruise passengers (GCP) will affect every company. As it is possible to verify in Chart 11, the number of GPC has been increasing every year since 2010, having in 2018 a growth of 6.7% in relation to 2017. According to The Cruise Lines International Association (CLIA), it is expected an increase in this number, reaching the 30 million mark of passengers carried in 2019.
According to UNWTO, in 2018, Asia/Pacific has been the region with the highest growth rate, 7%, Chart 12, when it comes to the number of new arrivals, mainly a
result by the Chinese outbound tourism7. The European region recorded a growth
of 5%, continuing to be the world’s most visited area. As for the Americas, the region presented the lowest growth of 2%, showing divergent results. In one hand the Caribbean region increased its number of arrivals by 11% mainly due to the US demand. But on the other hand, North America recorded 2% growth, while Central America (+1%).
Through the years, the tourism and cruise industry have been growing at a similar pace. From 2009 until 2017, the number of new arrivals grew on average 5.2% as for the same period, the number of global passengers carried grew at 5.23 %,
Chart 13. When looking to the growth of the number of new arrivals as an indicator
of the willingness to travel and to the tourism direct contribution to GDP growth forecast, Chart 14, it is expected an increase on demand. Adding this relation, the
fact that in 20188, 56% of the travellers travelled with the purpose of leisure,
recreation or holidays, Chart 15, consolidating the positive outlook for the cruise industry. When analysing the historical behaviour of the tourism sector, Chart 13,
and the outlook for the future, according to UNTWO (1.6 Bn of new arrivals in
20209), it is expected an increase in the number of travellers in general, something
that will impact the number of passengers carried. Consequently, it will also have a favourable impact on the revenues resultant from passengers tickets sales and onboard revenues, Chart 16. Resulting also in the increase of operational costs such as the commissions, transportation and onboard and other operational costs,
Chart 17.
7 UNWTO. 2019. "Chinese Outbound Tourism". Accessed 23rd October. https://www.e-unwto.org/doi/pdf/10.18111/9789284406159
8 According to a Survey conducted by the World Tourism Organization, 2018
9 CWW Travel. 2019. "Tourism Continues to Grow". Accessed 2 October.
https://money.cnn.com/quote/shareholders/shareholders.html?symb=RCL&subView=institutional Chart 11 - Global cruise passengers
carried (millions) 0 5 10 15 20 25 30 35
Source: CLIA,Cruise Lines International Association,2018
0.0% 1.0% 2.0% 3.0% 4.0% 5.0% 6.0% 7.0%
Tourism Direct Contribution to GDP growth Real GDP Growth
Source: IMF. 2019. U.S. Real GDP growth; WTTC. 2019. Tourism Direct Contribution to GDP
Chart 14 - Tourism direct contribution to GDP and Real GDP growth forecast
13% 27% 56% 4% Business & Professional VFR, health, religion, other Leisure, recreation, holidays Source: WTTC, 2018
Chart 15 - Global travelers’ main purpose for destinations visits 0 0.02 0.04 0.06 0.08 0.0 500.0 1000.0 1500.0
New Arrivals Growth Source: UNWTO, 2018
Chart 13 - International historical new arrivals 7% 5% 2% 0% 2% 4% 6% 8%
Asia/Pacific Europe Americas Source: UNWTO, 2018
Chart 12 - 2018 Number of arrivals growth rate by region
“ROYAL CARIBBEAN CRUISES” COMPANY REPORT
PAGE 7/31 In 2018, the tourism direct contribution to the global GDP increased 3.9%, Chart
14, and it is expected according to the World Travel & Tourism Council (WTTC) to
keep growing in 2019 and 2020. Even with occasional shocks, the receipts resultant from visitors’ expenditures have been growing faster than the world
economy. In 2018 the receipts grew 4.4% in comparison to the world’s GDP of
3.6%. The main factors that have been leading to this positive growth have been the favourable economic environment, increase in the consumer purchasing
power, the increase on the demand for air travels10, the quick development of new
technologies that have been reshaping customers travelling experience and also the new and innovative ways of payments that have been attracting younger generations.
The systematic expansion in the cruise industry went along it the main factors that have been boosting the tourism sector. The increase in income of the customer base and the rise in the income level in many countries, along the years, including economies in development contributed also to this expansion. Additionally, the majority of guests are first time cruisers, and according to Chart 18, in North America from 2012 to 2017, 56% of the inquired have never been on a cruise. This data shows the percentage of people that can be converted to “first-time cruisers”, something that represents the potential an increase in demand, namely on the number of passengers carried for RCL. As mentioned before, this will affect the revenues resultant of cruise tickets sales and revenues on board, Chart 16, and the operating costs related to them, Chart 17. Even though the majority of the companies are focusing on attracting younger cruisers, the term “first-time cruisers” does not mean necessarily younger people. With the ageing of the world population, retired people can have the right profile to be part of this group. Not only by having more opportunities to go on cruises but also by their wealth. Attracting this type of customers will conduct to an increase in demand and creates the opportunity to increase firms’ loyal customers base.
Nowadays, cruise companies are building bigger ships than ever before. Currently, the larger ships, have the capacity to take in more than 6,000 passengers, being the Symphony of the Seas of RCL, the largest ship at the moment. From 2015 until
2018, in general, the growth in the available capacity11 has been higher than the
growth in the number of cruise passengers carried, being 2017 an exception, Chart
19. Even though it is not a perfect and direct relation, the number of cruisers
carried globally has been growing alongside the continuous increase in capacity.
10The World Bank. 2019.” Air Transport, passengers carried”. Accessed 28th October. https://data.worldbank.org/indicator/is.air.psgr
11 Available capacity excludes cancelled cruise days and maintenance days
22% 22%
56%
Yes, several Yes, one No
Source: Statista Survey on US residents
Chart 18 - Share of U.S. travelers who have taken a cruise in the 2012-2017 period
3.1% 4.0% 3.1% 5.1% 4.4% 4.3% 6.1% 5.0% 4.2% 2.8% 3.2% 3.1% 4.5% 2.8% 2012 2013 2014 2015 2016 2017 2018
Grow in the Nº of global cruise passengers carried Grow in the Nº of lower berths in the global cruise industry
Source: Market Watch
Chart 19 - Growth in the number of lower berths in the global cruise industry vs the growth in the number of global cruise passengers carried
Source: Company Reports. Analysts Estimates
Chart 16 -RCL's Passengers Carried Forecast, Passengers tickets revenues and onboard
revenues $0 $2,000,000 $4,000,000 $6,000,000 $8,000,000 $10,000,000 $12,000,000 0 1,000 2,000 3,000 4,000 5,000 6,000 7,000 8,000 9,000
Total Passengers carried Total onboard revenues Total Passenger ticket Revenues
Source: Company Reports. Analysts estimates
Chart 17 - RCL's Passengers Carried, commissions, transportation and others and
onboard and other costs forecast
$500,000 $1,000,000 $1,500,000 $2,000,000 $2,500,000 0 1,000 2,000 3,000 4,000 5,000 6,000 7,000 8,000 9,000 2 0 1 4 2 0 1 5 2 0 1 6 2 0 1 7 2 0 1 8 2 0 1 9 2 0 2 0 E 2 0 2 1 E 2 0 2 2 E 2 0 2 3 E 2 0 2 4 E 2 0 2 5 E 2 0 2 6 E
Total Passengers carried Total Comissions, transportation and others costs Total Onboard and other costs
“ROYAL CARIBBEAN CRUISES” COMPANY REPORT
PAGE 8/31 It is not expected that the demand meets straightway the supply, however, in the future, we believe that this increase is expected to be met. Besides being able to take advantage of economies of scale and to transport a superior number of passengers per ships, cruise companies are responding to consumer demand for a fuller onboard experience. For instance, by building larger ships, they can accommodate several amenities such as restaurants, bars, sports facilities, shopping centres, entertainment venues, communication centres and many others. In the end, the cruise ship is not only a way of transportation but the destination itself. Therefore, cruise lines became able to give an answer to the new travelling trends, keeping a mix of multigenerational customers based. With growth prospects in the number of passengers carried, this investment is expected to generate a positive effect on onboard revenues, Chart 20.
The variety of destinations available for its passengers and the different itineraries provided have also been a crucial factor for this growth. According to CLIA’s 2018 cruise travel report “Cruisers use their trips as unique ways to experience and discover new destinations”, being the younger generations, the ones showing more interest. Additionally, according to the same report, when it comes to the factors that influence the decision on vacation choice, for cruisers, the destination accounts for 60% of relevance, Chart 21.
Companies are being able to keep up with travel trends and adapting their itineraries as a result of it. In Chart 22, it is represented the global cruise industry deployment market share by region. Even though the Caribbean remains by far the most significant cruise market in the past 6 years, it has been losing its deployment market share, Chart 23. On the other hand, other regions have been becoming more trendy as for example Alaska, that in the past were thought to be
an “inaccessible” destination. Even with political and financial turmoil, the Asia
Pacific market has been growing at a fast paste. Namely, Singapore that has been elected as one of the top 10 destinations in 2019 by Cruisers’ Choice Destination Award, Figure 1.
Even though this industry keeps growing at a larger scale several red flags can come up in the future. With all the luxury, new and innovative amenities and the increase in the number of cruisers, the industry is subject to several challenges such as social and cultural matters, safety and security, legal and fiscal and also
environmental.
Cruise Industry: Participants
▪ Buyers, Suppliers, Potential Entrants
60% 20% 17% 33% 5% Destination Overall Experience Ship Cost Amenities
Source: CLIA. 2018. “Cruise Travel Report 2018”
Chart 21 - Factors Influencing Vacation Choice, 2018 34% 17% 11% 5% 5% 5% 4% 2% 16% Caribbean Mediterranean Europe China Australasia/New… Alaska Asia* South America All Other
Source: 2019 Cruise Trends and Industry Outlook
Chart 22 - Global cruise industry deployment market share in 2018 by region
31% 32% 33% 34% 35% 36% 37% 38% 2013 2014 2015 2016 2017 2018
Source: 2019 Cruise Trends and Industry Outlook
Chart 23 - Market share of the Caribbean region in the global cruise industry's deployment from
2013 to 2018
Figure 1 - 2019 Cruisers’ Choice Destinations Awards, top 10
Source: Company Reports. Analysts estimates
Chart 20 - Onboard revenues and RCL's investment in ship improvements and others
$0 $500,000 $1,000,000 $1,500,000 $2,000,000 $2,500,000 $3,000,000 $3,500,000 $1,000,000 $2,000,000 $3,000,000 $4,000,000 $5,000,000 $6,000,000 $7,000,000 $8,000,000 $9,000,000 Ships improvements Hardware and Software updating Total onboard revenues
“ROYAL CARIBBEAN CRUISES” COMPANY REPORT
PAGE 9/31 Besides the main industry players, it is important to consider several important participants, when analysing the business. First, the bargaining power of buyers
which reflects the customers’ ability to put a company under pressure and their
influence on the company profitability. Clearly, Royal Caribbean’s customers are essential to conduct the business but nonetheless, the company establishes their ticket prices according to their capacity and in order to maximize profits. The cruise industry customers can easily assess online or through travel agencies ticket prices from other competitors but are still subject to their itineraries, existing amenities and dates available. Hence, although the demand affects ticket prices due to the seasonality of the business, it only impacts until a certain level, since ultimately the company has the last call on setting the prices. Additionally, the bargaining power of the travel agencies is more relevant since they are the primary distribution channel in the industry and the main source of ticket sales. Due to the reliance on travel agencies, there is the need to practice competitive commissions because otherwise travel agents may be incentivized to sell tickets by other market participants.
As for the firm suppliers and their bargaining power, it comprises the ability of the company’s suppliers to raise prices or reduce the quality of the goods delivered. The main suppliers of RCL are the ship manufacturers, who have low Bargaining Power since there is a reduced number of cruise lines and a substantial capital requirement to order a ship. Moreover, an increase in raw materials’ prices can impact the shipbuilders’ practised prices.
Lastly, the cruise industry is very condensed and subject to controlling organizations as CLIA which endorses policies and practices in the cruise business. This association embodies over 50 cruise brands that represent more
than 95% of the cruise industry capacity12 and hence is very influential around the
regulatory and institutional policymakers, worldwide.
Since the main cruise brands dominate the market, it can be considered as an oligopoly. Nonetheless, each cruise brand has different branches that serve distinct clients and hence, different prices. New entrants would find hard to set competitive prices and develop strong brands that disrupted the resilient loyalty programs of the competitors. Additionally, there’s a huge financial barrier of acquiring ships and regulatory procedures.
Even though cruise lines also compete with other vacation alternatives for the leisure vacation segment as resorts and sightseeing destinations, the main players
“ROYAL CARIBBEAN CRUISES” COMPANY REPORT
PAGE 10/31 in the cruise markets are Carnival Corporation & plc (CCL), Royal Caribbean
Cruises, Ltd (RCL) and the Norwegian Cruise Line Holdings Ltd (NCLH)13.
Together these three companies are responsible for 80% of the industry market share. These three companies are all based in the US and have a very similar structure of revenues sources. The three of them, in the last five years, have presented net income margins on average between 10%-14%, Table 2, showing historically similar levels of profitability. The CCL has been for many years the
leader of the industry caring 47.31%14 of the industry passengers, being
considered the largest cruise company in the world. The firm counts with 104
ships15 with a passenger capacity of 237,000, declaring a revenue over $18 billion.
This company serves mainly the mass and luxury market, is composed of 9 global brands, providing more than 700 ports worldwide, where over 70% of its revenues resulted from its passenger tickets sales. It is expected the addition of 3 new ships until 2022 to its fleet. Operating also in similar markets, NCLH has two global brands: Oceania and Regent. Along the years the company has been focusing on the development of a “Freestyle Cruising” experience to its customers, differentiating itself from the other two main competitors. With this strategy, NCLH makes its services available more appealing not only to younger generations and “first-time cruisers” but also to regular cruisers that want to experience something different. We believe that this strategy provides a competitive advantage to the firm. Since 2015, NCLH has been the one to evidence more revenues’ growth within the three companies’, Chart 24. Globally it has on service 21 ships reaching 420 destinations with approximately 40,000 berths. As for 2019, it will enter in service 6 new ships.
When examining RCL’s liquidity position, Table 3, it is possible to conclude that
the firm has difficulty to meet its short-term responsibilities even if it uses all its current assets. Even though it is a clear liquidity problem this ratio level is common among the cruise industry players. Nonetheless, the situation itself implies a financial risk of not meeting its credit responsibilities. One of the main reasons behind this common situation is the deposits received from cruisers in advance, that end up as a ‘current liability’. The same alarmingly situation happens when we look to the cash flow management capacity of the firm, Table 4. Even though a low Cash Conversion Cycle (CCC) is an ideal liquidity position, these firms present a negative CCC. Meaning that suppliers are financing the firm’s operations, increasing, again the risk of not meeting its financial responsibilities. NCLH has the
13 Cruise Market Watch. 2019. “2018 Worldwide Cruise Line Market Share”. Accessed 28th October. https://cruisemarketwatch.com/market-share/
14 Cruise Market Watch. 2019. “2018 Worldwide Cruise Line Market Share”. Accessed 28th October. https://cruisemarketwatch.com/market-share/
15 Carnival Corporation – 10k Annal Report 2018
2018 CCL RCL NCLH
Current Ratio 0.24 0.17 0.17
Quick Ratio 0.19 0.15 0.15
Cash Ratio 0.11 0.04 0.05
Table 3 - Liquidity Ratios
Source: Companies 2018 Annual Reports
Table 2 - Cruise industry main players, relevant data
*Global brands ships ** 5 years average
Source: Companies 2018 Annual Reports
2018 CCL RCL NCLH Fleet * 104 50 21 Global Brands 9 4 2 Berths 237,000 113,320 40,00 Revenues 18.9 Bn 9.5 Bn 6.1Bn Net Income Margins** 11.60% 13.34% 12.73% -5.00% 0.00% 5.00% 10.00% 15.00% 20.00% 25.00% 30.00% 35.00% 40.00% 45.00% 2015 2016 2017 2018 RCL - Revenues CCL - Revenues NCHL - Revenues
Chart 24 - Revenue Growth by company, 2015-2018
Source: Companies 2018 Annual Reports
2018 CCL RCL NCLH
ACP 7 12 3
AHP 15 11 23
APP 24 34 40
CCC -2 -11 -14
Source: Companies 2018 Annual Reports
Table 4 - Activity Ratio, Cash Flow Conversion Cycle (CCC)
“ROYAL CARIBBEAN CRUISES” COMPANY REPORT
PAGE 11/31 worst position of the three cruise lines. Being capital intensive companies, these numbers put more pressure in liquidity requirements, namely in the acquisition of debt to finance new projects.
As for the firm’s management of its assets in the most efficient way, CCL presents a better ratio, Table 5, but much in line with the asset turnover of RCL and NCLH. The numbers also show the potential risk that the three companies are under in terms of liquidity and the space existent to improve the efficiency of its assets in terms of revenues.
Global Travel & Tourism Industry: How are people spending their
money
As previously mentioned, the main purpose of destinations visits in 2018 was for leisure, recreation and holidays, Chart 25. Inside the tourism industry, there are several sub-sectors such as accommodation, food and beverage services, transportation, recreation and entertainment and related industries (include travel
agencies, tour operators, and others)16. Before analysing the cruise industry it is
important to understand where the industry belongs within the tourism industry. The cruise lines besides being a way of transportation from a place to another also belongs to the accommodation sub-sector, offering also several services that can be incorporated in the recreation and entertainment sub-sector (casinos, surf simulators, etc). Additionally, cruise lines can cover multiple locations, larger distances, and connect communities onboard. The segment can offer a level of immersion that other segments can’t provide. However, for a typical passenger, the option of cruising might be a bit riskier, raising safety concerns for reluctant travellers. Tourists that take environmentalism as a way of life might discard straight away this option. Also, the concern around the perception of “hidden costs” that can come along passengers’ holidays can be an unattractive feature.
From 2009 until 2017, restaurants, hotels, airlines and cruise tourism grew on a
CAGR of 4.4%, 4.6%, 6.0% and 5.2% respectively17. According to Chart 25, the
cruise industry was the second sector with the highest growth in the mentioned period, right after the airline sector. Given the fact that cruise companies offer a “full-package” (flights to cruise ports, accommodation, amenities and others), the growth in the airlines' tourism can have a positive impact in the number of passengers carried, since RCL facilitates the management of booking flights to the
16 Revfine. 2019. “Tourism Industry; Everything You Need to Know About Tourism”. Accessed 1st November. https://www.revfine.com/tourism-industry/
17 Deloitte. 2019. “2019 Travel and Hospitality Outlook”. Accessed 30th October.
https://www2.deloitte.com/content/dam/Deloitte/nl/Documents/consumer-business/deloitte-cip-ths-travel-hospitality-outlook-2019.pdf 0.00% 1.00% 2.00% 3.00% 4.00% 5.00% 6.00% 7.00%
Restourants Hotels Airlines Cruise
Chart 25 - Tourism growth on a CAGR from 2009 to 2017
Source: Deloitte, 2019 Travel and Hospitality Outlook
2018 CCL RCL NCLH
Asset Turnover 0.45 0.34 0.40
Source: Companies 2018 Annual Reports Table 5 - Asset turnover
“ROYAL CARIBBEAN CRUISES” COMPANY REPORT
PAGE 12/31 departure ports. Hence, cruise lines have been providing an attractive way for people to spend their money.
Since leisure, recreation and hospitality represent the main drivers for people to visit other countries, it is important to give a close look at the travellers’ preference for the type of holidays chosen. As it is possible to verify the Chart 26, City Breaks and Beach Holidays are the main preference as holiday type for travellers of the region. As for cruise tourism, it only counts with a popularity of 8%. Nonetheless, a survey conducted by Association of British Travel Agencies (ABTA), showed that 45% of the people between the age of 25-34 have never been in a cruise, and
53%18 between the age of 18-24 have never been in a cruise either but
notwithstanding, showed interest on this type of holiday. The results obtained, clearly prove the potential and the available room to grow of the tourism sector.
Cruise Industry: Economic impact
The industry itself represents about 2%19 of the overall Global Travel Industry
according to CLIA, 2019 Cruise Trends & Industry Outlook, generating more than 1 million full-time jobs. Indirectly, the industry provides several types of jobs from food suppliers, engineers, manufacturers, port agents and authorities, transportation companies, tourist groups, hotels, etc. With an increase in the number of passengers carried over the industry globally, besides revenues, it also generates more onshore spending, contributing to the evolution of local economies.
Cruise Industry: Key factors & Challenges
As mentioned before, cruise companies and its ships are getting bigger than ever, and this increase in capacity is not happening only to RCL but also to the other 2
peers20. These companies are covering almost every part of the world and
updating their fleets with the most recent technologies, increasing considerably its leverage in order to keep up with the respective growth. It is expected not only an investment in the acquisition of new ships but also in improving the firm’s current ships and updating its software and hardware, Chart 27. This major investment started in FY19 and we believe that will continue to impact the firm’s CAPEX plan in FY20 but in a lower amount, stabilizing in Y25-26 should stabilize. It is also
18 ABTA. 2019. “Holiday Habits Report”. Accessed 30th October.
https://www.abta.com/sites/default/files/2018-10/Holiday%20Habits%20Report%202018%20011018.pdf
19 CLIA. 2019. “2019 Cruise Trends & Industry Outlook”. Accessed 30th November.
https://cruising.org/-/media/research-updates/research/clia-2019-state-of-the-industry-presentation-(1).pdf
20 Cruise Industry News. 2019. “2018-2019 State of the Industry Report”. Accessed 30th November
https://www.cruiseindustrynews.com/annual-cruise-industry-report.html
Source: ABTA, Associaton of British Travel Agents
Chart 26 - Popular holidays type
Source: Company Reports. Analyst estimates
Chart 27 - RCL's Capital Expenditures Forecast -$4,000,000 -$3,000,000 -$2,000,000 -$1,000,000 $0 $1,000,000 $2,000,000 $3,000,000 -$4,000,000 -$2,000,000 $0 $2,000,000 $4,000,000 $6,000,000 $8,000,000 $10,000,000
Fleet Expansation Ships improvements
“ROYAL CARIBBEAN CRUISES” COMPANY REPORT
PAGE 13/31 important to note that this expansion plan increases the companies’ exposure to risks, for instance, natural disasters, geopolitical tension, cyberattacks, and others. As for the geographic areas, North America has the major source of cruise passengers, Chart 28, while the Chinese passengers represent a growing potential market. However, demand growth is not guaranteed. Both markets have been facing “periodic” challenges, such as trade political tensions. Additionally, the
imminent risk of an economic downturn21 might compromise the continued growth
in the number of passengers carried. With a considerable increase in the supply, cruise companies might not be able to keep the high occupancy rates.
Being the consumer experience a priority and also the attraction of younger generations to the sector, the focus on technologies is one of the crucial elements for long-term strategies. However, in order to achieve these goals, cruise line employees will be a determinant factor. The tourism sector employs 1 in 10 people
in the global economy22, and with the perspective of increasing supply, companies
will need to attract more talent. With the available workforce ageing23 and the new
generations becoming more educated with a focus on challenging and demanding careers, it can become an issue to find available talent to serve the needs of the cruise industry. Therefore, it is expected skills gap resultant of the ageing population, an increase in the overall cost per employee, Chart 29, and consecutively payroll-related expenses.
With all the environmental issues and challenges faced nowadays, cruise tourism growth will need to be environmentally sustainable. The cruise ships alongside with their passengers and crews produce a considerable amount of waste and CO2 emissions. Considering also all the environmental effect on the cities ports and on the routes taken by the ships, the cruise lines are responsible for 77% of marine
pollution globally24. According to the German watchdog Nabu Survey, 25 a
passenger that stands on the deck of a cruise ship is similar to been born in one of the world’s most polluted cities evidencing the potential impact on passenger’s health. With all these issues it is expected heavy regulation on cruise lines
21 NY Times. 2019. “U.S. Economy Slows, Denying Trump 3% Talking Point”. Accessed 15th November.
https://www.nytimes.com/2019/07/26/business/economy/us-gdp-growth.html
22 WTTC. 2017. “Tourism supports 1 in 10 jobs, outpacing global economy for 6th consecutive year, WTTC”. Accessed 4th
November.https://www.wttc.org/about/media-centre/press-releases/press-releases/2017/tourism-supports-1-in-10-jobs-outpacing-global-economy-for-6th-
consecutive-year-wttc/#:~:targetText=Tourism%20supports%201%20in%2010%20jobs%2C%20outpacing%20global,for%206th%20consecutive%20year%2C%20WTTC&targ etText=According%20to%20the%20research%2C%20Travel,impacts%20are%20taken%20into%20account.
23 Delloite. 2018. “The longevity dividend: Work in an era of 100-year lives”. Accessed 4th
November. https://www2.deloitte.com/us/en/insights/focus/human-capital-trends/2018/advantages-implications-of-aging-workforce.html
24Windrosenetwork. 2018. “The Cruise Industry: Environmental Issues”. Accessed 5th November.
http://www.windrosenetwork.com/The-Cruise-Industry-Environmental-Issues
25 The Independent. 2018. “Cruise ships still using ‘dirtiest of all fuels’ must be banned in European ports, says environmental group”. Accessed 5th November.
https://www.independent.co.uk/environment/cruise-ships-air-pollution-dirty-fuel-heavy-oil-europe-ports-nabu-a8502771.html Source: Analysts Estimates
Chart 28 - Source of passengers carried by region 2018
Source: CLIA – Cruise Lines International Association 50% 25%
20% 5%
North America Europe Asia/Pacific Others
Chart 29 - Payroll and related expenses forecast $0 $200,000 $400,000 $600,000 $800,000 $1,000,000 $1,200,000 $1,400,000 $12.00 $12.50 $13.00 $13.50 $14.00 $14.50 $15.00
“ROYAL CARIBBEAN CRUISES” COMPANY REPORT
PAGE 14/31
regarding environmental sustainability. For example, in this current year, sulfur emissions will be highly regulated implying new costs for cruise companies.
Macroeconomics Analysis
RCL operates in an international spectrum, macroeconomic factors regarding the regions where the company operates and where their customers are sourced will impact the company business according to the changes in the areas and their respective influence on the company. In the following section, it will be analysed relevant macroeconomic. Moreover, these factors assisted in the projection of key captions and assumptions in the valuation of RCL.
Royal Caribbean’s macroeconomic analysis is segmented into the following four regions: North America, Europe, Asia/Pacific and Other Regions. The cruising business is nowadays a well-established holiday choice among North American and European customers, however, it is yet a developing sector in Asia and the other regions. Withal, industry penetration rates, Table 6, are still low and there is still a considerable number of first-time cruisers. Consequently, there is room for Royal Caribbean to expand its fleet, increasing the global passengers carried while improving its market share in the industry.
North America
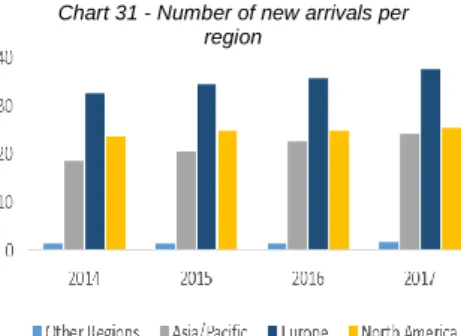
North America represents the region with the biggest weight in the global cruise guests, approximately 49,9% in 2018, Chart 30. Moreover, it is also is the area where Royal Caribbean collects more percentage of revenues and has more vessels operating in. According to the CLIA, North American passengers continue to present a positive growth, with an increase of 9% in 2018. Additionally, the number of arrivals in the region have been increasing for four consecutive years from 23.77 million arrivals to 25.38 million, Chart 31. From 2018 to 2019, North American real GDP growth decreased from 2.70% to 2.10%, Chart 32, which was
primarily due to the international trade tensions and weak growth overseas26.
Concerning the consumer price index, there’s a substantially decrease from 2018 to 2019, with prospects for a stabilization afterwards, Chart 33.
Europe
The European market is the second largest in the cruise industry, positioned behind the North America segment, representing 25.1% of the 2018 global ocean
26 NY Times. 2019. “U.S. Economy Slows, Denying Trump 3% Talking Point”. Accessed 15th November.
https://www.nytimes.com/2019/07/26/business/economy/us-gdp-growth.html Chart 31 - Number of new arrivals per
region
Source: The World Bank. International tourism, number of arrivals. 2017; analysts estimates
Source: RCL, Company Annuals Report
Table 6 - Industry Penetration rates per Region Year NA EU A/P 2014 3.46% 1.23% 0.06% 2015 3.36% 1.25% 0.08% 2016 3.43% 1.23% 0.11% 2017 3.56% 1.28% 0.15% 2018 3.59% 1.31% 0.19%
Source: CLIA – Cruise Lines International Association Chart 30 - 2018 Global Ocean Passengers
49.9%
25.1% 20.0%
4.9%
“ROYAL CARIBBEAN CRUISES” COMPANY REPORT
PAGE 15/31 passengers, Chart 30. In 2018, European ocean cruise passengers grew 3.3% compared to the prior year reaching 7.17 million travellers. The Western Mediterranean area continues to be the most popular itinerary within Europe, followed by Northern Europe. Additionally, the Eastern Mediterranean area presented a significant growth of 8.5%, which proves a beginning of confidence in
that region27. German and UK & Ireland travellers continue to be the citizenship
with the most volume among the total European passengers’ volume.
Regarding Europe’s number of new arrivals, there’s a significant increase of 17,5% from 2014 to 2017, reaching 31,63 million, on average. From 2018 to 2019 the European real GDP growth decreased from 2.20% to 1.50%, which is a significative change that corresponds to the global economic slowdown. According to the IMF forecast, the European GDP growth will stabilize around 1.70% in the next years, Chart 32.
Asia/Pacific
In 2018, Asia/Pacific represented 20% of the global ocean passengers resulting in 5,701,000 travellers, which illustrated a positive growth of 3.9%. In 2019, there were 39 cruise brands operating in the region, totalling 79 ships. Compared to 2014, the number of ships in Asia/Pacific grew 58%. In 2019, there were 7 mega-ships (more than 3,500 capacity) and 18 large vessels (between 2,000 and 3,500
passenger’s capacity) of the 79 in circulation28. After four years of consistent
growth (2014-2017), the number of sailings experienced a slight decrease, registering 1,917 sailings in 2019 comparison to the 2,041 sailings in 2018. Nonetheless, the compounded annual growth rate in this region was approximately 31% from 2014 to 2018, Chart 32.
The Asia/Pacific real GDP growth will also decrease in 2020, projected by a fast recover immediately after.
Other Regions
Other regions represent the area with less impact on the company’s revenues, but nonetheless comprises specific itineraries fundamental to capture all market segments, namely some exotic destinations which include Galapagos Islands, the
27 CLIA. 2019. “2018 Europe Market Report”. Accessed 14th November.
https://cruising.org/-/media/research-updates/research/final-market-report-europe-2018.pdf
28 . CLIA. 2019. “Asia Cruise Deployment & Capacity Report”. Accessed 14th November.
https://cruising.org/-/media/research-updates/research/2019-asia-deployment-and-capacity---cruise-industry-report.pdf Chart 33 – U.S. Consumer Price Index
Source: IMF, 2019 Source: IMF, 2019.
Chart 32 – Regions Real GDP growth
0.00% 2.00% 4.00% 6.00% 8.00% 10.00% 12.00% 14.00% 16.00% North America GDP Asia/Pacific GDP Europe GDP Ecuador South America
“ROYAL CARIBBEAN CRUISES” COMPANY REPORT
PAGE 16/31 Panama Canal, South America, Antarctica and Arctic. In 2018, representing 5% of the global ocean passengers, reaching 1,406,000 travellers.
It was retrieved data about the prospects of the real GDP growth in Ecuador and in the South America region in order to know the region financial situation, Chart
32. It is possible to observe a substantial increase in the real GDP growth from
2019 to 2022. This strength in the economy is favourable to the tourism sector and therefore, RCL.
Valuation
In order to evaluate Royal Caribbean Cruises Ltd. and give a recommendation to investors, it was performed the Discounted Cash Flow Model (DCF).
Value Drivers – Revenues
With the purpose of forecasting Royal Caribbean’s revenues, it was defined the core value drivers related to this caption and then applied to each of the four regions (Asia/Pacific, North America, Europe and Other Regions). Hence, RCL’s revenues are segmented into Passenger Ticket Revenues, Onboard Revenues and Other Revenues as previously mentioned. Moreover, to obtain nominal values, it was considered the inflation rate of the United States, since the reporting currency is in U.S. dollars.
• Passenger Ticket Revenues
Regarding the passenger ticket revenues, it represents around 72% of the revenues and it incorporates the sale of passenger tickets and air transportation to the ships. The drivers selected, Table 7, for this section were the Number of Passengers Carried and the Average Ticket Price per Passenger.
Concerning, the Number of Passengers Carried, it relies on a cruise metric of capacity, the Available Passengers Cruise Days (APCD) and the Occupancy Rate. The APCD represents double occupancy per cabin (also known as berth), multiplied by the number of cruise days in a year. Additionally, to forecast the capacity, it was considered the APCD per ship with the number of ships operating in the year.
In regards to the Occupancy Rate, it is assessed with the past occupancy rate, considering the growth in the number of new arrivals in each region, Chart 34. An Occupancy rate above 100%, implies that more than two passengers occupied the same cabin.
Source: Analysts estimates
Chart 34 - Average Ticket Price per Region $0 $200 $400 $600 $800 $1,000 $1,200 $1,400 $1,600 2018 2019E2020E2021E2022E2023E2024E2025E2026E Asia/Pacific Europe North America Other Regions
Table 7 – Passenger Ticket Revenues, Value Drivers
Passenger Ticket Revenues
Number of Passengers APCD
APCD per ship # ships Occupancy Rate
∆ Number of Arrivals
Average Ticket Price per Passenger U.S. Inflation Rate
“ROYAL CARIBBEAN CRUISES” COMPANY REPORT
PAGE 17/31 In relation to the Average Ticket Price per Passenger forecast, it was obtained historical past practised prices adjusted to the U.S. inflation rate, which globally averaged $1,241.
• Onboard and Other Revenues
The Onboard and Other Revenues comprise the sales of goods/services onboard of Royal Caribbean Cruises ships as well as some percentage of revenues of third-party concessionaires and bareboat charters. It also includes procurement and management related services that RCL performs on behalf of unconsolidated affiliates. This section represents about 25% of RCL’s total revenues. Onboard and Other revenues were further decomposed into Passengers Cruise Days (PCD) and the Revenues per Passenger per Day, Table 8.
The PCD is also a cruise metric that portraits the demand through the number of days spent in the ships by cruisers given the total number of passengers carried. Consequently, it can also be accessed through the APCD and Occupancy rate previously mentioned.
The Revenue Per Passenger Per Day takes into account the U.S. inflation rate and the purchasing power of consumer through the GDP growth. Moreover, the highest values observed in this caption, according to the respective region, were in the same year as the highest values on the passenger ticket prices revenues. From FY14-26E, the expected global revenues per passenger, per day, onboard is $56.15.
• Other Revenues
Historically, other revenues have been representing around 3% of total revenues.
This component does not result from a specific source of revenues29 and has been
constant over the fiscal years with prospects to continue to present the same percentage. Consequently, they are expected to grow alongside the other two sources of income. The value drivers considered were applied and adjusted regarding each region behaviour.
Regional Impact
From the forecasted revenues of Asia/Pacific, it is possible to mention a significant growth in passenger ticket revenues in 2021 in comparison to the selected years (2014 to 2026), Chart 35. In this year, it is expected an increase in the number of passengers carried accompanied with the introduction of a new ship in the region,
29 Other revenues are the result of cancellation fees and other small sources of income for example
Source: Company Annual Reports; Analysts Estimates
Chart 35 - Asia / Pacific Revenues
0 2 4 6 8 10 12 $0 $200,000 $400,000 $600,000 $800,000 $1,000,000 $1,200,000 $1,400,000 $1,600,000 $1,800,000
Passenger Ticket Revenues Onboard and other revenues Other Revenues Number of Ships
Table 8 - Onboard and Other Revenues, Value Drivers
Onboard and Other Revenues
Passengers Cruise Days (PCD) APCD
Occupancy Rate
Revenue per Passenger per Days Real GDP growth
“ROYAL CARIBBEAN CRUISES” COMPANY REPORT
PAGE 18/31 namely Oasis 5, that will generate additional 5,500 berths. Furthermore, there’s an expected increase in the number of arrivals in the region of 0.02%.
Regarding the European Passengers Ticket Revenues, the highest growth forward is observed in 2020. This is due to the fact that Royal Caribbean will introduce three new ships in that region, namely Odyssey of the Seas, Celebrity Apex, and Silver Moon, combining a total of 7,700 berths in the region, Chart 36. In addition, the number of European arrivals is expected to grow in 2020 by 0.02%.
The height of the North American passenger ticket revenues is forecasted to be in 2022, Chart 37, for the same reasons above mentioned. It is expected the introduction of 2 new vessels: Iron Class 1 and Edge 4, with an aggregate capacity of 8,850 berths. The North America region represents the itinerary which contributes more to the company revenues. Keeping that in mind and according to the ticket revenues forecast, we can observe a positive growth.
As previously mentioned, Other Regions represent more exotic and “inaccessible” destinations, nonetheless key to address a broader market. In terms of revenues, represents about 4% of the total receipts. Since it provides more exclusive destinations, it also charges the highest ticket price Chart 38. It is expected the highest growth in 2020 with the acquisition of Silver Origin, adding 100 berths of capacity.
Operating Margin
With a strong and defined expansion plan in line for the future, it is important to pay a close look at the operating margin and its forecast. Historically, namely from 2014 to 2018, RCL’s operating margin has been growing on average 11%, annually. Even though it is a positive profitability ratio and during the mentioned period the company presents the same margin as CCL, in comparison to NCLH operating margin of 23%, it is considerably lower, Chart 39.
The main drivers of this slowdown on RCL’s operating margin come with the
general increase of the firm’s cruise line operating costs. The commissions,
transportations and others and the onboard and other costs are expected to increase since they are directly impacted with the revenues resultant from the ticket sells and from the onboard revenues, respectively, for each region. In order to
attract and retain customers, RCL has an “Air2Sea program”30. This program
enables RCL’s customers to pay a lower airfare for their ticket flight to the
30 Royal Caribbean International. 2019. “Air & Ground – Cruise Transportation”. Accessed 16th November.
https://www.royalcaribbean.com/plan-a-cruise/transportation
Source: Companies respective annual reports.
0% 16% 9% 12% 15% -15% 32% 11% 42% 20% 15% 15% 2015 2016 2017 2018
Peers Operating Margin
RCL CCL NHCL
Chart 39 - RCL, CCL and NCLH historical operating margin
Source: Company Annual Reports; Analysts Estimates Chart 36 - Europe Revenues
0 2 4 6 8 10 12 14 16 18 $0 $500,000 $1,000,000 $1,500,000 $2,000,000 $2,500,000 $3,000,000 2 0 1 4 2 0 1 5 2 0 1 6 2 0 1 7 2 0 1 8 2 0 1 9 E 2 0 2 0 E 2 0 2 1 E 2 0 2 2 E 2 0 2 3 E 2 0 2 4 E 2 0 2 5 E 2 0 2 6 E
Passenger Ticket Revenues Onboard and Other
Other Number of Ships
Source: 2018 Annual Report; Analysts Estimates
Chart 37 - North America Revenues
0 5 10 15 20 25 30 $0 $1,000,000 $2,000,000 $3,000,000 $4,000,000 $5,000,000 $6,000,000 2 0 1 4 2 0 1 5 2 0 1 6 2 0 1 7 2 0 1 8 2 0 1 9 E 2 0 2 0 E 2 0 2 1 E 2 0 2 2 E 2 0 2 3 E 2 0 2 4 E 2 0 2 5 E 2 0 2 6 E
Passenger Ticket Revenues Onboard and Other Revenues Other
Number of ships
Source: 2018 Annual Report; Analysts Estimates
Chart 38 - Other Regions Revenues
0 2 4 6 8 10 12 $0 $50,000 $100,000 $150,000 $200,000 $250,000 $300,000 $350,000 $400,000 $450,000
Passenger Ticket Onboard and Other Other Number of Ships
“ROYAL CARIBBEAN CRUISES” COMPANY REPORT
PAGE 19/31 departure port (and return). Additionally, the company offers a 110% refund in the form of a shipboard credit, if the difference in price paid by cruisers is not the lowest airfare in the market. This program comes with costs, and with the expected increase in the number of passengers carried, Chart 40, the cost of the air transportations is also expected to increase.
With the introduction of more 12 ships on the horizon, several costs that without these acquisitions were expected to remain relatively the same as Payroll, Food related costs (assuming an occupancy rate above 100%) or the amount of fuel consumed (adjusted to oil market prices) are expected to increase Chart 41. Something that will result in slower growth of the operating margin, in comparison to the past results but still a positive variation. With an overall increase of capacity, mainly for North America and Europe regions, it is expected an increase in the mentioned costs. By increasing the number of ships, more staff will be needed in order to maintain the standards of high quality required for this competitive industry. Additionally, it is also expected an increase in the payroll expenses per employee, given the new technological updates and mechanical alterations and acquisitions to RCL’s fleet, adjusted to each country inflation. The same reasoning regarding capacity increase should be applied to the expenses with food and operating and others.
Even with hedging instruments, oil prices fluctuations can have a strong impact on the final earnings of the company’s year. With the increase of ships number conducting to higher general fuel expenses, FY20 will be marked by the beginning of the reduction of these expenses for RCL, Chart 42. Since the expected oil prices are anticipated to smoothly decrease. Additionally, RCL has been adopting strategies to use “less energy”, as for example the harnessing of ships wasted engine heat, the adjustment of ships speeds in other to optimize its fuel efficiency or the use of solar panels, in order to partially offset these costs fluctuations. Adding to this strategy, the acquisition of more energy-efficient ships since FY16 to its fleet, contributed to the reduction of fuel consumption from FY16 to FY18,
Chart 43. Even with this more fuel efficiency strategy, given the capacity and size
of the new acquired ships, as the Spectrum of the Seas that entered in service in 2019, with 4,250 berths and the Odyssey of the Seas that is expected to enter in service in 2020 with the same capacity, the fuel expenses per ship are expected to rise in these two years. After FY20, fuel expenses are expected to slowly decrease but remaining more less the same, going along with expected future oil prices 0.00 5,000.00 10,000.00 15,000.00 20,000.00 25,000.00 30,000.00 35,000.00 2014 2015 2016 2017 2018
Chart 43 - Historical RCL's annual fuel consumption per ship
Source: Company Annual Reports
0 10 20 30 40 50 60 70 $0 $200,000 $400,000 $600,000 $800,000 $1,000,000 $1,200,000 $1,400,000
Payroll and other Food
Fuel Ships
Chart 41 – Operating costs and RCL’s number of ships, forecast
Source: Company Annual Reports; Analysts Estimates Source: Company Annual Reports; Analysts Estimates 0 1,000,000 2,000,000 3,000,000 4,000,000 5,000,000 6,000,000 7,000,000 8,000,000 0 500,000 1,000,000 1,500,000 2,000,000 2,500,000 3,000,000 3,500,000 4,000,000 4,500,000 5,000,000
Asia/ Pacific Europe North America Other regions Total Passengers carried
Chart 40 - RCL's passengers carried forecast by region and globally
Source: Company Annual Reports; Analysts Estimates $0 $10 $20 $30 $40 $50 $60 $0 $2,000 $4,000 $6,000 $8,000 $10,000 $12,000 $14,000 $16,000 $18,000 $20,000
Fuel Expenses per Ship Oil future prices
Chart 42 - Historical and forecast fuel expenses per ship
Chart 44 – RCL’s Operating Margin
Source: Company Annual Reports; Analysts Estimates 35.00% 36.00% 37.00% 38.00% 39.00% 40.00% 41.00% 42.00% 43.00% 44.00% 45.00% 46.00% $0 $1,000 $2,000 $3,000 $4,000 $5,000 $6,000