DUTCH DISEASE AND INCOME INEQUALITY IN LATIN
AMERICA
Marcelo Serejo Bento
Dissertation
Master in Economics
Supervised by
Maria Isabel Gonçalves da Mota Campos Ana Paula Ferreira Ribeiro
2018
Acknowledgments
Foremost, I am grateful for the opportunity to join in FEP, both to take a master degree and to live two years in an amazing city, Porto, Portugal. Without the support of my parents it would not be possible.
Not least, I thank to my supervisors, Maria Isabel Mota and Ana Paula Ribeiro, for their support, advices and insights in all the process of elaborating this dissertation. Their unwavering dedication and their always present guidance was extremely important for me to keep on motivated and to improve my knowledges, with new insights for this work. I would also like to thank my geographer friend, Thiago Monteiro, for the contributions in elaborating the maps of this dissertation.
Finally, I would like to express my gratitude to my girlfriend, Nathália Tomazini, who always was by my side, listening to my complaints and anxieties and helping me to overcome any personal worry.
Abstract
The main goal of this dissertation is to analyse the impact of Dutch disease on income inequality in Latin American countries. Latin America is among the regions with the highest levels of income inequality, although a decreasing path was observed in the 2000s. According to Messina & Silva (2017), the exchange rate appreciation that characterizes the Dutch disease, and the associated demand shift towards the non-traded sector, changed interfirm wage differentials and is a key explanation for the observed decrease in wage inequality. To the best of our knowledge, there are very few studies on the effects of Dutch disease on inequality. Although the literature presents some statistical, both direct and indirect, evidence on the relation between Dutch disease and inequality in Latin American countries, no formal assessment is done through the use of multivariate econometric models. Therefore, a panel data model is estimated using data for 14 Latin American countries from 1997 to 2015 to assess the effects of Dutch disease (proxied by e.g., natural resource rents, energy price index, commodities’ exports) on inequality (e.g., Gini index), using Least Squares estimation. Furthermore, we test if the spending effect channel is likely to explain how Dutch disease impacts on income inequality. We find out that Dutch disease effects are important to explain the decrease in income and wage inequality in Latin American countries during the 2000s. Moreover, the effects of the commodity boom on employment in services through the spending effect, is a relevant, but not exclusive, channel to explain the Dutch disease effects on income and wage inequality.
JEL-codes: D31; F16; O13; O15; O54; Q33.
Keywords: Natural resource boom; Dutch disease; income inequality; Latin America.
Resumo
O objetivo principal desta dissertação é analisar o impacto da
Dutch disease (doença holandesa) na desigualdade de rendimentos
nos países da América Latina. A América Latina está entre as regiões do mundo com os maiores níveis de desigualdade, embora tenha sido observada uma trajetória decrescente nos anos 2000. De acordo com Messina & Silva (2017), a valorização cambial que caracteriza a
Dutch disease, e a associada deslocação da procura em direção ao
setor produtor de bens não transacionáveis, alterou os diferenciais salariais entre empresas e esta é uma explicação fundamental para a diminuição observada da desigualdade salarial. Até onde sabemos, existem poucos estudos sobre os efeitos da Dutch disease na desigualdade. Embora a literatura apresente algumas evidências estatísticas, diretas e indiretas, sobre a relação entre a Dutch
disease e a desigualdade nos países da América Latina, nenhuma
avaliação formal é feita através da utilização de modelos econométricos multivariados. Neste estudo, é estimado um modelo de dados em painel utilizando 14 países latino-americanos de 1997 a 2015 para avaliar os efeitos da Dutch disease (avaliada através do rendimento de recursos naturais, índice de preços de energia, ou exportação de commodities, por exemplo) sobre a desigualdade (avaliada, por exemplo, pelo índice de Gini), utilizando estimadores de Mínimos Quadrados. Adicionalmente, testamos se, em particular, o efeito da despesa (spending effect) é um canal relevante para explicar o impacto da Dutch disease na desigualdade de rendimentos. Os resultados mostram que a Dutch disease é importante para explicar a diminuição da desigualdade de salários e rendimentos nos países latino-americanos durante os anos 2000. Além disso, o impacto do boom das commodities no emprego no setor de serviços mostra que o efeito da despesa (spending effect) é
um canal relevante, mas não único, para explicar os efeitos da Dutch
disease sobre a desigualdade de salários e rendimentos.
Códigos-JEL: D31; F16; O13; O15; O54; Q33
Palavras-chave: Boom de recursos naturais; doença holandesa; desigualdade de rendimentos; América Latina.
Contents
Acknowledgments... ii Abstract... ... iii Resumo... ... iv List of tables... viList of figures... vii
Chapter 1. Introduction... 1
Chapter 2. On the mechanics of Dutch disease and inequality...4
2.1 Dutch disease: brief characterization...4
2.2 Inequality: concepts and measures...7
2.3 The mechanics of Dutch disease and inequality...9
2.4 Dutch disease and inequality: empirical studies...12
Chapter 3. Dutch disease and inequality in Latin American countries: an assessment...15 3.1 The model... 15 3.2 Data... 16 3.2.1...Inequality measures ... 16 3.2.2...Explanatory variables ... 18 3.2.3...Descriptive statistics ... 29 3.3 Model specification... 31 3.4 Analysis of results... 32
3.4.1...Does Dutch disease have impacts on inequality? ... 33
3.4.2...Assessing the importance of the spending effect ... 36
References... 44 Annexes...
List of tables
Table 1 – Summary of Dutch disease effects on employment...5
Table 2 – List of countries by region...15
Table 3 – Descriptive statistics...30
Table 4 – Correlation matrix...31
Table 5 – Specification and diagnostic tests...32
Table 6 – Determinants of the income inequality (Gini index)...34
Table 7 – Determinants of the income inequality (Gini index) (1997-2015), using two-equation estimation...38
List of figures
Figure 1 – Gini index of income inequality in Latin American, South American and Central American countries and Mexico (average), 1997 - 2015...17 Figure 2 – Map of Gini index of income inequality in Latin American countries, 1997 and 2015...18 Figure 3 – Energy price index (annual series in real US dollars, 1997=100), 1997 - 2015...19 Figure 4 – Natural resource rents in Latin American, South American and Central American countries and Mexico (average) (% of GDP), 1997 - 2015...21 Figure 5 – Map of natural resource rents (% of GDP) in Latin American countries: 1997, 2006 and 2015...22 Figure 6 – Ores, metals and fuels exports (% of GDP) and manufactures exports (% of GDP) in South American countries and in Central American countries and Mexico (average), 1997 - 2015...23 Figure 7 – Employment in services (% of total employment) in South American countries and in Central American countries and Mexico (average), 1997 - 2015...25
Chapter 1. Introduction
According to Gasparini & Lustig (2011), Latin America has one of the highest levels of income inequality (as measured, e.g., by the Gini index) in the world. In the 1990s, a decade characterized by several economic reforms in emerging market countries – such as trade openness –, income inequality exhibited an upward trend in Latin America. In contrast, during the 2000s, income inequality kinked to a downward trend in Latin America (Gasparini & Lustig, 2011; De La Torre et al., 2017; Messina & Silva, 2017).
According to De La Torre et al. (2017), the 2000s were characterized by high worldwide economic growth, especially in China and in the Group of Seven (G7) countries, and by the rise in the price of some commodities that strongly appreciated the currencies of the countries that exported this type of products. Among Latin American countries, income inequality in the 2000s decreased faster in commodity-exporting countries (Chile, Bolivia, Colombia, Peru, Ecuador, Brazil, and Argentina) than in commodity-importing countries (mostly in Central America and the Caribbean). When the commodity prices’ boom ended, post-2012, wage inequality inverted its downward trend and started rising again. This suggests that the boom of demand for commodities had an important role in explaining the declining inequality trend in Latin America. As suggested by Messina & Silva (2017), the decline in Latin America wage inequality in 2000s can be broken down into several parts: while the increase in the minimum wage and the trend towards formalization of employment were forces with secondary, if any, relevant role, the most important explanation combines supply-side forces (education expansion and falling skill-premium) with demand-side forces (shifts in aggregate domestic demand and commodity boom effects on interfirm wage differentials).
Whereas other sources of changes in inequality have already been thoroughly explored in the literature, only very recently some pieces of research started analysing the effects of the Dutch disease on income or wage inequality. In order to explain this relationship,
e.g., Goderis & Malone (2011) present, through a theoretical model,
some mechanisms to explain how Dutch disease can lower income inequality in the short-run. According to Messina & Silva (2017), Latin America is a region where the Dutch disease can arise as a key explanation for the decrease in wage (and income) inequality during the 2000s. Following a commodity price boom, the exchange rate appreciation and the associated demand shift towards the non-tradable sector (spending effect) suggest the influence of the Dutch disease on wage inequality, by changing interfirm wage differences.
The main goal of this dissertation is to analyse the impact of Dutch disease on income inequality in Latin America. For this purpose, first we aim at identifying the theoretical channels through which Dutch disease impacts on labour markets, and thus on income inequality. Then, we proceed with reviewing the empirical evidence on this relationship. Furthermore, concerning the commodity prices boom cycle during the 2000s, we use panel data for Latin American countries to model and assess the effects of Dutch disease (by using,
e.g., natural resource rents, energy price index, commodities’
exports as proxies) on several inequality measures (e.g., the Gini index), using Least Squares estimation. Moreover, we run additional models to assess whether the spending effect is a relevant channel to explain the relationship between Dutch disease and income inequality.
The central questions to answer are the following: Is the Dutch disease responsible for income (and wage) inequality downward trend in the 2000s in Latin American countries? Or, to be more encompassing: Is there any empirical evidence of Dutch disease in
Latin America? If yes, through which mechanisms does Dutch disease explain income inequality?
According to Bresser-Pereira (2008), the literature on Dutch disease is yet scarce and insufficient. Moreover, to the best of our knowledge, there are few studies about the effects of Dutch disease on income or wage inequality, and this relationship is only very recently on the research agenda (e.g., Ross, 2007; Goderis & Malone, 2011; Bunte, 2016; Guerra-Salas, 2017; Messina & Silva, 2017; Steinberg, 2017). Yet, for the specific case of Latin America, there are still just two studies about this relationship (e.g., Guerra-Salas, 2017; Messina & Silva, 2017). Although some statistical evidence is suggested by Messina & Silva (2017), the authors do not analyse the topic considering a causal econometric analysis. In turn, Guerra-Salas (2017) explores the topic focusing in the business cycle, and do not test Dutch disease variables specifically. Besides that, given that Latin America exhibits one of the highest levels of income inequality in the world (Gasparini & Lustig, 2011), understanding the causes for Latin American income inequality is important on both academic and policy-making grounds.
For this purpose, in chapter 2, we explore the mechanics through which Dutch disease affects inequality. Thereby, in sections 2.1 and 2.2, we define Dutch disease and income and wage inequality, respectively. In sections 2.3 and 2.4, we proceed with exploring the theoretical mechanisms through which Dutch disease transmits to income inequality, as well as with presenting related empirical studies. In chapter 3, we start by describing the methodology and data – sections 3.1 and 3.2 – and then, we present model specifications in section 3.3. In section 3.4, we present the main results on the effects of Dutch disease on income inequality in Latin America; in addition, we disentangle the particular effects through the spending effect channel. We end with some conclusions and lines for future research in chapter 4.
Chapter 2. On the mechanics of Dutch disease and
inequality
In this chapter, we start by defining and characterizing Dutch disease, and then proceed with the concept and measurement of inequality – income and wage inequality. Finally, we analyse the literature that explains the mechanics of Dutch disease effects on inequality, focusing on both theoretical explanations and empirical results.
2.1 Dutch disease: brief characterization
The term Dutch disease was first employed by The Economist in 1977 (Corden, 1984) to describe the negative effects that featured Netherlands after a natural gas discovery in North Sea in the late 1950s and early 1960s. Netherlands initially benefited by a booming gas exports, but then suffered by a real exchange rate appreciation and the reduced competitiveness of the Dutch manufacturing exports (Gylfason, 2001; Nafziger, 2012; Corden, 1984). Nevertheless, and according to Bresser-Pereira (2008), the first studies about Dutch disease only appeared in 1980s, such as Corden & Neary (1982) and Corden (1984).
However, Corden (1984) mentions studies about gold discovery in Spanish colonies (back in the XVI century) and in Australia (already in the 1850s), which affected their industrialisation process through Dutch disease effects.1 Yet, Nafziger (2012, p. 408-409) mentions some countries that suffered from similar pathologies: Indonesian, Nigerian, Angolan and Venezuelan from petroleum; Thai from rice, rubber and tin; Malaysian from rubber and tin; Egyptian from tourism and remittances; Jordanian from remittances; Zambian 1 The gold discovery in Spanish colonies and in Australia were identified as having Dutch disease effects in 1600s and 1850s respectively, but only in 1980s onwards they were properly studied and named as Dutch disease (Corden, 1984; Bresser-Pereira, 2008).
from copper; Ghanaian from cocoa; and Brazilian and Colombian from coffee. Recent studies attempt to analyse the Dutch disease in Russia, such as Oomes & Kalcheva (2007) and Algieri (2011), which identify the existence of symptoms such as real exchange rate appreciation, relative de-industrialization and real wage growth, suggesting that these are Dutch disease consequences. Others authors, such as Ito (2017) and Kuboniwa (2012) do not identify all the symptoms, concluding that Russia did not suffer from Dutch disease.
The Dutch disease is an economic diagnosis to an economy which benefits from a commodity boom in the short-run, at the expenses of deindustrialization in the long-run (see, e.g., Corden & Neary, 1982). According to Bresser-Pereira (2008), the Dutch disease is a market failure because of the negative externalities arising from the exchange rate being more appreciated than the necessary to make other tradable sectors competitive. Corden & Neary (1982) model the economy considering two tradable sectors – a natural-resource tradable sector (booming) and non-natural-resource tradable sector (lagging) –, whose prices are set internationally; and a non-tradable sector, whose prices are set domestically. The authors describe two mechanisms through which the Dutch disease causes deindustrialization: the resource-movement effect and the spending effect.
Corden & Neary (1982) explain that, as a result of a commodity boom, the booming tradable sector benefits from an increase in income, attracting factor inputs (capital and labour) from the rest of the economy (resource-movement effect), which reduces the latter output. Moreover, the increase in the income in the booming sector also leads to an increase in the domestic demand for services (spending effect), rising prices and output in the non-tradable sector. Thus, workers shift from the lagging tradable sector (manufacturing) to the booming tradable sector (commodity) in search for higher
wage earnings (resource-movement effect) – this effect leads to direct deindustrialization. Workers also shift from the lagging tradable sector to non-tradable sector (spending effect), depending of the marginal propensity to consume services – this effect leads to indirect deindustrialization. According to Corden & Neary (1982), one of the mechanisms of adjustment is the real exchange rate, defined as the relative price of non-tradable relative to tradable goods (i.e., the relative price of services). Thereby, the spending effect increases the prices (and wages) in the non-tradable sector that, by increasing overall costs across the economy, appreciates the real exchange rate which harms the lagging tradable sector, given the impact on the manufacturing competitiveness (Corden & Neary, 1982).
Table 1 – Summary of Dutch disease effects on employment
Sector Resource movement
effect
Spending effect
Combined effect
Booming sector + - indeterminate
Lagging tradable
sector
--
-Non-tradable sector - + indeterminate
Source: Oomes & Kalcheva (2007, p. 9).
The effects on employment are summed up in Table 1 and, as explained by Oomes & Kalcheva (2007), the combined resource-movement and spending effects from Dutch disease lead to a decrease in the employment in the lagging tradable sector, causing direct and indirect de-industrialization, respectively. As the resource-movement and spending effects pull employment in opposite directions, the effect in the booming and the non-tradable sectors is indeterminate. If the booming sector employs relatively less than services or if labour mobility is low, the spending effect is likely to dominate (Oomes & Kalcheva, 2007).
Squeff (2012) identifies the overall expected effects of the Dutch disease: shift of resources and reallocation of production factors from tradable sectors (except commodities) to booming and non-tradable sectors (due to higher returns in the latter two); rise in non-tradable prices relative to tradable prices (except commodities’ prices); exchange rate appreciation; rise in government spending (due to the rise in the government revenues due to enlarged tax base); and current account deficits.
Since part of the rents from the booming sector expansion reverts to taxes, the way the government spends these extra revenues is also relevant to determining the magnitude and direction of the spending effect (Corden & Neary, 1982; Corden, 1984). The governments may neutralize the adverse effects of the boom, even though too frequently they do not (Corden, 1984; Ross, 2007). In turn, if the government adopts policies that reduce profitability in the manufacturing sector, de-industrialization may be reinforced.2 As exemplified by Ross (2007) and Nafziger (2012), Nigeria’s government failed to successfully counter the adverse effects of Dutch disease in 1970s and 1980s. Differently, in the Indonesian case for the same period, the government adopted exchange rate policies and pro-export regulatory stance, leading to a sustained growth in the manufacturing sector.
Bresser-Pereira (2013) identifies three conditions for the incidence of the Dutch disease: the discovery of natural resources in a poor country (the case of Saudi Arabia, Venezuela, for instance); the same discovery in a rich country (the case of Netherlands and the United Kingdom); and the radical liberalization of foreign accounts, both trade and financial (the case of Brazil, Argentina and 2 Governments may use extra revenues from taxes to increase social expenditure levels which may even increase labour costs and cause de-industrialization (Corden, 1984). On the contrary, they may reduce the adverse impacts of de-industrialisation, taxing the booming sector while subsidizing the lagging sector (Corden, 1984). However, this may not avoid the effects of real exchange rate appreciation, since government investments and social expenditures may also increase domestic demand (Bresser-Pereira, 2013).
Mexico). While in the first case the Dutch disease always existed which prevented industrialization from the onset, in the second case, the rich countries faced an economic disease when they discovered and exploited a commodity. The latter case refers to that of Latin America countries, where liberalism reforms eliminated the mechanisms of neutralization of Dutch disease, such as multiple exchange rates, the system of import tariffs or the subsidies to exports of manufactured goods, leading to a premature deindustrialization – it is expected a decrease in the participation of the manufacturing industry in the domestic product and net exports, in terms of value added (even it still presents high values). In accordance with Bresser-Pereira (2013), Gómez-Galvarriato & Williamson (2009) explain that most of the Latin American industrialization occurred due to favourable policies, such as higher effective rates of protection for manufacturing and a depreciation of the real exchange rate, reversing the Dutch disease forces for almost a century. Without such measures, Latin American economies become vulnerable to the Dutch disease effects (Barbier & Bugas, 2014). The Dutch disease has affected several Latin American countries over the past decades, affecting their international competitiveness, rate of innovation and long term productivity growth (Katz, 2015). Gómez & González (2017) analyse some Latin American countries from 1990 to 2014 and show that, in accordance with other authors, the mining sector was responsible for the Dutch disease symptoms in Brazil, Chile, Peru and Colombia.
2.2 Inequality: concepts and measures
From the perspective of personal distribution3, the most commonly approach used by economists, income inequality is defined as the “disproportionate distribution of total national income among 3 Other common perspective of inequality is the functional distribution, defined as the distribution of national income among factors of production (such as land, labour, and capital) (Todaro & Smith, 2012, p. 210).
households” (Todaro & Smith, 2012, p. 205). The measurement of inequality, in this context, relies on the income of households (or individuals), regardless of whether they earn it from work, interest, profits, income, gifts or inheritance (Todaro & Smith, 2012).
Inequality can be measured by dividing population into groups of ascending income, such as deciles or quintiles, and building ratios, such as the Kuznets Ratio, that is, the ratio of the top 20% and bottom 40% of the population, for example. Thus, larger is the Kuznets Ratio, the larger inequality is (Todaro & Smith, 2012). Another way to measure inequality, the Gini index, derives from the Lorenz Curve which plots the share of income per population share against the line defining perfect equality (line of equality). The straighter and closer the Lorenz curve is to the line of perfect equality, the smaller is the Gini index and the smaller inequality is. The Gini index measures aggregate income inequality, generating values between 0 (zero), a situation of perfect equality when the Lorenz curve coincides with the line of perfect equality; and 1 (one), a situation of perfect inequality when the Lorenz curve coincides with the horizontal axis and only one individual owns the entire national income (Todaro & Smith, 2012). In practice, according to Todaro & Smith (2012), while countries or regions with high income inequality have a Gini index between 0.5 and 0.7, countries or regions with low income inequality have values between 0.2 and 0.35. Other measures are the variance, the coefficient of variation, the relative mean deviation, the standard deviation of logarithms, Dalton Index, the Atkinson Index and the Theil Index, among others (Sen, 1973; Cowell, 2009). 4
According to Ferreira (2014), the above-mentioned measures can also be used to assess wage inequality in particular. However, in 4 According to Ray (1998), there are four criteria for inequality measurement: anonymity principle (names do not matter), population principle (population size does not matter), relative income principle (only relative incomes matter for measurement) and Dalton principle (an increase in inequality is accounted if a transfer of income is from a relatively poor to a relatively rich person).
this case, it is also usual to separate workers with high education (skilled workers) from workers with low education (unskilled workers) to compute the skill premium (returns to skill), defined as the ratio between the skilled and unskilled workers wages (Acemoglu, 1999). The larger is the skill premium, the larger inequality is. Furthermore, if the demand for workers does not change, an increase in the skilled workers relative to unskilled workers reduces the skill premium, and then the inequality (Acemoglu, 1999).
The relationship between income inequality and economic development has been studied thoroughly in the literature, particularly since the popularly known Kuznets theory of the inverted “U-shaped” curve hypothesis. According to this hypothesis, income inequality is expected to increase in the first stages of development and to reduce in later stages of economic development (Kuznets, 1955; Barro, 2000). Barro (2000) explains that, although earlier studies find support for this hypothesis, subsequent studies suggest that Kuznets curve explain little of the variations in inequality or that it works better in cross-section of countries than over time. According to Piketty (2015), the Kuznets theory was developed in the context of income inequality decrease after the Second World War, when several shocks between 1914 e 1945 (war, inflation and crisis of 1930s) impacted on wealth holders, and then the income inequality decrease was not caused by a “natural” economic development process, but shaped by historical circumstances. Therefore, it is important to investigate the mechanisms that impact on inequality; hence, in the next section, we investigate the channels through which the Dutch disease can impact on labour earnings.
2.3 The mechanics of Dutch disease and inequality
In order to understand how Dutch disease impacts on wage and income inequality, we identify some channels, namely the role of
the government, the resource-movement effect and the spending effect. Although the related literature on Dutch disease and income inequality focuses on the spending effect channel (e.g., Ross, 2007; Goderis & Malone, 2011; Guerra-Salas, 2017; Steinberg, 2017; Messina & Silva, 2017), we explore all possible channels:
The role of the government: Following a commodity boom, natural resource revenues may be reverted to taxes and to lower income inequality through designing policies to improve living standards (e.g., Ross, 2007; Parcero & Papyrakis, 2016; Kim & Lin, 2017).
Resource-movement effect: The resource-movement effect channel is explained by trade specialization models5, such as the Stolper-Samuelson theorem, combined with models that explain the labour shifts to the booming sector following a commodity price boom (e.g., Adão, 2015).
Spending effect and exchange rate appreciation: The labour shift from tradable to non-tradable sector, resulting from exchange rate appreciation and the spending effect, is an important channel through which the Dutch disease can affect income or wage inequality, due to features characterizing the tradable and the non-tradable sector (e.g., Ross, 2007; Goderis & Malone, 2011; Guerra-Salas, 2017; Messina & Silva, 2017; Steinberg, 2017).
The role of the government
Following a commodity price boom, since part of the rents from natural resources reverts to taxes, the improvement on government revenues allows it to better fight income inequality (Ross, 2007; Parcero & Papyrakis, 2016; Kim & Lin, 2017). According to Ross (2007), natural resource revenues allow the government to design 5 Despite the reviewed literature does not refer this mechanics as a Dutch disease effect on wage inequality, it is our understanding that trade shocks can cause a resource-movement effect, and this can be associated with Dutch disease.
policies to offset the hardship of the manufacturing sector, to provide new government jobs or to adopt more targeted pro-poor policies. Thus, oil rents may potentially reduce income inequality if extra revenues are more equitably redistributed and targeted to lower income groups (Parcero & Papyrakis, 2016) or if they are directed to increase social spending, by providing better education attainments and improved health status (Kim & Lin, 2017).
Resource-movement effect
By using the Stolper-Samuelson theorem one explains how trade liberalization may lead to a decrease in wage inequality in countries where unskilled labour is relatively more abundant (Messina & Silva, 2017). Thus, trade liberalization can give rise to Dutch disease in some countries, such as Latin American countries (Bresser-Pereira, 2008). The Stolper-Samuelson theorem (based on the Heckscher-Ohlin theorem) is derived in a neoclassical model of two countries, two goods and two factors and explains that a country specializes in the good that is more intensive in the relatively more abundant factor in the country. This raises the demand for the more abundant factor and decreases the demand of the less abundant factor, impacting on the relative prices of factors – the price of the more abundant factor rises relatively to that of the less abundant factor (Ferreira, 2014). For example, if a country is more abundant in unskilled labour, it will specialize in low-skilled labour intensive sectors, then the demand for unskilled labour will rise and the demand for skilled labour will decrease; thus, while wages of the unskilled labour will rise, those of skilled labour will decrease. Thus, if the trade specialization towards unskilled labour-intensive sectors occurs in the natural resource (booming) sector, and it causes Dutch disease, it is expected a resource-movement effect, and the associated shift of workers towards the booming sector. Exploring the labour shift towards the booming sector, Adão (2015) develops a
model of a two-sector small open economy with worker heterogeneity in sector-specific productivity. The commodity price boom may increase the booming sector (commodity) wages, attracting employees (resource-movement effect), since workers self-select into sectors based on relative wages. According to the author, however, the shock does not affect wages in the non-commodity sectors, thus only worker shifters benefit from the commodity boom. Thereby, changes in wage inequality depend on the change in the average wage differential between sectors and the change in the wage dispersion within each sector, both affected by the sectoral reallocation of workers (Adão, 2015). Then, if the booming sector practices lower initial wages, the shock will lead to increase the booming sector wages, decreasing the average wage differential between sectors. It will attract employees to the commodity sector, which will change the employment composition of the sectors and hence reduce wage dispersion within sectors.
Spending effect and exchange rate appreciation
The effects of Dutch disease may lower income inequality through the spending effect (which shifts the demand towards the non-tradable sector) and the exchange rate appreciation (from the commodity boom) which, as explained by some authors (e.g., Goderis & Malone, 2011; Guerra-Salas, 2017; Messina & Silva, 2017; Steinberg, 2017), have similar mechanics.6 The commodity price boom may improve the terms of trade, increasing the domestic demand strongly through the spending effect, which increases the 6 Goderis & Malone (2011) theoretical model explains how Dutch disease, through natural resource booms, may impact income inequality in the short- and long-run. Along the same line, Guerra-Salas (2017) develop a model to explain how the business cycle, following a commodity boom in Latin America and the sectoral allocation from tradable to non-tradable sector, may lower the income inequality. Although Steinberg (2017) treats income inequality effects as an intermediary between Dutch disease and brain drain, his model explains a similar mechanics between Dutch disease and income inequality. Messina & Silva (2017) analyse Latin American countries in the 2000s, exploring, among others, the effects from Dutch disease on wage inequality.
relative price in the non-tradable sector, appreciating the real exchange rate7 (Messina & Silva, 2017), and the optimal response is a reallocation of labour input from the tradable to the non-tradable sector, resulting in an expansion of the non-tradable output and the contraction of the tradable output (Guerra-Salas, 2017). Thus, if the non-tradable sector is more unskilled-intensive than the tradable sector, it is expected that the demand for unskilled workers will increase more than the demand for skilled workers, increasing wages of the less skilled workers relative to that of the more skilled workers; this reduces skill premium, and thus, wage and income inequality (Goderis & Malone, 2011; Guerra-Salas, 2017; Messina & Silva, 2017; Steinberg, 2017). 8
Additionally, Messina & Silva (2017) argue that even in countries where the non-tradable sector is more skill intensive than the tradable sector, it is possible to observe a decrease in income inequality. The authors explain this through interfirm heterogeneity as it is also a relevant channel to understand the impacts of Dutch disease on wage inequality. First, if more productive exporting firms tend to pay higher wages relative to the less productive firms in the same industry9, then the exchange rate appreciation harms the firms’ 7 The government may keep the exchange rate overvalued, fearing inflation (the case of Nigeria, for instance), reducing international competitiveness of the country´s exports and, consequently, the employment in the other (non-natural resource) tradable sectors (Ross, 2007).
8 Goderis & Malone (2011) explain that the opposite situation, an increase in income inequality, could occur if the resource rents represent a huge share on total economic activity and the skilled workers benefit from the greater proportion of distribution of resource rents; however, authors emphasize that this is not likely to occur in resource-rich countries. Although the authors model and prove that the income inequality is likely to decrease in developing countries in the short-run, in the long-run they model that income inequality is expected to return to the pre-boom level, although they do not prove it empirically. Ross (2007) explains that the effects on the income distribution depend on the inter-sectoral labour mobility. If there are some limits to labour mobility across sectors, this can, for example, raise unemployment in certain vulnerable groups (such as women, older workers, rural workers, or low-income workers), who would be less able to move to the non-tradable sector due to poor or no job opportunities for these groups, and thus this may increase income inequality. Yet, if workers can easily move from a sector to another, the effects are modest.
9 Following a trade opening, the more productive firms decide to begin exporting, which leads them to screen out workers with less ability due the revenue increases
export participation, decreasing the wages of these firms and then the within-sector wage inequality. Second, if interfirm wage differentials are lower in the non-tradable sector then, due to the spending effect that shifts demand from tradable sector to the non-tradable sector, a reduction in interfirm wage dispersion, and thus on overall wage inequality, is expected.
2.4 Dutch disease and inequality: empirical studies
Bresser-Pereira (2008) refers that liberalizing reforms, such as trade liberalization in Latin America, eliminates the mechanisms of neutralization of Dutch disease, giving rise to the Dutch disease. However, trade effects explained by Stolper-Samuelson theorem cannot explain the timing of the downward trend in wage inequality in Latin America countries – they can explain the downward trend in the 2000s, but most of trade liberalization occurred in the 1990s, when the inequality trend was stagnant or rising (De La Torre et al., 2017; Messina & Silva, 2017).
On the other hand, the emergence of China as a large consumer of commodities gave rise to a rise in the commodity international prices, leading to another trade shock in South American countries, since most of them are commodities exporters (Messina & Silva, 2017). In order to test the effects of the world commodity prices on wage inequality in Brazil, Adão (2015) uses a panel of a stacked sample of 518 Brazilian microregions between 1991 and 2010, and explains it by the channel of the resource-movement effect. Given that the commodity sector is important for the employment of low-income workers in Brazil, the commodity boom increased both the relative employment and the relative wage in the commodity sector, thus workers shifting towards the natural-relative to less productive firms, implying that the former is likely to pay higher wages relative to the latter, which are not able to compete in international trade (Messina & Silva, 2017). See Annex 4B in Messina & Silva (2017) for a detailed analysis.
resource sector contributed to decreases in wage inequality – the commodity price shock accounts for 5-10% in the wage inequality decrease between 1991 and 2010 in Brazil, according to Adão (2015).
However, Latin American countries also experienced indirect effects, such as the spending effect, from the commodity boom in 2000s (Messina & Silva, 2017), and then, the effects on the non-tradable sector had a predominant role (Guerra-Salas, 2017; Messina & Silva, 2017). As such, based on the spending effect and on the assumption that the non-tradable labour sector is more unskilled-intensive than the tradable sector, Goderis & Malone (2011) test the effect of the Dutch disease, through a world commodity price boom, on income inequality. The authors use a dynamic panel data with 90 countries between 1965 and 1999 (annually), estimating by ordinary least-squares (OLS) with regional time dummies and country fixed effects. They find a negative short-run effect of oil and mineral price-booms (non-agricultural export price index variation) on income inequality (Gini index), but it only occurs in developing countries (non-OECD), consistent with the notion that the non-tradable sector is more intensive in unskilled-labour in developing than in developed economies. Based on Goderis & Malone’s (2011) model, Howie & Atakhanova (2014) also find evidence of effects of the oil price increase on decreasing income inequality (as measured by the Gini index, the p50/p10 and p90/p50 ratios) in Kazakhstan, both in rural (14 regions, between 2001 and 2009) and urban areas (14 regions and 2 metropolitan areas, between 2006 and 2008).
Although Steinberg (2017) uses the relationship between Dutch disease and inequality as an intermediary channel to explain brain drain effects, he finds similar results. He uses a panel data of 116 countries between 1910 and 2009 and finds that resource booms (oil revenues per capita) lead to brain drain effects, through the relationship between Dutch disease and income inequality. According
to the author, the spending effect and the exchange rate appreciation, which leads to labour shifts from tradable (high-skilled labour intensive) to non-tradable sector (low-skilled labour intensive), reduce the returns to skill, and thus income inequality (Gini index). In turn, Guerra-Salas (2017) uses a small open economy Dynamic Stochastic General Equilibrium (DSGE) model for 18 Latin American countries between 2000 and 2012 to explain the decline in the skill premium due to the business cycle. He argues that inequality is acyclical until the 2000s, but became countercyclical afterwards, due the commodity boom and its effects on the sectoral allocation in the low-skill intensive non-tradable sector, caused by Dutch disease, terms of trade shock and capital inflows. The author finds that the favorable shock, predominantly driven by commodity prices, was responsible by the decline in the skill premium in Latin American countries in the 2000s, which accounts for about 3 percent, a fifth of the total decline. He also shows that 14 out of 18 countries in the dataset registered a decline in skill premium in the 2000s, with a mean decline of 13.8 percent.
However, Messina & Silva (2017) argue that evidence for Brazil indicates that, in fact, the employment grew faster in the non-tradable than in the non-tradable sector, but the skill intensity is higher in the non-tradable sector, thus the spending effect rose the demand for more skilled workers, and the Dutch disease, through this channel, would not explain the wage inequality downward trend observed in the 2000s. Yet, Messina & Silva (2017) show that interfirm (as opposed to intrafirm) asymmetries explain most of wage inequality and its fall in the 2000s in Latin America countries. Using data from Brazil between 2003 and 2012, when wage inequality fell significantly, the authors show that the declining variance of wages between firms is responsible for over two-thirds of the decrease in wage inequality for workers in the same sector and occupation (the heterogeneity in pay across firms accounts for 41 percent of the total
decline in wage inequality, the most representative component of total wage variance). Therefore, the interfirm heterogeneity is also a relevant channel to understand the impacts of Dutch disease (from the commodity boom) on wage inequality, through the exchange rate appreciation (shifting labour away from the most productive firms, which are also the high-pay firms, operating in the tradable sector) and the spending effect (which shifted the demand to the non-tradable sector, where interfirm wage differentials are lower) reducing interfirm wage differences and, therefore, overall wage inequality in South American countries in the 2000s (Messina & Silva, 2017).
Chapter 3. Dutch disease and inequality in Latin
American countries: an assessment
As we already mention, the income inequality downward trend in the 2000s in Latin American countries may, among others, be explained by Dutch disease effects (Guerra-Salas, 2017; Messina & Silva, 2017). In this chapter we propose to use econometric techniques to assess this relationship. Thereby, in this section we aim to identify the determinants of the changes in income inequality in Latin American countries from 1997 to 2015. The choice of the time horizon was based on the data availability for the Gini index taken from World Development Indicators (WDI). We start by considering all Latin American and Caribbean countries and eliminate the ones for which there was no information available for Gini index during the 2000s. Then, considering the available data and, in order to include the longest possible set of information, we delimited our study to the period 1997-2015. Therefore, the dataset chosen includes 14 Latin American countries, as identified by region in Table 2.
Table 2 – List of countries by region
Region Countries
South America Argentina, Bolivia, Brazil, Chile, Colombia, Ecuador, Paraguay and Peru
Central
America and Mexico
Costa Rica, Dominican Republic, El Salvador, Honduras, Mexico and Panama
Thus, we choose 8 South American countries which, according to Messina & Silva (2017) and De La Torre et al. (2017), are mostly commodities exporters; 5 Central American countries; and 1 North American country (Mexico).
3.1 The model
In order to empirically assess the role of Dutch disease on income inequality in Latin American countries, we propose to use an unbalanced panel data model, combining annual data from 1997 to 2015 and cross-section data of 14 countries.
The model can be broadly described as:
Iit=β1+β2Dit+β Xit+αi+δt+εit (3.1)
where i represents country i=1, …,14 and t stands for the year
t=1997, … ,2015 . Iit stands for the dependent variable and refers to
an inequality measure for country i at year t.; β1 is the common intercept; β2 is the coefficient associated with the Dutch disease variable; Dit is the vector of the explanatory variable capturing
Dutch disease for country i at time t; β represents the vector of coefficients associated with the explanatory variables; Xit is the
vector of control variables for country i at time t; αi and δt are
the cross-section fixed effects and time fixed effects, respectively; and εit is the error term for country i at time t.
3.2 Data
In this section, we motivate, define and present data sources for each variable used in the model. Our aim is to assess how Dutch Disease (captured by alternative measures) may explain inequality (dependent variable, also defined using alternative indicators), controlling for other determinants of inequality of standard use in the literature.
3.2.1 Inequality measures
The main dependent variable is income inequality, assessed by the Gini index, as constructed annually by the World Development
Indicators (WDI), World Bank.10 We also compute the Kuznets Ratio to measure income inequality, by dividing the income share held by highest 20% by the sum of the income share held by lowest 20% and fourth 20%, using the dataset collected from the World Development Indicators (WDI), World Bank.11 Moreover, we also test for wage inequality12, using the Gini index of labour income, taken from Socio-Economic Database for Latin America and the Caribbean (SEDLAC),
Universidad Nacional de la Plata (CEDLAS) and World Bank.13 Income and wage inequality series are, hardly, completed through linear interpolation to fill in missing values.
10 Available at http://databank.worldbank.org/data/source/world-development-indicators/, accessed on June 7, 2018.
11 Available at http://databank.worldbank.org/data/source/world-development-indicators/, accessed on June 8, 2018.
12 Although the evolution of wage inequality does not necessarily translates into income inequality, the former is the major driving force in several countries (Piketty, 2015), and thus the effects of Dutch disease on the wage inequality may also impact the income inequality.
13 Available at http://www.cedlas.econo.unlp.edu.ar/wp/en/estadisticas/, accessed on June 8, 2018.
Figure 1 – Gini index of income inequality in Latin American, South American and Central American countries and Mexico
(average), 1997 - 2015 1997199819992000200120022003200420052006200720082009201020112012201320142015 45.0 47.0 49.0 51.0 53.0 55.0 57.0
Latin American countries South American countries
Central American countries and Mexico
Source: Own elaboration. Data from World Bank, Development Research Group; Accessed on June 7, 2018; Available at http://databank.worldbank.org/.
Figure 1 shows that, although the largest reduction in inequality occurred in South American countries, which are rather sensitive to fluctuations in commodity prices (Messina & Silva, 2017), the income inequality downward trend, from 2002 onwards, is also common to Central American countries and Mexico. Beyond Dutch disease effects, Messina & Silva (2017) attribute the reduction in income inequality to schooling and institutional factors – e.g., increase in formal employment and minimum wage – even though the latter has a secondary role.
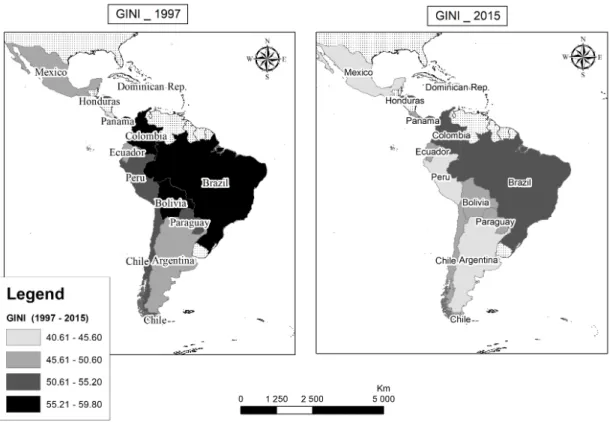
Figure 2 – Map of Gini index of income inequality in Latin American countries, 1997 and 2015
Source: Own elaboration. Data from World Bank, Development Research Group; Accessed on June 7, 2018; Available at http://databank.worldbank.org/.
Figure 2 provides the Gini index at the outset and at the end of the time horizon of our dataset, 1997 and 2015, respectively. Except for Costa Rica, all the others 13 countries presented a decrease in income inequality. Bolivia, Brazil and Colombia exhibited the highest income inequality among Latin American countries in 1997. While the former presented the largest decrease in South America, the latter two remain among the countries with the highest income inequality in the region, even though also presenting a decrease. Peru also deserves mention, being among those countries presenting largest decreases in South America. Among Central American countries, El Salvador presents the most relevant income inequality decrease. We also provide a map with the percentage change of the Gini index between 1997 and 2015, in Annex 1.
3.2.2 Explanatory variables
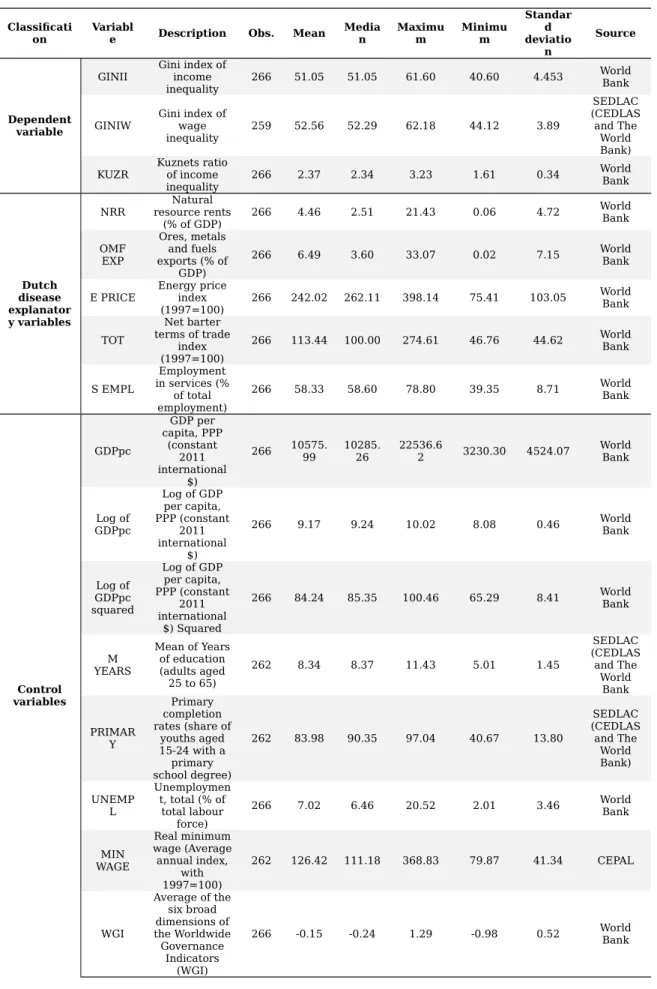
As explanatory variables, we use five variables for proxying Dutch disease: natural resource rents; ores, metals and fuels net exports (in percentage of gross domestic product); net barter terms of trade; energy price index; and employment in services. In turn, we also use five control variables: per capita gross domestic product (GDPpc), schooling, unemployment rate, real minimum wage and governance. We further detail and justify the choice of these variables below. In the case of the variables capturing Dutch disease, we also present a brief overview of their recent trends.
Measuring Dutch disease
Some authors, e.g. Goderis & Malone (2011), choose the commodity export price index (agricultural and non-agricultural commodity price) as an explanatory variable of Dutch disease, constructing weights by dividing the individual 1990 export values for each commodity by the total value of 1990 commodity exports for each country, and held the weights fixed over time. Howie & Atakhanova (2014) use the oil price as explanatory variable of Dutch disease, based on Goderis & Malone (2011), but the authors assess the effects on Kazakhstan cities, thus the value is kept unchanged on the cross-section dimension. As a result, we also propose to test the effects of energy price index (annual series in real US dollars, 1997=100) on inequality. In particular, data index is taken from World Bank Commodity Price Data (The Pink Sheet).14 However, since this is commodity index, values are unchanged across countries.
14 Available at http://www.worldbank.org/en/research/commodity-markets/, accessed on June 10, 2018.
Figure 3 – Energy price index (annual series in real US dollars, 1997=100), 1997 - 2015 1997199819992000200120022003200420052006200720082009201020112012201320142015 0.0 50.0 100.0 150.0 200.0 250.0 300.0 350.0 400.0 450.0
Energy price index
Energy price index
Source: Own elaboration Data from World Bank Commodity Price Data (The Pink
Sheet); Accessed on June 10, 2018; Available at
http://www.worldbank.org/en/research/commodity-markets.
As the Figure 3 presents, the energy price shows a high increase in 2000s. The commodity price boom starts from 2002 to 2008, and keeps high even from 2011 to 2013. Thus, this commodity price boom may give rise to Dutch disease effects in Latin American commodity exporters countries. As the specific impact in each country is not assessed by this variable, and once our dataset includes countries where Dutch disease may arise and countries where it may not, we also test other variables.
As the key explanatory variable, to measure Dutch disease we choose natural resource rents (as a share of gross domestic product – GDP) using the dataset from World Development Indicators (WDI), World Bank.15 This variable refers to the difference between the price of a commodity and the average cost of producing it, multiplied by the extract or harvest quantities for each country, determining the rents for each commodity as a share of gross domestic product (GDP). This variable captures the evolution of country production of 15 Available at http://databank.worldbank.org/data/source/world-development-indicators/, accessed on June 7, 2018.
each natural resource, along with the commodity price increase in each period, as a share of GDP. It allows to assess the order of magnitude of the natural resource rents for each country and for each period. Other authors, e.g., Bunte (2016) and Behzadan et al. (2017), also refer to this variable to capture Dutch disease, however using it to argue that high inequality exacerbates Dutch disease effects.
Figure 4 – Natural resource rents in Latin American, South American and Central American countries and Mexico
(average) (% of GDP), 1997 - 2015 1997199819992000200120022003200420052006200720082009201020112012201320142015 0.0 2.0 4.0 6.0 8.0 10.0 12.0
Latin American countries South American countries
Central American countries and Mexico
Source: Own elaboration. Data from World Bank, Development Research Group; Accessed on June 7, 2018; Available at http://databank.worldbank.org/.
Figure 4 shows the increase of natural resource rents (% of GDP) in Latin American countries, especially in South American countries, which mostly applies to commodity exporters and that are more sensitive to fluctuation in commodity prices (Messina & Silva, 2017). The increase in Latin American countries natural resource rents, driven by South Latin American countries, was verified mainly
from 2001 to 2006, but stayed rather high until 2011, when it started the downward trend. It is expected that this movement is responsible for the decrease of the income inequality, namely through the spending effect channel, which may benefit more the unskilled than the skilled workers in the non-tradable sector (Goderis & Malone, 2011; Steinberg, 2017; Guerra-Salas, 2017; Messina & Silva, 2017). The Central American countries and Mexico natural resource rents stayed rather stable during the commodity boom in the 2000s, thus the decrease of the income inequality in these countries is, presumably, due other factors, and not to Dutch disease effects.
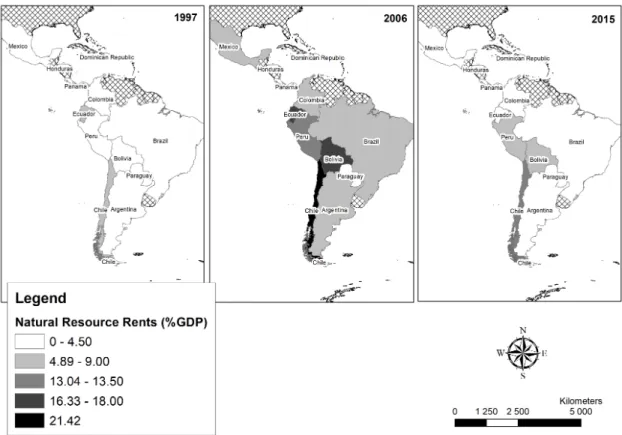
Figure 5 – Map of natural resource rents (% of GDP) in Latin American countries: 1997, 2006 and 2015
Source: Own elaboration. Data from World Bank, Development Research Group; Accessed on June 7, 2018; Available at http://databank.worldbank.org/.
Figure 5 compares natural resource rents (% of GDP) across countries before (1997), during (2006) and after (2015) the
commodity price boom. Among the South American countries, Bolivia, Chile, Ecuador and Peru deserve mention, exhibiting the largest levels of natural resource rents during the boom. Mexico presents a similar trend alongside some South American countries, as Argentina Brazil and Colombia. In turn, among South American countries, Paraguay does not show a relevant variation in natural resource rents.
To analyse the income inequality downward trend in Latin America in the 2000s, De La Torre et al. (2017) divide countries into two groups, net commodity-exporters and net commodity-importers. Thus, the rise in commodity prices during the 2000s benefits exporters, while it may even harm the commodity-importers (De La Torre et al., 2017). De La Torre et al. (2017) argue that the former group experienced a stronger downward trend in income inequality, suggesting that the effect on the commodity prices benefited only the net commodity-exporting countries. Thus, Dutch disease may arise in countries which benefit more from the rise in commodity prices, i.e., in net commodity-exporters. Thereby, we also test the effects of the ores, metals and fuels (OMF) exports (in percentage of GDP), which we expect to capture the impact of the commodity trade in the economy. This dataset is constructed from several datasets: ores, metals and fuels exports in total of merchandise exports, total merchandise exports (current US$), and GDP (current US$), all of them taken from World Development Indicators (WDI), World Bank.16 The higher this variable is, the more relevant is the impact of commodity exports (composed by commodity price and export amount) as a share of GDP. Therefore, the higher this variable is, the lower will be income inequality, according to the Dutch disease effects.
16 Available at http://databank.worldbank.org/data/source/world-development-indicators/, accessed on June 7, 2018.
Figure 6 – Ores, metals and fuels exports (% of GDP) and manufactures exports (% of GDP) in South American countries and in Central American countries and Mexico (average), 1997
- 2015 1997199819992000200120022003200420052006200720082009201020112012201320142015 0.0 5.0 10.0 15.0 20.0 25.0
OMF exports (% of GDP) in South American countries
OMF exports (% of GDP) in Central American countries and Mexico Manufactures exports (% of GDP) in South American countries
Manufactures exports (% of GDP) in Central American countries and Mexico
Source: Own elaboration. Data from World Bank, Development Research Group; Accessed on June 7, 2018; Available at http://databank.worldbank.org/.
Figure 6 shows that the South American countries exhibit an increase in the exports of commodities and a decrease in the exports of manufactures. The reverse trend is observed in Central American countries and Mexico, which present an increase of the manufactures exports, in contrast with an almost constant commodity exports. This suggests the Dutch disease effects only in South American countries.
The commodity price boom may improve the terms of trade and, through the spending effect and the real exchange rate appreciation that leads to labour shifts from tradable to non-tradable sector, reduce wage inequality (Messina & Silva, 2017). As the spending effect was driven by positive terms of trade improvement in South Latin American countries (Messina & Silva, 2017), we test the
effect of the net barter terms of trade index (1997=100), from United Nations Conference on Trade and Development, Handbook of Statistics and data files, and International Monetary Fund, International Financial Statistics, available in World Development Indicators (WDI), World Bank.17 This variable is computed as the percentage ratio of the export unit value indexes to the import unit value indexes. We expect that the higher the terms of trade are, the lower will be income inequality.
Finally, we use employment in services (as percentage of total employment) as a proxy for the spending effect. The rationale relies on the dominance of the spending effect against the resource movement effect, thus it is expected labour shifts from tradable to non-tradable sector. It likely leads to a rise in the employment in the services sector relatively to other sectors, and then, to an income inequality decrease if the non-tradable sector is lower-skilled labour intensive, or if interfirm wage differentials are lower, than in the tradable sector (Messina & Silva, 2017). Data on employment in services (% of total employment) is taken from International Labour Organization, ILOSTAT database, available in World Development Indicators (WDI), World Bank.18
17 Available at http://databank.worldbank.org/data/source/world-development-indicators/, accessed on June 7, 2018.
18 Available at http://databank.worldbank.org/data/source/world-development-indicators/, accessed on June 7, 2018.
Figure 7 – Employment in services (% of total employment) in South American countries and in Central American countries
and Mexico (average), 1997 - 2015
1997199819992000200120022003200420052006200720082009201020112012201320142015 48.0 50.0 52.0 54.0 56.0 58.0 60.0 62.0 64.0
Employment in services in South American countries
Employment in services in Central American countries and Mexico
Source: Own elaboration. Data from World Bank, Development Research Group; Accessed on June 7, 2018; Available at http://databank.worldbank.org/.
Figure 7 shows that employment in services increases in both groups of countries. However, the larger increase occurred in the South American countries since 2002; this may be due Dutch disease effects (spending effect) which decreases manufactures exports and increases employment in services.
Per capita gross domestic product (GDPpc)
In order to capture (and test) the Kuznets theory of the inverted “U-shaped” curve hypothesis (Kuznets, 1955), we include both the logarithm of the gross domestic product (GDP) per capita and the squared logarithm of GDP per capita as control variables. GDP per capita is expressed in constant 2011 international dollars (PPP) as available in World Bank, International Comparison Program
database, collected from World Development Indicators (WDI).19 The (log) of GDP per capita is a standard determinant of inequality in the literature; e.g., Milanovic (1994), Barro (2000) and Goderis & Malone (2011) also include this variable (though the latter do not include the squared variable).
Schooling
General access to schooling may lead to an increase in the supply of skills and reduce income inequality (Acemoglu & Robinson, 2002). De La Torre et al. (2017) explain that, if the labour demand remains unchanged, changes in the quality of labour supply (as more educated workers, for example) lead to changes in education premium. Since more educated workers are likely to be more skilled (Acemoglu, 1999), the education premium may be a proxy of the skill premium (De La Torre et al., 2017). The changes in the skill premium, driven by the increase in the supply side of labour markets (as of more educated workers), was an important, but not an exclusive20, explanation for the declining of the wage inequality in Latin America in 2000s (Lustig et al., 2013; De La Torre et al., 2017; Messina & Silva; 2017).
Educational variables are commonly used in studies about inequality. For example, Barro (2000) uses average years of school attainment for adults aged 15 and over at three levels: primary, secondary, and higher education. According to the author’s results, primary and secondary education are negatively related to inequality, even though the latter is not significant, while high education is positively and significantly related to inequality. In turn, Goderis & Malone (2011) use the average years of primary schooling of the 19 Available at http://databank.worldbank.org/data/source/world-development-indicators/, accessed on June 7, 2018.
20 Beyond the supply side, the influence of the demand side of the labour markets seems to have reduced the demand for skilled relative to unskilled workers and, together with institutional factors (such as minimum wage policy and unionization) both explain the downward trend of wage inequality in Latin American countries in the 2000s (Lustig et al., 2013; De La Torre et al., 2017; Messina & Silva; 2017).
population aged 15 and over as a control variable to estimate the long-run effects of Dutch disease on income inequality. Milanovic (1994) and Howie & Atakhanova (2014) use the average years of education as a schooling variable, even though the former replaces this variable by an income variable in the final model due to strong collinearity between education and income.
As a schooling control variable, we test the average years of education from the share of adults aged 25 to 65 in each year of education and primary completion rates (share of youths aged 15-24 with a primary school degree), all data available in Socio-Economic Database for Latin America and the Caribbean (SEDLAC),
Universidad Nacional de la Plata (CEDLAS) and World Bank.21 The average years of education capture the evolution of the educational level in the country. The higher the number of more educated people is and the lower the number of less educated people, the higher is the average years of education and, thus the larger is the supply of skilled workers, lowering the skill premium, and, consequently, income inequality. In turn, primary completion is a variable that assesses the evolution of the less educated youths. The advantage of this variable is the low correlation with GDP per capita while still capturing educational level. The larger primary completion rate is, the lower will be income inequality.
Unemployment
We also use as a control variable, the unemployment rate taken from World Development Indicators, World Bank, whose source is from International Labour Organization, ILOSTAT database.22 This indicator refers to the share of the labour force that is without work but available for and seeking for a job.
21 Available at http://www.cedlas.econo.unlp.edu.ar/wp/en/estadisticas/, accessed on June 8, 2018.
22 Available at http://databank.worldbank.org/data/source/world-development-indicators/, accessed on June 7, 2018.