R E S E A R C H
Open Access
Gender, planning, and academic
expectations in first-year higher education
students: testing two alternative mediation
models
Sonia Alfonso
1*, António M. Diniz
2, Manuel Deaño
1, Fernando Tellado
1, Mar García-Señorán
1,
Ángeles Conde
1and Valentín Iglesias-Sarmiento
1Abstract
We examined the relationships among gender, planning, and academic expectations through the testing of two alternative models with latent variables tested with LISREL 8.80: one model considered planning as a mediator of the relationship between gender and academic expectations, and the other model considered academic
expectations as mediators of the relationship between gender and planning. Participants were 662 first-year higher-education students from two academic years, predominantly female (60%) and mainly with majors in the juridical-social field (66.2%). The Inventario sobre Estrategias Metacognitivas (IEM; Inventory of Metacognitive Strategies) and the Academic Perceptions Questionnaire (APQ) were applied at the beginning of the first semester to assess planning and academic expectations, respectively. Multigroup confirmatory factor analysis was used to test the IEM’s structure after examining its psychometric properties with the sample from the first academic year (N = 338). The test of the alternative mediation models with the full sample indicates that the best model was that with planning as a mediator. In this model, gender directly predicted only two APQ academic expectations, but with the mediation of planning, gender predicted all seven academic expectations. Women showed higher levels of
academic expectations and planning than did men. The results are discussed at both the theoretical and practical levels.
Keywords: College students, Planning, Academic expectations, Gender, Structural equation modeling, Measurement invariance
Introduction
It is well known that gender explains in a distinctive way learning-related perceptions and behaviors of higher-education (HE) students, namely, regarding planning and academic expectations (AEs).
Planning has been defined as a hierarchical process that can control the order in which one performs a se-quence of operations. The process of controlling one’s
actions as a function of purpose requires seeking the problem to be solved, generating and selecting the ap-propriate strategies to solve it, and executing and check-ing a sequence of planned actions; in other words, it requires cognitive planning (Das & Misra, 2015). This planning, viewed as an executive function (Best, Miller, & Naglieri,2011), is linked to the ability to guide behav-ior by formulating strategies and sequential plans of ac-tion and the ability to change plans whenever the situation requires (Naglieri & Otero,2014).
Through the effect of multiple moderator variables such as cognitive, cultural, and contextual factors, © The Author(s). 2020 Open Access This article is licensed under a Creative Commons Attribution 4.0 International License, which permits use, sharing, adaptation, distribution and reproduction in any medium or format, as long as you give appropriate credit to the original author(s) and the source, provide a link to the Creative Commons licence, and indicate if changes were made. The images or other third party material in this article are included in the article's Creative Commons licence, unless indicated otherwise in a credit line to the material. If material is not included in the article's Creative Commons licence and your intended use is not permitted by statutory regulation or exceeds the permitted use, you will need to obtain permission directly from the copyright holder. To view a copy of this licence, visithttp://creativecommons.org/licenses/by/4.0/.
* Correspondence:[email protected]
1Department of Evolutionary Psychology, Faculty of Education Sciences,
University of Vigo, Campus As Lagoas, 32004 Ourense, Spain Full list of author information is available at the end of the article
gender differences were observed in HE students’
plan-ning (Voyer & Voyer, 2014; Wang & Degol, 2017):
women performed better than men in language, atten-tion, control, and effort in academic tasks, regardless of the area of study (social or mathematical and science), which involves not only a higher level of planning but also academic success.
AEs are defined as a set of representations about what HE students expect to do during their academic life
(Deaño et al., 2015) through an interpretation of their
HE experiences, in line with past experiences (Cole,
Kennedy, & Ben-Avie,2009). These AEs code HE
expe-riences and academic knowledge (Howard, 2005; Kuh,
Gonyea, & Williams, 2005; Soares, Guisande, Diniz, &
Almeida, 2006), which, according to the interest and
motivations of the students, is recoded and designed for new situations.
Gender differences were observed in AEs. Some stud-ies (e.g., Sax, Bryant, & Harper,2005) have highlighted a greater emotional dependence of women on their fam-ilies than of men, which can make it difficult for the former to participate in classroom activities and in inter-actions with their classmates and teachers. Other studies (Sax & Harper,2007; Wang & Degol,2017) have pointed out greater aspirations in women than in men regarding social interaction and involvement in aid actions to others, while men seem to show higher levels of leader-ship, with higher aspirations to participate in student committees, politics, and association activities. Within a
multidimensional view of AEs (Diniz et al., 2018), men,
more than women, show aspirations to achieve stable and prestigious future employment, develop autonomy and self-confidence, study abroad, participate in commit-tees, and comply with the expectations of family mem-bers regarding the time spent working and career success.
HE students create and execute plans that generate ex-pectations of thinking and action about their goals and the best way to achieve them. Planning regulates stu-dents’ thinking and actions about their goals and
inter-ests (Rodriguez, 2009; Wang, Spencer, & Xing, 2009).
Therefore, AEs can be considered drafts of plans that students confront with reality (Das & Misra,2015), and based on them, students readjust and modify them, fi-nally consolidating action plans operationalized in mani-fest conduct. In this sense, planning can be expected to predict the AEs of students when solving problems within the academic context.
Otherwise, cognitive planning as an executive function (Best et al.,2011; Das & Misra,2015) can be considered a metacognitive mechanism underlying students’ beliefs. These beliefs generate life plans and concrete actions to ful-fill goals and interests (Biggs, 1987; Schraw & Moshmam, 1995); thus, AEs can be viewed as predictors of planning.
According to Tinto (1987), students’ expectations about HE calibrate their levels of academic and social commitment to the institution, favoring their integra-tion. In accordance with this position, AEs are consid-ered a set of cognitions and motivations, translated from the perceptions and aspirations that accompany stu-dents’ experiences in the academic context (Howard, 2005; Konings, Brand-Gruwel, van Merrienboer, & Broers,2008).
Accordingly, with this multidimensional conception of AEs, Almeida et al. (2018), Deaño et al. (2015), and Diniz et al. (2018) found seven dimensions of expecta-tions that students bring with them when they reach HE. Students have expectations about training for em-ployment, personal and social development, student mo-bility, political/citizen involvement, social pressure, the quality of training, and social interaction. These dimen-sions were obtained through a multigroup confirmatory factor analysis (CFA), and they seem to support a multi-faceted and multidimensional concept across gender and nationality (Diniz et al.,2018).
Current study
All the relationships among the previously mentioned variables, gender, planning, and AEs, are established in the literature. However, to the best of our knowledge, the relationships among these three variables have never been examined altogether.
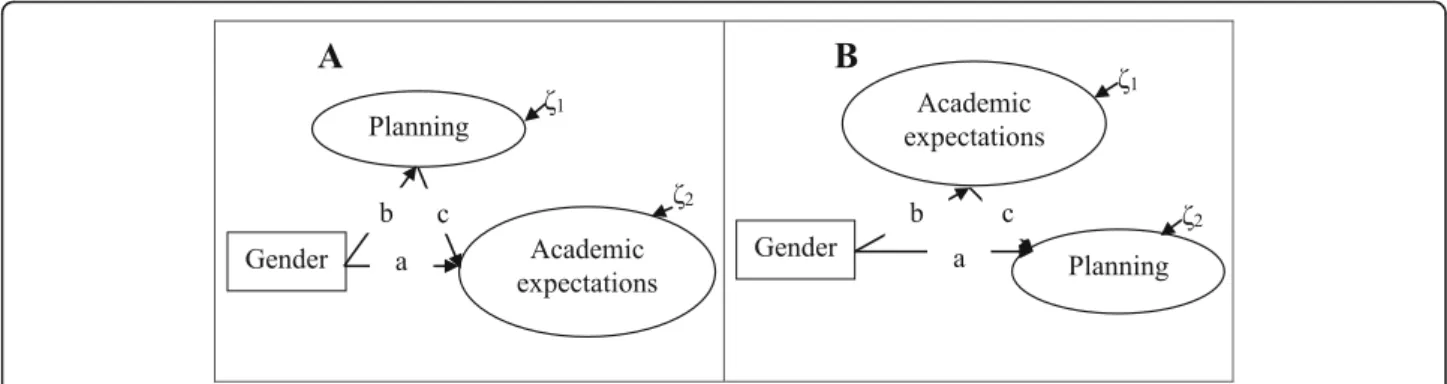
Accordingly, the goal of this study is to examine the relationships among gender, planning, and AEs through the assessment and comparison of the two alternative mediation models with latent variables represented in Fig.1A, B to choose the more plausible model. Subsidi-arily, the test of these models can clarify the nuance of planning being viewed as a predictor of AEs (Rodriguez, 2009; Wang et al.,2009) or AEs being viewed as
predic-tors of planning (Biggs, 1987; Schraw & Moshmam,
1995) found in the literature review.
The use of structural equation modeling (SEM) is ap-propriate to fulfill this goal, allowing for the simultan-eous testing of the relationships among these three variables in a mediation model (Iacobucci, Saldanha, &
Deng,2007). Furthermore, through their examination in
the selected model (Fig.1A, B), it is possible to see if the mediation effect or, in other words, the indirect effect between the observed predictor and the latent criterion makes a significant contribution to the total effect. Method
Participants
A convenience sample of 662 voluntary Spanish first-year HE students (age range = 17–23 first-years, Mdn = 18), mostly composed of women (60.0%, n = 397), was used for this study. Participants were selected in two
consecutive academic years: sample 2014/15 (n = 338, age range = 17–23 years, Mdn = 18) and sample 2015/16 (n = 324, age range = 17–23 years, Mdn = 18), who attended HE for the first time. As a function of the study area, most of the students (66.2%) were enrolled in de-grees in the juridical-social field, and the rest were in the scientific-technological field. No association was found between study area and academic years,χ2(1, N = 662) = 1.10, p = .295, or between gender and academic years, χ2
(1, N = 662) = 3.28, p = .073.
Materials and procedure
Students’ planning was operationalized through the “Inventario sobre Estrategias Metacognitivas” (IEM; Metacognitive Strategies Inventory; Martínez-Fernández, 2004, 2007), a Spanish adaptation of the Reduced Re-vised State Metacognitive Inventory (RRSMI; O’Neil &
Abedi, 1996). Participants were asked what they do or
think when they face a learning activity or problem. The structure of the 20 IEM items, rated on a Likert-type scale ranging from one (never) to five (always), was examined with a sample of college students through maximum likelihood (ML) exploratory factor analysis (oblique rotation), showing a bifactorial model. These factors, each with 10 items, were named planning (e.g.,
item 9:“You are aware of the need to plan your course
of action”) and self-checking (e.g., item 2: “You check your work while you are doing it”) and presented, re-spectively, alpha values of .80 and .82. However, the fac-tors presented a very high correlation (.71), and the author did not test an alternative unifactorial model.
Students’ AEs were operationalized using the final version
of the “Cuestionario de Percepciones Académicas (CPA):
Versión Expectativas” (Deaño et al.,2015), named the Eng-lish Academic Perceptions Questionnaire (APQ; Almeida
et al., 2018). The APQ has seven factors, each with six
items rated on a Likert-type scale ranging from one (strongly disagree) to six (strongly agree): training for
employment (TE), referring to the conditions of obtaining training to obtain better jobs or enter into the working world (e.g., item 15:“Obtain training to obtain a good job”); personal and social development (PSD), which includes au-tonomy, self-confidence, critical thinking, and personal im-provement through new experiences of academic life (e.g.,
item 16:“Use academic opportunities to improve my
iden-tity, autonomy and self-confidence”); student mobility (SM), linked to the attitude of carrying out part of the stud-ies in international mobility programs, internships or jobs abroad (e.g., item 24: “Obtain international-quality train-ing”); political engagement and citizenship (PEC), which re-flects the desire to engage in the political, social, and economic life of the country, to understand how to help improve it, and to participate in specific associative or vol-unteer activities (e.g., item 25:“Participate in volunteer ac-tivities”); social pressure (SP), which includes the items referring to the desire to respond to parents' expectations
or to please significant others (e.g., item 5: “Meet my
family’s expectations”); quality of education (QE), linked to feeling challenged to deepen one's knowledge and having the personal and material means to stimulate it (e.g., item 13:“Deepen my knowledge of specific subjects”); and social interaction (SI), which includes the will to enjoy some mo-ments of conviviality and fun, dedicating a scheduled weekly time to these activities, different from the study time, which may entail a relationship with classmates (e.g., item 28:“Attend university student parties”).
Regarding the APQ’s psychometric properties,
Almeida et al. (2018, Table2) showed that factors’
con-vergent validity (CV) and discriminant validity (DV) and its composite reliability (CR) (Fornell & Larcker, 1981) were suitable across countries and genders.
Procedure Data collection
Students (initial sample, N = 669) were selected to en-sure the heterogeneity of the major subjects. Data were Fig. 1 Alternative mediation models. Conceptual diagrams for planning as mediator in A and for academic expectations as mediators in B. a = direct effect of the observed predictor (OP) on the latent criterion (LC); b = direct effect of the OP on the latent mediator (LM); c = direct effect of the LM on the LC; b × c = indirect effect of the OP on the LC; a + (b × c) = total effect;ζ = structural residuals, random disturbances, or amount of mediators (ζ1) and criteria’s (ζ2) variance not accounted by predictor(s)
collected at the beginning of the first semester in the classroom after obtaining teachers’ permission and stu-dents’ informed consent. Students who attended HE in previous academic years left the classrooms. The instru-ments were administered in a counterbalanced way. Seven students were excluded from the sample due to incomplete data (gender variable = 4; IEM protocol = 3).
Data analysis
IBM SPSS Statistics for Windows (version 21.0) was used for descriptive data analysis, and LISREL 8.80
(Jör-eskog & Sörbom, 2006) was used for model estimation
and testing.
Given the ordinal categorical nature of the data, ana-lyses were performed using the underlying bivariate
nor-mal approach (Jöreskog, 2005). PRELIS 2 (Jöreskog &
Sörbom, 1996) produces the polychoric covariance
matrix of the underlying latent continuous and normal counterparts of items’ observed responses, the respective asymptotic covariance matrix, and the vector means of the latent responses. They were taken as input for model estimation and testing with the robust Satorra-Bentler (SB) scaled correction (Satorra & Bentler, 1994) in
LIS-REL 8.80 (Jöreskog & Sörbom,2006) using the SIMPLIS
command language (Jöreskog & Sörbom, 1993). Factor
measurement units were assigned by fixing the path of one of their items to one.
Models’ fit to the data were examined through the fol-lowing practical goodness-of-fit (GOF) indices and rec-ommended cutoff values (Hu & Bentler,1998): the root mean square error of approximation (RMSEA; values close to or below .06), the standardized root mean square residual (SRMR; values close to or below .08), and the comparative fit index (CFI; values close to or above .95). The expected cross validation index (ECVI; Browne & Cudeck,1993) was also used for the
compari-son of the two alternative mediation models in Fig. 1;
the model with lower ECVI should be chosen.
Following a two-step modeling approach (Jöreskog &
Sörbom,1993), the mediation models presented in Fig.1
were only tested after the assessment of the structural validity of the IEM model.
First, a confirmatory factor analysis (CFA) was per-formed with the 2014/15 sample. The obtained ML completely standardized estimates allowed for the examination of IEM factors’ CV, DV, and CR (Fornell
& Larcker, 1981). CV was examined through items’
average variances extracted (AVEs), which should be at least .50. DV was assessed by comparing factors’
shared variance (φ2
= squared disattenuated correl-ation) and AVE of each compared factor: DV should be lower than AVE. A factor reliability of .80 is recommended for group comparisons (Nunnally & Bernstein, 1994).
Second, the resulting factorial solution was tested through a multigroup cross-sectional measurement in-variance analysis, using both the 2014/2015 and the 2015/2016 samples. It typically starts with the testing of the form-invariant model, where all parameters are freely estimated across groups, followed by the testing of more stringent equality conditions, specifically weak, strong, and strict invariance (the latter compares with
the former) (Meredith, 1993). Under weak invariance,
factor loadings are equal across groups. Under strong in-variance, factor loadings and intercepts (item values cor-responding to the zero value of the factor) are equal across groups. To ensure construct comparability across samples, strong invariance is a sufficient criterion. How-ever, to complete the study of measurement invariance, strict invariance was also examined. In strict invariance, factor loadings, intercepts, and residual (item-specific factor plus random error) variances are equal across groups. Finally, a model can also be partially invariant, indicating differential item functioning (Byrne, Shavel-son, & Muthén,1989).
Comparisons between baseline models (with parame-ters unconstrained for all groups; smaller df) and re-stricted models (with specific parameters constrained to be equal across groups; larger df) were based on the dif-ference (Δ) between models’ CFI and, subsidiarily, on GOF statistics. The cutoff value of .01 was used for the ΔCFI results (Cheung & Rensvold,2002).
Finally, the two alternative mediation models with la-tent variables (see Fig.1) were tested using the full sam-ple. After the selection of the model with better ECVI, the following expression, based on the difference be-tween its total and direct effects (unstandardized), was
applied: Δz = total effect − direct effect/root square
[(SE2(total effect) + SE2(direct effect))/2]. If the value of the
test statistic Δz was higher than 1.96, p < .05, then it means that the contribution of the indirect effect to the total effect was significant.
Results
With the 2014/15 sample, the test of the IEM bifactorial oblique model showed good fit to the empirical data (SBχ2
= 305.788, df = 169, RMSEA = .049, 90% CI [.040, .058], SRMR = .057, CFI = .983). However, substantively, the solution was inacceptable because of the very high shared variance (φ2
= .85), indicating major DV prob-lems, for example, between-factor collinearity. Thus, the 20 items must be collapsed into a single factor, as should have been done in the IEM’s validation study (see Materials and procedure).
This alternative unifactorial model, with slightly worse GOF results than the bifactorial oblique model but more substantively verisimilar, also showed a good fit (SBχ2
= 318.430, df = 170, RMSEA = .051, 90% CI [.042, .060],
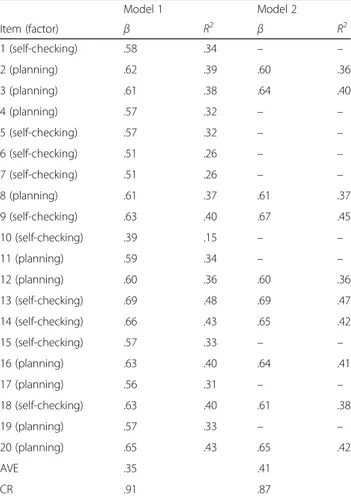
SRMR = .058, CFI = .981). However, as seen in Table1 (M1), despite its very good reliability (CR), its VME re-vealed an excessive lack of CV.
To achieve a more acceptable CV, the 10 items with
lower R2were excluded, and the model (Table1, M2) fit
well to the data (SBχ2
= 43.235, df = 35; RMSEA = .026, 90% CI [.000, .050], SRMR = .040; CFI = .997), with very good CR, as in M1, but still not a good VME. The exclu-sion of more items could improve the factor’s CV, but achieving the desired AVE value would not be easy (e.g., VME = .43, excluding items 2, 8, 12, and 18). Thus, this 10-item solution represents an acceptable tradeoff be-tween statistical results and factor content heterogeneity. The factor, with six items from the IEM bifactorial ob-lique model related to planning and four items related to self-checking, was named planning, corresponding to a derivation based on theory and empirical results that point out that self-checking is interconnected with plan-ning (Das & Misra,2015).
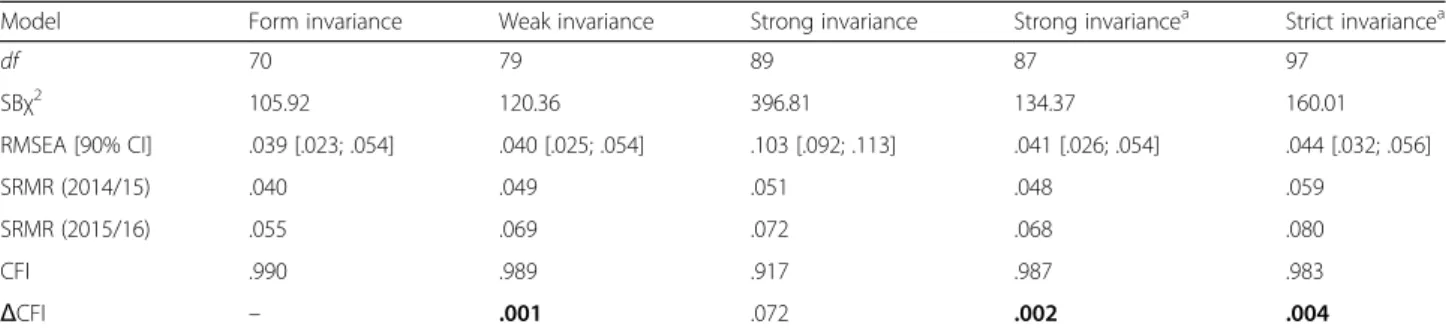
This alternative 10-item IEM unifactorial model did not show strong invariance, presenting an inadmissible
ΔCFI result (Table 2, see also RMSEA). However, the
model was partially and strongly invariant across sam-ples because the intercepts of items 2 and 12 were higher in the 2015/16 sample (item 2 = 1.97 vs. 1.32 in the 2014/15 sample; item 12 = 2.73 vs. 1.68 in the 2014/ 15 sample). Nevertheless, those items belong to the same
category of content (Table 1), and using an
interpret-ation in terms of item response theory (Ferrando,1996),
the noninvariance of intercepts does not signal different levels of items ambiguity but simply different levels of item attractiveness between the samples. Therefore, this lack of intercept equivalence did not change the mean-ing of the factor across samples because weak invariance was achieved. The partially and strongly invariant model had good fit to the empirical data, and partial strict
in-variance was then tested and achieved (Table2).
Overall, the psychometric properties of the 10-item
IEM unifactorial model (Table 1) and its equivalence
across samples (Table 2) indicated that it could be used
to test the alternative mediation models represented in Fig.1using the full sample of this study.
The results of this test showed that the model
repre-sented in Fig.1A was more plausible (better GOF
statis-tics, specifically, a lower ECVI) than its competitor
(Table 3) and was the model selected for further
analysis.
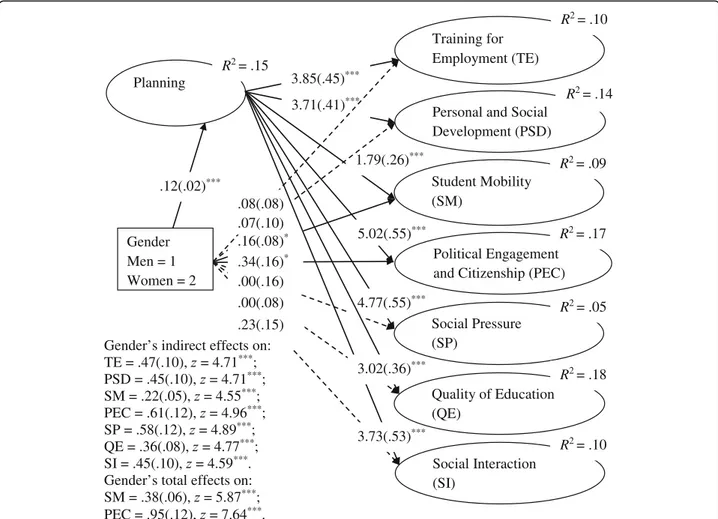
Figure2shows that all the indirect structural paths of the model were statistically significant: women showed higher levels of AEs than men. Interestingly, the gender predictive relationships of TE, PSD, SP, QE, and SI were only observed through the mediation of planning (“complete mediation”; Iacobucci et al.,2007). Moreover, the predictive relation of students’ planning and AEs was weaker for SM and stronger for the other dimen-sions, especially for PEC and SP. Moreover, according to Cohen’s (1988) taxonomy, the effect size (R2
) of gender on AEs was small on SP; small to medium on SM, TE, and SI; and medium on PSD, PEC, and QE.
Finally, for the two criteria where the direct and indir-ect effindir-ects of gender were simultaneously significant (“partial mediation”; Iacobucci et al., 2007), the results pointed out a difference between the total effect and the direct effect of gender on both SM (Δz = 3.11, p = .002) and PEC (Δz = 4.31, p < .001). The observed significant differences indicate that the mediation of planning sig-nificantly amplified these gender predictive relationships, mainly on PEC.
Discussion
The literature reviewed in this study was conducted with the following main goal: to test the relationships among gender, planning, and AEs, considering the construct of
Table 1 IEM unifactorial model in the 2014/2015 sample: completely standardized maximum likelihood estimates, average variance extracted, and composite reliability
Model 1 Model 2 Item (factor) β R2 β R2 1 (self-checking) .58 .34 – – 2 (planning) .62 .39 .60 .36 3 (planning) .61 .38 .64 .40 4 (planning) .57 .32 – – 5 (self-checking) .57 .32 – – 6 (self-checking) .51 .26 – – 7 (self-checking) .51 .26 – – 8 (planning) .61 .37 .61 .37 9 (self-checking) .63 .40 .67 .45 10 (self-checking) .39 .15 – – 11 (planning) .59 .34 – – 12 (planning) .60 .36 .60 .36 13 (self-checking) .69 .48 .69 .47 14 (self-checking) .66 .43 .65 .42 15 (self-checking) .57 .33 – – 16 (planning) .63 .40 .64 .41 17 (planning) .56 .31 – – 18 (self-checking) .63 .40 .61 .38 19 (planning) .57 .33 – – 20 (planning) .65 .43 .65 .42 AVE .35 .41 CR .91 .87
Factor factor name in the IEM bi-factorial oblique model,β factor loading, R2
(communality) = 1− ε (standardized residual), AVE average variance extracted, CR composite reliability
planning as a predictor of AEs, or vice versa. The result of the testing of two mediation models with gender as a
predictor showed that the model represented in Fig.1A,
with planning as a mediator, was more plausible than its
competitor, also represented in Fig.1B, with AEs as
me-diators. For this reason, the first model was chosen for further analysis.
The significance of all the predictive relations of plan-ning for AEs supports the idea that students who attended HE for the first time create, execute, and regu-late plans that generate expectations of thinking and
ac-tion about their goals and interests (Rodriguez, 2009;
Wang et al.,2009) more attached to the AEs of PEC and
SP and less to those of SM.
Another factor that could have conditioned the model’s functioning was gender since it is known that in
addition to impacting planning (Voyer & Voyer, 2014;
Wang & Degol, 2017), it also impacts expectations
(Diniz et al.,2018; Sax et al., 2005; Sax & Harper,2007; Wang & Degol,2017). In this study, gender had differen-tial direct and mediation effects on planning and AEs. The direct effect on planning, with women showing higher levels of planning than men, has been previously mentioned in the literature (Voyer & Voyer,2014; Wang
& Degol, 2017), but women showed higher levels than
men in AEs, and this result is opposed to the one previ-ously found in first-year Spanish and Portuguese stu-dents by Diniz et al. (2018), with data collected at the beginning of the second semester: men showed higher levels than women in five out of seven AEs (TE, PSD, SM, PEC, and SP). The authors argued that this result
was because women may have adjusted their initial ex-pectations. In addition, planning underlies these AEs’ changes since women present higher levels of self-checking and task planning than do men (Voyer & Voyer,2014; Wang & Degol, 2017). Another contradict-ory result is that Diniz et al. (2018) found gender differ-ences in five AEs, whereas in the present study, only the direct effect of gender on SM and PEC was observed. The other AEs (TE, PSD, SP, QE, and SI) were predicted through the mediation of planning (“complete medi-ation”; Iacobucci et al.,2007).
Overall, these different results lead to the educated guess that the timing when the measurement of AEs oc-curs (at the beginning of the studies or later on in the second semester) can determine the choice of one or an-other of the tested mediation models, as well as the dif-ferential impact of gender on AEs. In the current study, the best model was the one with planning as a mediator. If another measurement moment had been chosen, the model with AEs as mediators may have been the best because the readjusted students’ beliefs and expectations, driven by life experience in the academic context, could generate new life plans according to the reformulated goals and interests. This is an interesting issue to be fur-ther analyzed.
At a theoretical level, this study highlights the relation-ship between task action goals and first-year HE
stu-dents’ AEs (Kuh et al., 2005; Pleitz, MacDougall, Terry,
Buckley, & Campbell,2015; Tinto,1987). It supports the belief that metacognition is a high-level executive func-tion of the general domain, applicable to specific
do-mains, such as AEs (Rodriguez, 2009). At a practical
level, interventions focused on action planning and on work checking while doing so may have positive effects not only in the promotion of success in academic tasks (Das & Misra, 2015) but also on AEs, thus facilitating students’ adjustment to their new social and academic context.
Finally, considering the two AEs where the direct and indirect (i.e., through the mediation of planning) effects
Table 2 Measurement invariance of the 10-item IEM unifactorial model across 2014/2015 and 2015/2016 samples
Model Form invariance Weak invariance Strong invariance Strong invariancea Strict invariancea
df 70 79 89 87 97 SBχ2 105.92 120.36 396.81 134.37 160.01 RMSEA [90% CI] .039 [.023; .054] .040 [.025; .054] .103 [.092; .113] .041 [.026; .054] .044 [.032; .056] SRMR (2014/15) .040 .049 .051 .048 .059 SRMR (2015/16) .055 .069 .072 .068 .080 CFI .990 .989 .917 .987 .983 ΔCFI – .001 .072 .002 .004
Results in bold indicate between-samples equivalence
SB Satorra-Bentler, RMSEA root mean square error of approximation, SRMR standardized root mean square residual, CFI comparative fit index,Δ difference between baseline (smaller df) and restricted models (larger df)
a
Partial: items 2 and 12 with intercepts freely estimated across samples
Table 3 Fit indices of the two alternative mediation models
Model SBχ2(df) RMSEA [90% CI] CFI SRMR ECVI
Panel A 3839.326 (1311) .054 [.052; .056] .967 .090 6.17 Panel B 4363.638 (1311) .059 [.057; .061] .960 .190 6.97 ECVI expected cross-validation index, SB Satorra-Bentler, RMSEA root mean square error of approximation, SRMR standardized root mean square residual, CFI comparative fit index
of gender were simultaneously significant (“partial medi-ation”; Iacobucci et al.,2007), SM and PEC, the indirect effect amplified the gender impact on them. Strictly speaking, planning accentuates the discrepancy between women (higher levels) and men (lower levels) in these AEs, more notoriously in PEC.
Conclusions
In line with the results of the current study, interven-tion programs to enhance academic success in HE should focus on planning at the beginning of studies, especially for men. Furthermore, according to the re-sults of the current study and the study of Diniz et al. (2018), such programs should also address gen-der differences, focusing on all AEs, especially on PEC in women.
Despite the limitations in external validity due to the nonprobabilistic sampling procedure used in this study (its replication with other samples or, better, with a rep-resentative sample is desirable), some aspects related to
its internal validity guarantee that the statistical conclu-sions are reliable: the sample’s dimension, academic major heterogeneity, and the counterbalancing of instru-ments’ administration. Still related to this study’s in-ternal validity, the instrument used to operationalize
planning (IEM; Martínez-Fernández, 2004, 2007; O’Neil
& Abedi,1996) was modified at the structural and meas-urement levels to achieve acceptable structural validity. These changes are justifiable in statistical terms because an appropriate method for the analysis of models with ordinal variables was used: CFA with the SB scaled
cor-rection (Jöreskog, 2005), with multigroup measurement
invariance testing (Byrne et al., 1989; Cheung &
Rensvold, 2002; Jöreskog, 2005; Meredith, 1993), and
examination of CV, DV, and CR (Fornell & Larcker, 1981). The observed lack of DV between the IEM’s self-checking and planning factors can be explained because planning falls under Das and Misra’s (2015) conception of metacognitive control: self-checking is interconnected with planning.
Training for Employment (TE)
Personal and Social Development (PSD) R2 = .10 R2 = .14 Planning .12(.02)*** R2 = .15 3.85(.45)*** 3.71(.41)*** 1.79(.26)*** 5.02(.55)*** 4.77(.55)*** .0 .07 Gender Men = 1 Women = 2
Gender’s indirect effects on: TE = .47(.10), = 4.71***; PSD = .45(.10), = 4.71***; SM = .22(.05), = 4.55***; PEC = .61(.12), = 4.96***; SP = .58(.12), = 4.89***; QE = .36(.08), = 4.77***; SI = .45(.10), = 4.59***.
Gender’s total effects on: SM = .38(.06), = 5.87***;
PEC = .95(.12), = 7.64***.
Political Engagement and Citizenship (PEC)
R2 = .17 Student Mobility (SM) R2 = .09 3.73(.53)*** .23 Social Interaction (SI) R2 = .10 3.02(.36)*** Social Pressure (SP) Quality of Education (QE) R2 = .18 R2 = .05 * . 8(.08) (.10) .16(.08)* .00(.08) (.15) .34(.16) 00(.16)
Fig. 2 Model of the planning mediation effect on the predictive relationships between gender and academic expectations. Unstandardized robust maximum likelihood estimates for structural relationships. Standard errors are between parentheses. Dashed arrows = non-significant paths. *p < .05. ***p < .001
It is recommended for future research to test the model considering other predictors, such as temporal stability (e.g., beginning/end of the first semester) and sociodemographic characteristics (e.g., nationality). It would also be appropriate to analyze the model’s rela-tionships with academic results and assess cognitive planning with a task resolution battery or through the registration and analysis of conduct, rather than asses-sing planning through questionnaires. Finally, interven-tions on students’ cognitive planning are recommended to clarify whether it truly has a positive effect on AEs. Acknowledgements
We are thankful to all the participants in this study. Authors’ contributions
SA, AMD, MD, and VI-S for the literature review. SA, AMD, MD, MG-S, AC, FT, and VI-S for the material preparation. AC, MG-S, FT, and SA for the data col-lection. AMD and SA for the data analysis. SA, AMD, MD, VI-S, and AC for the results’ interpretation. SA and AMD for the writing of the manuscript. All authors read and approved the final manuscript.
Funding Not applicable.
Availability of data and materials
The datasets used and analyzed during the current study are available from the corresponding author on reasonable request.
Competing interests
The authors declare that they have no competing interests. Author details
1
Department of Evolutionary Psychology, Faculty of Education Sciences, University of Vigo, Campus As Lagoas, 32004 Ourense, Spain.2Department of
Psychology, Research Center in Education and Psychology, School of Social Sciences, Colégio Pedro da Fonseca, PITE - Parque Industrial e Tecnológico de Évora, University of Évora, Rua da Barba Rala, 7000 Évora, Portugal.
Received: 17 October 2019 Accepted: 1 April 2020
References
Almeida, L. S., Deaño, M., Araújo, A. M., Diniz, A. M., Costa, A. R., Conde, Á., & Alfonso, S. (2018). Equivalencia factorial de las versiones en español y portugués de un cuestionario de expectativas académicas. Revista Latinoamericana de Psicología, 50, 9–20.https://doi.org/10.14349/rlp.2018.v50. n1.2.
Best, J. R., Miller, P. H., & Naglieri, J. A. (2011). Relations between executive function and academic achievement from ages 5 to 17 in a large, representative national sample. Learning and Individual Differences, 21, 327– 336.https://doi.org/10.1016/j.lindif.2011.01.007.
Biggs, J. B. (1987). The Learning Process Questionnaire (LPQ): Manual. Hawthorn: Australian Council for Educational Research.
Browne, M. W., & Cudeck, R. (1993). Alternative ways of assessing model fit. In K. A. Bollen, & J. S. Long (Eds.), Testing structural equation models, (pp. 136–162). London: SAGE.
Byrne, B. M., Shavelson, R. J., & Muthén, B. (1989). Testing for the equivalence of factor covariance and mean structures: The issue of partial measurement invariance. Psychological Bulletin, 105, 456–466. https://doi.org/10.1037/0033-2909.105.3.456.
Cheung, G. W., & Rensvold, R. B. (2002). Evaluating goodness-of-fit indexes for testing measurement invariance. Structural Equation Modeling, 9, 233–255.
https://doi.org/10.1207/S15328007SEM0902_5.
Cohen, J. (1988). Statistical power analysis for the behavioral sciences, (2nd ed., ). Hillsdale: Erlbaum.
Cole, J. S., Kennedy, M., & Ben-Avie, M. (2009). The role of precollege data in assessing and understanding student engagement in college. New Directions for Institutional Research, 141, 55–69.https://doi.org/10.1002/ir.286. Das, J. P., & Misra, S. B. (2015). Cognitive planning and executive functions:
Applications in education and management. New Delhi: Sage.
Deaño, M., Diniz, A. M., Almeida, L. S., Alfonso, S., Costa, A. R., García-Señorán, M., … Tellado, F. (2015). Propiedades psicométricas del Cuestionario de Percepciones Académicas para la evaluación de las expectativas de los estudiantes de primer año en Enseñanza Superior. Anales de Psicología, 31, 280–289.https://doi.org/10.6018/analesps.31.1.161641.
Diniz, A. M., Alfonso, S., Araújo, A. M., Deaño, M., Costa, A. R., Conde, Á., & Almeida, L. S. (2018). Gender differences in first-year college students’ academic expectations. Studies in Higher Education, 43, 689–701.https://doi. org/10.1080/03075079.2016.1196350.
Ferrando, P. J. (1996). Calibration of invariant item parameters in a continuous item response model using the extended LISREL measurement submodel. Multivariate Behavioral Research, 31, 419–439.https://doi.org/10.1207/ s15327906mbr3104_2.
Fornell, C., & Larcker, D. F. (1981). Evaluating structural equation models with unobservable variables and measurement error. Journal of Marketing Research, 18, 39–50.https://doi.org/10.2307/3151312.
Howard, J. A. (2005). Why should we care about student expectations? In T. E. Miller, B. E. Bender, J. S. Schuh, & Associates (Eds.), Promoting reasonable expectations: Aligning student and institutional views of the college experience, (pp. 10–33). San Francisco: Jossey-Bass/National Association of Student Personnel Administrators.
Hu, L., & Bentler, P. M. (1998). Fit indices in covariance structure modeling: Sensitivity to underparametrized model misspecification. Psychological Methods, 3, 424–453.https://doi.org/10.1037/1082-989X.3.4.424. Iacobucci, D., Saldanha, N., & Deng, X. (2007). A meditation on mediation:
Evidence that structural equations models perform better than regressions. Journal of Consumer Psychology, 17, 139–153. https://doi.org/10.1016/S1057-7408(07)70020-7.
Jöreskog, K. G. (2005). Structural equation modeling with ordinal variables using LISREL. Retrieved fromhttp://www.ssicentral.com/lisrel/techdocs
Jöreskog, K. G., & Sörbom, D. (1993). LISREL 8: Structural equation modeling with the SIMPLIS command language. Chicago: Scientific Software International. Jöreskog, K. G., & Sörbom, D. (1996). PRELIS 2: User’s reference guide. Chicago:
Scientific Software International.
Jöreskog, K. G., & Sörbom, D. (2006). LISREL 8.80 for Windows [Computer software]. Chicago: Scientific Software International.
Konings, K. D., Brand-Gruwel, S., van Merrienboer, J. J., & Broers, N. J. (2008). Does a new learning environment come up to students’ expectations? A longitudinal study. Journal of Educational Psychology, 100, 535–548.https:// doi.org/10.1037/0022-0663.100.3.535.
Kuh, G. D., Gonyea, R. M., & Williams, J. M. (2005). What students expect from college and what they get. In T. E. Miller, B. E. Bender, J. H. Schuh & Associates (Eds.), Promoting reasonable expectations: Aligning student and institutional views of the college experience (pp. 34-64). San Francisco: Jossey-Bass/National Association of Student Personnel Administrators. Martínez-Fernández, J. R. (2004). Concepción de aprendizaje, metacognición y
cambio conceptual en estudiantes universitarios de psicología (Tesis doctoral sin publicar). Barcelona: Universitat de Barcelona Retrieved fromhttp://hdl. handle.net/2445/42698.pdf.
Martínez-Fernández, R. (2007). Concepción de aprendizaje y estrategias metacognitivas en estudiantes universitarios de psicología. Anales de Psicología, 23(1), 7–16.
Meredith, W. (1993). Measurement invariance, factor analysis and factorial invariance. Psychometrika, 58, 525–543.https://doi.org/10.1007/BF02294825. Naglieri, J. A., & Otero, T. M. (2014). The assessment of executive function using
the Cognitive Assessment System. In S. Goldstein, & J. A. Naglieri (Eds.), Handbook of executive functioning, (pp. 191–208). New York: Springer. Nunnally, J. C., & Bernstein, I. H. (1994). Psychometric theory, (3rd ed., ). New York:
McGraw-Hill.
O’Neil, H. F., & Abedi, J. (1996). Reliability and validity of a state metacognitive inventory: Potential for alternative assessment. The Journal of Educational Research, 89, 234–245.https://doi.org/10.1080/00220671.1996.9941208. Pleitz, J. D., MacDougall, A. E., Terry, R. A., Buckley, M. R., & Campbell, N. J. (2015).
Discrepancy between expectations and experiences on college student retention. Journal of College Student Retention: Research, Theory & Practice, 17, 88–104.https://doi.org/10.1177/1521025115571252.
Rodriguez, C. M. (2009). The impact of academic self-concept, expectations and the choice of learning strategy on academic achievement: The case of business students. Higher Education Research & Development, 28, 523–539.
https://doi.org/10.1080/07294360903146841.
Satorra, A., & Bentler, P. M. (1994). Corrections to test statistics and standard errors in covariance structure analysis. In A. von Eye, & C. C. Clogg (Eds.), Latent variable analysis, (pp. 399–419). Thousand Oaks: SAGE.
Sax, L., & Harper, C. E. (2007). Origins of the gender gap: Pre-college and college influences on differences between men and women. Research in Higher Education, 48, 669–694.https://doi.org/10.1007/s11162-006-9046-z. Sax, L. J., Bryant, A. N., & Harper, C. E. (2005). The differential effects of
student-faculty interaction on college outcomes for women and men. Journal of College Student Development, 46, 642–657.https://doi.org/10.1353/csd.2005. 0067.
Schraw, G., & Moshmam, D. (1995). Metacognitive theories. Educational Psychology Review, 7, 351–371.https://doi.org/10.1007/BF02212307. Soares, A. P., Guisande, M. A., Diniz, A., & Almeida, L. S. (2006). Construcción y
validación de un modelo multidimensional de ajuste de los jóvenes al contexto universitario. Psicothema, 18(2), 249–255 Retrieved fromhttp:// www.psicothema.com/psicothema.asp?id=3206.pdf.
Tinto, V. (1987). Leaving college: Rethinking the causes and cures of student attrition. Chicago: The University of Chicago Press.
Voyer, D., & Voyer, S. D. (2014). Gender differences in scholastic achievement: A meta-analysis. Psychological Bulletin, 140, 1174–1204.https://doi.org/10.1037/ a0036620.
Wang, J., Spencer, K., & Xing, M. (2009). Metacognitive beliefs and strategies in learning Chinese as a foreign language. System, 37, 46–56.https://doi.org/10. 1016/j.system.2008.05.001.
Wang, M., & Degol, J. (2017). Gender gap in Science, Technology, Engineering, and Mathematics (STEM): Current knowledge, implications for practice, policy, and future directions. Educational Psychology Review, 29, 119–140.
https://doi.org/10.1007/s10648-015-9355-x.
Publisher’s Note
Springer Nature remains neutral with regard to jurisdictional claims in published maps and institutional affiliations.