Elsevier Editorial System(tm) for Bone Manuscript Draft
Manuscript Number:
Title: Changes in bone Pb accumulation: cause and effect of altered bone turnover Article Type: Original Full Length Article
Keywords: Pb exposure; bone turnover; osteoporosis; kinetic models
Corresponding Author: Prof. José Brito, Ph.D Corresponding Author's Institution: ISCSEM First Author: José Brito, Ph.D
Order of Authors: José Brito, Ph.D; Isabel M Costa, Ph.D; Alexandra M Silva, Ph.D; José M Marques, Ph.D; Carlos M Zagalo, Ph.D; Inês I Cavaleiro, MSc; Tânia A Fernandes, MSc; Luísa L Gonçalves, Ph.D
Abstract: This paper assesses the magnitude of Pb uptake in cortical and trabecular bones in healthy animals and animals with altered balance in bone turnover, and the impact of exposure to Pb on serum markers of bone formation and resorption. The results reported herein provide physiological evidence that Pb distributes differently in central compartments in Pb metabolism, such as cortical and
trabecular bone, in healthy animals and animals with altered balance in bone turnover, and that exposure to Pb does have an impact on bone resorption resulting in OC-dependent osteopenia. These findings show that Pb may play a role in the etiology of osteoporosis and that its concentration in bones varies as a result of altered bone turnover characteristic of this disease, a long standing question in the field. In addition, data collected in this study are consistent with previous observations of increased half-life of Pb in bone at higher exposures. This evidence is relevant for the necessary revision of current physiologically based kinetic models for Pb in humans.
Suggested Reviewers: Howard Hu Ph.D
Dean and Professor, Dalla Lana School of Public Health, University of Toronto [email protected]
Michael Farquhardson Ph.D
Professor and Associated Dean Academic, Faculty of Sciences, McMaster University [email protected]
Richard Richardson Ph.D
Atomic Energy of Canada Limited [email protected]
Opposed Reviewers: Andrew C Todd [email protected]
Joanne O'Meara [email protected]
1 2 3 4 5 6 7 8 9 10 11 12 13 14 15 16 17 18 19 20 21 22 23 24 25 26 27 28 29 30 31 32 33 34 35 36 37 38 39 40 41 42 43 44 45 46 47 48 49 50 51 52 53 54 55 56 57 58 59 60 61
Title:
Changes in bone Pb accumulation: cause and effect of altered bone
turnover
Authors:
José A. A. Brito
*, Isabel M. Costa, Alexandra Maia e Silva, José M. S.
Marques, Carlos M. Zagalo, Inês I. B. Cavaleiro, Tânia A. P.
Fernandes and Luísa L. Gonçalves
WDXRFLab, CiiEM
Egas Moniz - Cooperativa de Ensino Superior, CRL Campus Universitário
Quinta da Granja - Monte de Caparica 2829-511 Caparica PORTUGAL Phone: (+351) 212 946 757 Fax: (+351) 212 946 734 *Email: [email protected] Manuscript
1 2 3 4 5 6 7 8 9 10 11 12 13 14 15 16 17 18 19 20 21 22 23 24 25 26 27 28 29 30 31 32 33 34 35 36 37 38 39 40 41 42 43 44 45 46 47 48 49 50 51 52 53 54 55 56 57 58 59 60 61 Abstract
This paper assesses the magnitude of Pb uptake in cortical and trabecular bones in healthy animals and animals with altered balance in bone turnover, and the impact of exposure to Pb on serum markers of bone formation and resorption. The results reported herein provide physiological evidence that Pb distributes differently in central compartments in Pb metabolism, such as cortical and trabecular bone, in healthy animals and animals with altered balance in bone turnover, and that exposure to Pb does have an impact on bone resorption resulting in OC-dependent osteopenia. These findings show that Pb may play a role in the etiology of osteoporosis and that its concentration in bones varies as a result of altered bone turnover characteristic of this disease, a long standing question in the field. In addition, data collected in this study are consistent with previous observations of increased half-life of Pb in bone at higher exposures. This evidence is relevant for the necessary revision of current physiologically based kinetic models for Pb in humans.
Keywords Pb exposure Bone turnover Osteoporosis Kinetic models
1 2 3 4 5 6 7 8 9 10 11 12 13 14 15 16 17 18 19 20 21 22 23 24 25 26 27 28 29 30 31 32 33 34 35 36 37 38 39 40 41 42 43 44 45 46 47 48 49 50 51 52 53 54 55 56 57 58 59 60 61 1. Introduction
Studies have confirmed that levels of lead (Pb) exposure lower than the present acceptable cutoff points are associated with increased mortality [1]. Physiologically based kinetic models (PBKM) representing the skeletal uptake, retention, and clearance of Pb in humans have long been in use and are important to define guidelines for prevention in occupational and environmental exposure to Pb. These models were developed before large epidemiological data sets including bone Pb were available and are limited to the data they are based on, which only in a few cases were collected in humans [2]. In particular, two widely used models, namely the Leggett and O’Flaherty models [3,4], were shown not to fit well epidemiological data from surveys of occupationally exposed populations, and require significant adjustments in their default transfer rates before some consistency between the observed and predicted bone Pb concentrations can be achieved [5,6].
In effect, it has been shown that a reduction by a factor of 5 in the default transfer rate from cortical bone to plasma in the O’Flaherty model was required to achieve some consistency between model predictions and data representative of occupational exposures [5]. The same authors report also that consistency between the model predictions and the data for trabecular bone was not achieved even after the corresponding default transfer rate from bone to plasma was reduced by a factor of 4. Moreover, data from a repeat bone Pb survey performed with occupationally exposed subjects showed that people aged less than 40 years have shorter half-life for Pb in tibia than did those older than 40, and that less intensely exposed subjects have shorter tibia Pb half-life than those with higher exposure [7,8]. In an independent approach to the transfer of Pb between body compartments, the earlier observation of the age- and exposure dependence of the transfer rate of Pb from bone to blood was confirmed and refined [9]. In addition, when the transfer rates thus derived were used to replace the default values in the Leggett model, a better agreement between measured and predicted bone Pb could be observed [6].
These results contrast with the assumption in the Leggett and O’Flaherty models that the transfer rate of Pb from bone to blood is both constant in adulthood and independent of bone Pb concentration. Moreover, current PBKM describe the distribution of Pb in the body under the assumption of balance between bone formation and bone resorption, which is not compatible with known age-related bone loss patterns for men (0.5 to 1% /year) and women (1% to 6% /year) starting around the age of 40 years [10]. Therefore, it is important to know how unbalanced bone formation and resorption affect the distribution of Pb in the body and the models’ output, as well as to establish the relative importance of Pb exposure on the rates of bone formation and resorption. Altogether, these results imply that current PBKM for Pb in humans should be revised to account for kinetic rates varying with age and exposure level.
Pb exposure is also associated with reduced bone mass and quality which may predispose to osteoporosis [11], a disease which clinical and public health importance is due to the associated fractures. The diagnosis of osteoporosis is centered on the assessment of bone mineral density (BMD), typically by single or dual X-ray absorptiometry (DXA) [12]. DXA alone is not optimal to detect people at high risk of fracture because it is bone strength that determines the fracture risk [10,13]. Other factors, such as age, sex, degree of bone turnover, glucocorticoid use, secondary
1 2 3 4 5 6 7 8 9 10 11 12 13 14 15 16 17 18 19 20 21 22 23 24 25 26 27 28 29 30 31 32 33 34 35 36 37 38 39 40 41 42 43 44 45 46 47 48 49 50 51 52 53 54 55 56 57 58 59 60 61
osteoporosis, either independently or in correlation with BMD, have been proven to contribute to fracture risk [10,14]. Information on validated risk factors other than BMD is necessary and, among those, indices of bone turnover, have been identified as factors that can enhance the predictive value of BMD [10,15].
The few human studies of Pb in the etiology of osteoporosis are focused on the association between Pb exposure and Bone Mineral Density (BMD) and have drawn divergent conclusions. Only one study relates changes in blood and bone Pb with increased bone resorption [16]. When current blood or urinary Pb are used as biological markers, Pb exposure and BMD have either no association [17,18], or an inverse association, in Hispanic white males only [19], and in former female Pb smelters [20]. When cumulative blood Pb or bone Pb assessed by in vivo 109Cd KXRF are used as biological markers, Pb exposure and BMD have a direct association [21], suggesting that Pb may well have a beneficial health effect. This was later considered a spurious association, due to the fact that the presence of Pb interferes with the accurate measurement of BMD by DXA, because of its higher attenuation coefficient compared to calcium [22]. Despite the significant contribution on in vivo bone Pb surveys to a better understanding of Pb metabolism is humans, the relationships between the concentration of Pb in bone and the rate of Pb removal from bone cannot be fully addressed by such surveys. The epidemiological data thus collected would convey information on the co-variation between the bone Pb concentrations and the rate of Pb removal from bone but would not help to clarify whether Pb is a causative agent of increased bone turnover or if its concentration in blood and bones varies as a result of increased bone turnover [23].
Cleary the best means for investigating the relationships between Pb distribution in the body and altered bone turnover is to use an animal model. Although it is debatable whether the coupled processes of bone formation and resorption that occur in rodents represent true bone remodeling, several reliable murine and rat models for both increased and decreased bone mass have been developed, which use is required by regulatory agencies such as the U.S. Food and Drug Administration for testing all antiosteoporosis therapeutics [24].
This paper assesses the magnitude of Pb uptake in cortical and trabecular bones in healthy animals and animals with altered balance in bone turnover, and the impact of exposure to Pb on serum markers of bone formation and resorption. Such relationships are useful for the research community interested in modeling the metabolic pathways of Pb in humans, because they provide physiological evidence for the necessary refinement of kinetic parameters governing the Pb transfer between blood and the compact and cortical bone tissues. In sum, the results presented herein will help to clarify whether Pb may play a role in the etiology of osteoporosis or if its concentration in blood and bones varies as a result of increased bone turnover characteristic of this disease.
2. Materials and methods 2.1 Animal experiments
The animal experiments in this study were approved by the Ethics Committee of the
1 2 3 4 5 6 7 8 9 10 11 12 13 14 15 16 17 18 19 20 21 22 23 24 25 26 27 28 29 30 31 32 33 34 35 36 37 38 39 40 41 42 43 44 45 46 47 48 49 50 51 52 53 54 55 56 57 58 59 60 61
the Portuguese Law and EU Directive 2010/63/EU on animal research. All animals were held in a licensed animal facility.
2.1.1 Experiment I
In order to assess Pb uptake in cortical and trabecular bone in the case of unbalanced bone formation and resorption, 47 female Wistar rats with 11 weeks of age were randomly assigned to three groups and kept in tall cages with 2 – 3 animals per cage. The following groups were considered: Normal group (n = 16) of intact rats; OVX group (n = 18) composed by animals who were ovarietomized between the 11th and 12th week of age; and EST group (n = 13) with animals who were to receive estrogen supplement treatment (EST) by means of subcutaneous administration of unopposed 17-estradiol, at 6 and 9 months of age. Prior to ovariectomy, all rats were anesthetized by an intraperitoneal injection of xylazine (10 mg/kg Rompun 2% Bayer) and ketamine (50 mg/kg Imalgene 1000, Merial), and OVX was performed from a dorsal approach [25]. Success of OVX was confirmed later at sacrifice, by failure to detect ovarian tissue and observation of marked atrophy of the uterine horn. In the EST group, animals were given subcutaneous implants of 17-estradiol pellets (90-day release, 0.025 mg/pellet IRA), via a small incision in the skin of the neck just behind the right ear under brief isofluorane anesthesia. In view of published data, this slow-release dosing regimen is deemed to result in a 10 to 30% increase of physiological plasma estradiol levels in intact female and male Wistar rats [26,27,28]. All animals were fed the same diet, adequately for daily requirements but not ad lib in order to avoid obesity. Obesity was monitored through regular assessment and recording of body weight. The diet was analyzed to ensure that it was Pb free.
From age 6-month on, animals in each of the 3 groups received the same dose of Pb acetate in water (500 ppm) for 6 months. At the end of this exposure to Pb, all animals included in the experiment were sacrificed using Euthanasia of Rodents by Carbon Dioxide, for the measurement of all the dependent variables. The excised bones were the lumbar vertebrae and femora. Selection of these particular bones results from the fact that the vertebrae, predominantly trabecular bone tissue, reflect mostly intermediate exposure to Pb, while the femora, predominantly cortical bone, reflect long-term exposure, and thus, represent two body compartments with different Pb kinetics. Moreover, these bones represent the bone sites where the incidence of osteoporotic fractures is highest in humans. In addition, approximately 1 mL of blood was collected by cardiac puncture for the assessment of markers of bone formation and resorption. At the end of this experiment, complete records for bone Pb concentrations and serum concentrations of markers of bone formation and resorption were available for 43 animals, with the following distribution: 16, 10 and 17, in the Normal, EST and OVX groups, respectively. A priori power analysis with a one-way ANOVA model for an expected large effect size induced by the experimental protocol, estimated a total sample size of at least 25 subjects for a minimum power of 80% at the 5% level of significance, which by far insures that the detected effects were not due to chance.
2.1.2 Experiment II
To assess the impact of exposure to Pb on the biochemical markers of bone turnover, four groups of adult (6 months) female Wistar rats were formed, in a total of 62
1 2 3 4 5 6 7 8 9 10 11 12 13 14 15 16 17 18 19 20 21 22 23 24 25 26 27 28 29 30 31 32 33 34 35 36 37 38 39 40 41 42 43 44 45 46 47 48 49 50 51 52 53 54 55 56 57 58 59 60 61
subjects. Group assignment, cage distribution and feeding were as described in experiment I. One group was taken as control (Group 1, n = 16) while the remaining three groups received 50 (Group 2, n = 15), 200 (Group 3, n = 16) and 500 (Group 4, n = 15) ppm of Pb acetate in drinking water, for a period of 6 months.
At baseline, 5 animals from each group were sacrificed, using Euthanasia of Rodents by Carbon Dioxide, for excision of lumbar vertebrae and femora bones. Two animals in Group 1 and another 2 in Group 2 have died after the onset of exposure. After the 6-month exposure, the remaining animals were euthanized for bone excision and blood collection, following the methods already described.
At the end of exposure to this specific experiment, complete records for bone Pb concentrations and serum concentrations of markers of bone formation and resorption were available for 31 animals, with the following distribution: 8, 6, 8 and 9, in Group 1, 2, 3 and 4, respectively. A priori power analysis with a one-way ANCOVA model for an expected large effect size induced by the intended treatment, estimated a total sample size of at least 31 subjects for a minimum power of 80% at the 5% level of significance. Therefore, the sample size at the end of the experiment was large enough to insure that the detected effects were not due to chance.
In both experiments, all collected bone and blood derived samples were fresh frozen until measurements were performed.
2.2 Assays of biomarkers of bone turnover
Most biochemical indices of bone resorption are related to collagen breakdown products or the various collagen cross-links and telopeptides. In contrast, markers of bone formation are either by-products of collagen neosynthesis or osteoblast-related proteins, such as osteocalcin [29]. In rats, circulating osteocalcin (OC) originates from new bone synthesis rather than the breakdown of bone and serum levels of immunoreactive OC have been shown to correlate well with the bone formation rate as assessed by histomorphometry [29,30]. In contrast, bone resorption rate cannot be measured directly by histomorphometry but can be measured indirectly as changes in bone formation rate by the measured rate of change in bone volume, although it is one of the derived indices which use is somewhat clouded with issues of reasonability and rigor of the underlying assumptions [31]. At present, serum C-terminal peptide-bound crosslinks of Type I collagen (CTX-1) has been chosen as the reference standard for bone resorption rate, following a well described rationale in the literature [32].
In this context, OC and CTX-1 markers of bone turnover were assessed in the serum of fasting rats of the different groups considered in both experiments in this study. In order to control for circadian variations of circulating OC and CTX-1, blood collection has been performed in the same period of the day (9 to 11 am). Approximately 1 mL of blood was collected by cardiac puncture and two ELISA kits were used to for the quantification of osteocalcin (Rat-MIDTM osteocalcin from IDS) and CTX-1 (RatLaps TM ELISA (CTX-1), from IDS) in rat serum. After the usual procedures described in the protocols provided by the ELISA Kit suppliers, RatLaps antigens in each sample were measured in an ELISA Microplate Reader at 450 nm.
1 2 3 4 5 6 7 8 9 10 11 12 13 14 15 16 17 18 19 20 21 22 23 24 25 26 27 28 29 30 31 32 33 34 35 36 37 38 39 40 41 42 43 44 45 46 47 48 49 50 51 52 53 54 55 56 57 58 59 60 61 2.3 Bone Pb determinations
The concentration of Pb in compact and trabecular animal bones was determined by wavelength dispersive X-ray fluorescence (WDRXF) spectrometry, using a commercial 4 kW X-ray fluorescence spectrometer (S4 Pioneer, Bruker AXS) equipped with a Rh X-ray tube with a 75 mm Be end window and a 34 mm diameter collimator mask. The feasibility of the WDXRF method for the assessment of Pb in animal bone powder was demonstrated and described in detail elsewhere [33]. In brief, excised femora and lumbar vertebrae were prepared in the following sequence: 24 hour ultrasound bath in distilled water, that helped remove the remaining soft tissues at the bone surface using a surgical scalpel with a stainless steel blade; 24 hour freeze drying, with a multipurpose ice condenser (ModulyoD230, Thermo Savant) operated at a nominal temperature of -50 ºC, to remove any excess water; and grinding in an agate mortar to reduce the samples to a fine powder. Median particle length was 180 µm, as determined by light microscopy after sieving the bone powder through a 355 µm opening grid and its dispersion in water. High-density polyethylene X-ray fluorescence sample cups with 35.8 mm diameter assembled with a 4 µm prolene film were used to support the bone powder sample. The polyethylene cup was placed in steel sample cup holders with an opening diameter of 34 mm. Bone mass was in the range of 1 to 2.2 g for vertebrae and 1 to 1.5 g for femora, which produced samples of bone powder with heights between 1 and 2 mm.
For the calibration of the WDXRF system, a set of 9 synthetic standards were prepared in triplicate by doping calcium carbonate (CaCO3) with known amounts of Pb(II)
acetate (C4H6O4Pb3·H2O). Measurements were performed in helium mode, with fixed
measurement times (180 s) which insured a counting statistical error of not more than 5% for a 3 criterion. The estimated detection limit was 1.7 ppm, while intra-assay precision, assessed at 3 concentration levels (10, 150 and 250 ppm) as the coefficient of variation of 12 repeat measurements, was in the range 0.3% to 7.6%. The accuracy of the method was established through the measurement of the NYS Reference Materials 05-02 through 04 showing good agreement with certified values [34].
3. Results 3.1 Experiment I
The body weight (in g) of the 43 animals with complete records at the end of the experiment is presented in table 1, at baseline and endpoint. No differences concerning the body weight were observed between groups both at the baseline (p = 0.219) and endpoint (p = 0.131), as shown by the non-parametric Kruskal-Wallis test.
Table 1
Mean ± Standard Deviation of body weight (in g) of normal, estrogen supplement treated (EST) and ovariectomized (OVX) animals, at baseline and after exposure (experiment I).
Time Normal EST OVX
Baseline 348.7 ± 17.9 358.0 ± 33.6 372.7 ± 32.3
1 2 3 4 5 6 7 8 9 10 11 12 13 14 15 16 17 18 19 20 21 22 23 24 25 26 27 28 29 30 31 32 33 34 35 36 37 38 39 40 41 42 43 44 45 46 47 48 49 50 51 52 53 54 55 56 57 58 59 60 61 Table 2
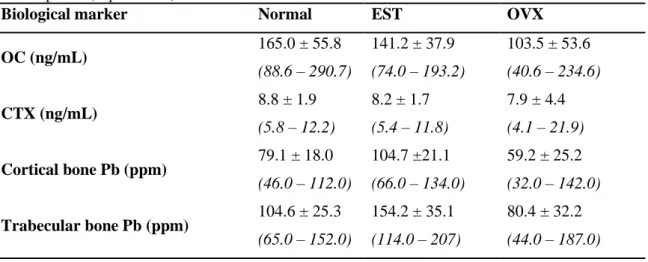
Mean ± Standard Deviation and range of serum levels of OC and CTX and Pb concentrations in cortical and trabecular bone in normal, estrogen supplement treated (EST) and ovariectomized (OVX) animals, after exposure (experiment I).
Biological marker Normal EST OVX
OC (ng/mL) 165.0 ± 55.8 (88.6 – 290.7) 141.2 ± 37.9 (74.0 – 193.2) 103.5 ± 53.6 (40.6 – 234.6) CTX (ng/mL) 8.8 ± 1.9 (5.8 – 12.2) 8.2 ± 1.7 (5.4 – 11.8) 7.9 ± 4.4 (4.1 – 21.9) Cortical bone Pb (ppm) 79.1 ± 18.0 (46.0 – 112.0) 104.7 ±21.1 (66.0 – 134.0) 59.2 ± 25.2 (32.0 – 142.0) Trabecular bone Pb (ppm) 104.6 ± 25.3 (65.0 – 152.0) 154.2 ± 35.1 (114.0 – 207) 80.4 ± 32.2 (44.0 – 187.0)
Table 2 shows the concentration of Pb in cortical and trabecular bone in the 3 groups considered in this experiment and their serum levels of the markers of bone formation and resorption, the main processes governing bone remodeling, and therefore the intake and release of Pb by bone.
As is well known, the process of bone remodeling is the coupling of osteoclastic bone resorption followed by osteoblastic bone formation, under tight regulation by systemic hormones and by local factors released by osteoclasts and osteoblasts with reciprocal regulatory effects on their activity [35]. In humans, bone remodeling takes place in bone metabolic units (BMU); however, rodents lack traditional BMUs, so it is debatable whether the coupled processes of formation and resorption that occur in rats represent true remodeling [24]. In this work, such coupling processes were far from being ruled out by the observed significant inverse correlation between the serum concentrations of OC and CTX, as expressed by a Spearman correlation coefficient of -0.461 (p = 0.009). Therefore, in the analysis of each the bone turnover markers across groups, it is necessary to remove from that comparison the association with the other marker. This was implemented using a One-Way ANCOVA model including the serum level of each marker of bone turnover as dependent variable, the group as independent factor and the serum level of the other marker as covariate.
Regardless of the marker used as dependent variable in the ANCOVA model, a significant interaction was detected between the covariate and the independent factor. Therefore, post-hoc group comparisons were performed through planned contrasts, at the 25th, 50th and 75th percentiles of the serum concentrations for each marker of bone turnover. These percentiles were 91.2, 129.6 and 169.0 ng/mL, for OC and 6.0, 8.0 and 9.0 ng/mL for CTX. The results of these planned contrasts are shown in table 3. In general, differences between the groups were more evident for serum OC than for serum CTX, with OVX animals showing significantly lower serum OC levels than normal and EST animals, nearly over the considered range of serum CTX. Concomitantly, OVX animals also showed a trend for higher serum CTX than normal and EST animals with increasing serum OC, although significant differences were only achieved or suggested
1 2 3 4 5 6 7 8 9 10 11 12 13 14 15 16 17 18 19 20 21 22 23 24 25 26 27 28 29 30 31 32 33 34 35 36 37 38 39 40 41 42 43 44 45 46 47 48 49 50 51 52 53 54 55 56 57 58 59 60 61 Table 3 Estimated contrasts (ij) a
in serum CTX (and OC) in different exposure groups, over the range of serum OC (CTX) values. Values between brackets refer to the contrast significance (experiment I).
DVb: CTX Serum OC
percentile
EST Group OVX Group
Normal Group 25 NE = 0.443 (0.832) NO = 2.183 (0.104) 50 NE = 0.788 (0.514) NO = -0.137 (0.900) 75 NE = 1.113 (0.337) NO = -2.456 (0.056) EST Group 25 EO = 1.740 (0.286) 50 EO = -0.125 (0.428) 75 EO = -3.600 (0.022) DV: OC Serum CTX percentile
EST Group OVX Group
Normal Group 25 NE = 30.157 (0.361) NO = 99.581 (<0.001) 50 NE = 29.435 (0.150) NO = 67.943 (<0.001) 75 NE = 29.075 (0.169) NO = 51.974 (0.004) EST Group 25 EO = 69.424 (0.015) 50 EO = 38.408 (0.051) 75 EO = 22.999 (0.276) a
NE - mean contrast between Normal and EST groups; NO - mean contrast between Normal and OVX groups;
EO - mean contrast between EST and OVX groups b
DV – Dependent variable in the ANCOVA model
at higher serum OC in these groups. Moreover, normal and EST animals did not show any differences in what concerns serum OC and CTX.
Finally, one-way ANOVA has been used to compare the Pb concentration of the different groups, in both cortical and trabecular bone, after validation of the assumption of homogeneous variances across groups with the Levene test (p > 0.05, for both bones). Following ANOVA, significant differences were detected between groups for the Pb concentration in cortical bone (p < 0.001), with an observed power of 99.9%. Post-hoc comparisons using the Tukey’s test have detected significantly higher Pb concentrations in cortical bone in the EST group than in the normal (p < 0.001) and the OVX (p < 0.001) groups. Moreover, Pb concentrations in cortical bone of OVX animals were significantly lower than those of normal animals (p = 0.030).
Similar results were observed for trabecular bone. In fact, significant differences were detected between groups for the Pb concentration in trabecular bone (p < 0.001), with an observed power in excess of 99.9%, according to ANOVA. Again, significantly higher Pb concentrations were observed in the trabecular bone of the EST group, in comparison to the normal (p < 0.001) and the OVX (p < 0.001) groups. Finally, lower Pb concentrations in the trabecular bone of OVX animals, in comparison to normal, were also suggested by the post-hoc Tukey’s test, although the difference did not reach statistical significance (p = 0.068).
1 2 3 4 5 6 7 8 9 10 11 12 13 14 15 16 17 18 19 20 21 22 23 24 25 26 27 28 29 30 31 32 33 34 35 36 37 38 39 40 41 42 43 44 45 46 47 48 49 50 51 52 53 54 55 56 57 58 59 60 61 Table 4
Mean ± Standard Deviation of body weight (in g), at baseline and after exposure (experiment II).
Time Group 1 Group 2 Group 3 Group 4
Baseline 336.3 ± 7.5 319.3 ± 11.0 326.5 ± 2.1 329.3 ± 21.3
Endpoint 389.7 ± 13.0 409.0 ± 28.6 385.5 ± 10.6 380.3 ± 28.0
Table 5
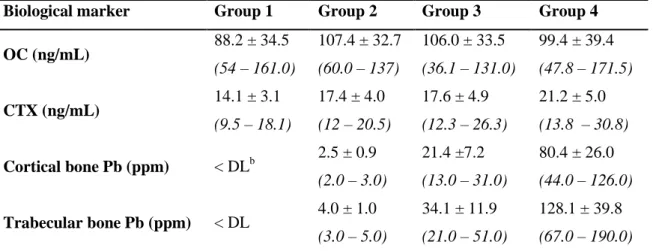
Mean ± Standard Deviation and range of serum levels of OC and CTX and bone Pb concentrations in cortical and trabecular bone in the 4 groups of animals, after exposure (experiment II).
Biological marker Group 1 Group 2 Group 3 Group 4
OC (ng/mL) 88.2 ± 34.5 (54 – 161.0) 107.4 ± 32.7 (60.0 – 137) 106.0 ± 33.5 (36.1 – 131.0) 99.4 ± 39.4 (47.8 – 171.5) CTX (ng/mL) 14.1 ± 3.1 (9.5 – 18.1) 17.4 ± 4.0 (12 – 20.5) 17.6 ± 4.9 (12.3 – 26.3) 21.2 ± 5.0 (13.8 – 30.8) Cortical bone Pb (ppm) < DLb 2.5 ± 0.9 (2.0 – 3.0) 21.4 ±7.2 (13.0 – 31.0) 80.4 ± 26.0 (44.0 – 126.0) Trabecular bone Pb (ppm) < DL 4.0 ± 1.0 (3.0 – 5.0) 34.1 ± 11.9 (21.0 – 51.0) 128.1 ± 39.8 (67.0 – 190.0)
b DL – Detection limit of the WDXRF technique used for bone Pb determinations (1.7 ppm)
3.2 Experiment II
Table 4 presents the body weight (in g) of the 31 animals with complete records for bone Pb and OC and CTX concentrations in the different groups, at baseline and end of the 6-month exposure to Pb in water. No differences in the body weight were detected between groups, both at baseline (p = 0.461) and end of exposure (p = 0.091), according to the Kruskal-Wallis test. For the same animals, the serum levels of OC and CTX and the concentration of Pb in cortical and trabecular bone are presented in Table 5.
In view of the abovementioned coupling of bone formation and resorption, when comparing the different exposure groups for their serum levels of either CTX or OC, it is necessary to remove from each comparison the association between serum levels of CTX and OC. This was implemented using a One-Way ANCOVA model including the serum level of each marker as dependent variable, the exposure group as independent factor and the serum level of the other marker as covariate.
In these conditions, for the model including serum CTX as dependent variable, one-way ANCOVA has detected a significant interaction between the covariate OC and exposure group (p = 0.015), with an observed power of 80.0%. In addition, significant differences (p = 0.010) in the serum levels of CTX were detected between exposure groups, with an observed power of 84.3%. Finally, no significant differences in the serum levels of OC were observed between exposure groups, although such effect was suggested by the data (p = 0.064).
1 2 3 4 5 6 7 8 9 10 11 12 13 14 15 16 17 18 19 20 21 22 23 24 25 26 27 28 29 30 31 32 33 34 35 36 37 38 39 40 41 42 43 44 45 46 47 48 49 50 51 52 53 54 55 56 57 58 59 60 61 Table 6
Estimated contrasts (ij)a in serum CTX in different exposure groups, over the range of serum OC values. Values between brackets refer to the contrast significance (experiment II).
Serum OC percentile
Group 2 Group 3 Group 4
Group 1 25 12 = -9.7 (0.001) 13 = -5.2 (0.068) 14 = -7.9 (0.002) 50 12 = -4.9 (0.043) 13 = -4.5 (0.049) 14 = -7.6 (0.002) 75 12 = -0.7 (0.830) 13 = -3.9 (0.200) 14 = -7.3 (0.015) Group 2 25 23 = 4.5 (0.151) 24 = 1.8 (0.496) 50 23 = 0.5 (0.843) 24 = -2.6 (0.246) 75 23 = -3.2 (0.258) 24 = -6.6 (0.017) Group 3 25 34 = -2.7 (0.340) 50 34 = -3.1 (0.148) 75 34 = -3.4 (0.139) a
ij - mean contrast group i and group j
The abovementioned significant interaction, the dominant effect in the ANCOVA model, shows that the effects of exposure to Pb on the serum level of CTX depend on the serum level of OC. Consequently, post-hoc group comparisons were performed at reference levels of serum OC, through planned contrasts as described in the literature [36]. The reference levels were set at 74, 104 and 131 (ng/mL), respectively the 25th, 50th and 75th percentiles of serum OC. Table 6 presents the results of these planned contrasts, where ij is the estimated contrast, defined as the difference between the
means of serum CTX in group i and group j.
These results show that serum CTX was significantly higher in the exposed groups than in the non-exposed group, over the considered range of serum OC. Moreover, the exposed groups did not differ amongst themselves in serum CTX over nearly the whole range of serum OC, except for groups 2 and 4 at the upper quartile of serum OC, in which case higher serum CTX was observed in the highest exposed group.
4. Discussion
It is generally accepted that OVX in rats increases bone resorption and bone formation, leading to bone loss [24,37], whereas EST by means if administration of unopposed 17-estradiol induces rapid suppression of bone resorption markers and a delayed decrease in bone formation markers [29]. While the supporting evidence for the expected response to OVX has been provided by the technique of bone histomorphometry [37], the expected changes induced by EST are supported by studies which have assessed urine and serum markers of bone turnover [29].
In this study (experiment I), a 6-month exposure to the same dose of Pb in water resulted in significantly higher serum CTX and lower serum OC levels in the OVX group, in comparison with normal and EST female Wistar rats. In addition, markers of bone formation and resorption were both lower in EST than in normal animals, although the differences did not reach statistical significance. These results agree with the generally accepted view for the post-OVX induced changes on bone resorption markers, but are at variance with the expected changes on bone formation markers, and for the
1 2 3 4 5 6 7 8 9 10 11 12 13 14 15 16 17 18 19 20 21 22 23 24 25 26 27 28 29 30 31 32 33 34 35 36 37 38 39 40 41 42 43 44 45 46 47 48 49 50 51 52 53 54 55 56 57 58 59 60 61
EST induced changes in bone turnover markers, despite the lack of statistical significance.
To begin with, it is noted that increased bone resorption and decreased bone formation, as observed in the OVX group in this study, may result in osteopenia and this is the expected outcome in a model for decreased bone mass such as OVX [24]. Also, the fact that increased serum CTX in the OVX group was strongly suggested in comparison with the normal animals, and was statistically significant in comparison to the EST group, in both cases only at the upper quartile of the range of serum OC, cannot be ruled out in view of published data. In fact, it has been reported that OC levels can influence changes of bone parameters which impact on bone strength or bone turnover, as a result of changes in bone metabolism. For example, it was shown that OVX-induced decreases in bone maturity could only be detected at high bone OC levels, whereas OVX-induced decreases in bone mass parameters could only be detected at low bone OC levels [38]. Moreover, one must use caution when contrasting the observed data with the accepted view, due to the number of factors that determine the outcome of in vivo studies, namely age of animal at the time of OVX and the time post-OVX when the measurements are made [37], and due to the fact that the studies supporting such view, put aside some methodological issues, only considered cases of OVX and EST uncomplicated by Pb exposure. The current view for the response of rats to OVX-induced osteopenia relies largely on a few studies using histomorphometry analysis of static and dynamic parameters of bone turnover [37]. Since static parameters are not indicative of cellular activity and corresponding bone formation and resorption rates, the contrast with the accepted view will focus on the dynamic parameters which are more meaningful as indices of bone formation rate [39].
In brief, it has first been reported that, at 5 weeks post-OVX performed on rats of approximately 75 days of age, all histomorphometric indices of bone formation rate in OVX animals were increased in comparison with normal rats [40]. Later, the same group has reported that, at different times from 14 to 180 days post-OVX performed on 90-day old rats, some, but not all, indices of bone formation rate already considered in the previous work differed between OVX and normal rats [39]. However, these conclusions are clouded with issues of correctness affecting the analysis of the data. First, the high standard deviations in the dynamic parameters of bone formation, as noted by the authors themselves [40], jeopardize the conclusion of post-OVX increases in bone formation rates. Second, it is not immediately clear how a truly two-factorial design and a clear interaction between time and animal status, which is obvious from the depicted data, was tackled by using a two-tailed Student´s t-test for group comparisons at different time points [39]. Actually, recent research using more appropriate statistical analysis of the data has concluded that none of the histomorphometric indices of bone formation rate was different between OVX and normal rats, at any time point from 6 weeks to 9 months post-OVX performed at 10 months of age [41]. However, these studies only considered the case of OVX and EST uncomplicated by Pb exposure. Because Pb competes with calcium and replaces it in bones [3,4], it is conceivable that it could interfere with the expected response to OVX by decreasing mineral apposition rate, and therefore, bone formation rate. This is consistent with the observation that, at 9 months post-OVX, OVX animals had already lower, although non-significant, mineral apposition rates than controls [37].
1 2 3 4 5 6 7 8 9 10 11 12 13 14 15 16 17 18 19 20 21 22 23 24 25 26 27 28 29 30 31 32 33 34 35 36 37 38 39 40 41 42 43 44 45 46 47 48 49 50 51 52 53 54 55 56 57 58 59 60 61
Moreover, in what concerns the lack of statistical significance of the EST induced decrease in bone turnover markers observed in this work in comparison with normal rats, it is first noted that 17-estradiol has been administered as an antiresorptive agent usually in ovariectomized rats [29], not on intact animals exposed to Pb, and at much higher dosing regimens than that used in this study [26,27,28]. Conceivably, Pb exposure combined with a low-dose, slow-release EST regimen administered to normal rats, may moderate the expected decrease in bone turnover markers induced by EST administered in the abovementioned standard conditions, and thus, result in a non significant change.
Therefore, despite some divergence with the generally accepted view for the post-OVX and the EST induced changes in bone turnover markers, the observed results in this work are consistent with published data and, more importantly, with the observed pattern of Pb accumulation in bone of the normal, OVX and EST animals considered in this study, which is addressed next.
In fact, one main finding of this study (experiment I) was that a 6-month exposure to the same dose of Pb in water resulted in significantly different Pb uptake by both cortical and trabecular bone between normal, EST and OVX female Wistar rats. In current PBKM it is assumed that Pb is incorporated from plasma into forming bone at a rate proportional to the bone formation rate, and is removed from bone to plasma as bone is resorbed at a rate proportional to the bone resorption rate [3,4]. In view of this assumption, the observed differences in Pb uptake by bone should relate to differences in the serum OC and CTX levels observed between those groups of animals at the end of exposure. As a matter of fact, increased Pb removal and decreased Pb incorporation by bone, and consequently decreased bone Pb accumulation, are expected from the increased bone resorption and decreased bone formation observed in the OVX group, in comparison with the normal and EST groups. In addition, if just the direction of the contrasts is considered, the increased bone Pb concentrations in the EST group in comparison with normal animals may conceivably follow from the decreased bone resorption and bone formation in the former group, according to the generally accepted view for the EST induced changes on markers of bone turnover. However, how the significant marked differences in bone Pb concentrations follow from non-significant contrasts in bone turnover markers at the end of the 6-month exposure is unclear. Possibly, the initial rapid and marked suppression of bone resorption and delayed decrease in bone formation induced by the administration 17-estradiol favored an initial rapid and marked increase in bone Pb concentrations in the EST group, in comparison of that of normal animals, a contrast which remained until de end of exposure. Concomitantly, the higher bone Pb concentrations in the EST group would have induced an increase of bone resorption as suggested by the results in experiment II of this study, to a greater extent than in the normal group, and thus, leveling bone resorption in both groups at the end of exposure.
In sum, these results show that Pb distributes in a significantly different manner in both compact and trabecular bone, two central compartments in Pb metabolism, in the case of unbalanced bone formation and bone resorption. Since current PBKM do not account for the case of varying bone mass in adulthood, resulting either from diseases such as osteoporosis or from the natural changes in bone turnover with age [3,4], the bone Pb concentrations predicted by the models in such case may differ significantly from the real concentrations. Therefore, in order to avoid an imprecise description of Pb
1 2 3 4 5 6 7 8 9 10 11 12 13 14 15 16 17 18 19 20 21 22 23 24 25 26 27 28 29 30 31 32 33 34 35 36 37 38 39 40 41 42 43 44 45 46 47 48 49 50 51 52 53 54 55 56 57 58 59 60 61
metabolism such models should be revised to account for varying bone mass with age. Moreover, these results also show that Pb concentration in bones varies as a result of altered bone turnover, a question raised in previous work [23].
Another main finding of this study (experiment II) was that Pb exposure resulted in significantly increased serum CTX level and unaltered serum OC levels in female Wistar rats, showing that Pb exposure has the potential to disrupt the balance between bone formation and bone resorption which characterizes the turnover of healthy bone. It should be noted that the magnitude and significance of such effects seem to depend on the serum levels of OC and are more marked with decreasing levels of OC. The resemblance of these effects and their dependence on OC levels to those described in the literature for the OVX-induced decrease in bone mass [38] is noteworthy, despite the likely different mechanisms underlying the changes in bone metabolism resulting from OVX and Pb accumulation in bone. This emphasizes the role of OC as one of the factors involved in bone turnover, although its precise function is yet to be determined [29,30,38]. In addition, no significant contrasts for serum CTX were detected between exposed groups, suggesting that the interaction between exposure gradient and OC level did not induce a significant osteopenic effect, except when such gradient is maximum, as is the case between the lowest and highest exposure groups, and even so at the upper quartile of serum OC. Following these results, Pb exposure may lead to a reduction in bone mass which, along with disruption of bone architecture, defines osteoporosis [10]. Therefore, Pb may play a role in the etiology of this disease, although such role could not be established unequivocally because bone architecture was not assessed in this study.
In view of current assumptions in PBKM, namely that Pb is incorporated in bone during bone formation and is removed from bone during bone resorption [3,4], it seems paradoxical that both osteopenia and increased half-life of Pb in bone, as suggested in this work and observed in previous studies [7,8], respectively, are apparently associated with higher exposures to Pb. This apparent paradox, however, can be explained by the methodological options of data analysis followed in this and previous studies. In fact, in previous work the level of exposure was considered alone as the main factor in the analytical model, with potential effect on the half-life of Pb in bone. Instead, in the current study the interaction between exposure and OC was included in the analytical model, and its effect on bone resorption was found to be significant and dominant in the model. Therefore, any direct comparison between the conclusions established on the impact of such interaction on bone turnover, and consequently on the half-life of Pb in bone, and the conclusions of previous work on the effect of exposure on the latter parameter can be misleading without further discussion. Moreover, in previous studies the half-life contrasts were estimated between cases of actual exposures to Pb while in this work the osteopenic effects were suggested following contrasts between the non-exposed and non-exposed cases. As a matter of fact, if only the estimated contrasts in bone resorption between actually exposed groups in this study were considered, then the current results would suggest that decreasing OC levels favor the increment of the half-life of Pb in bone with increasing exposure. This is consistent with the conclusion that the half-life of Pb in bone is increased at higher exposure, established in previous work based on a sample 75% of which were Pb exposed subjects older than 40 years [8], and therefore with OC expectedly at the lowest levels according to published data [42]. As a final remark, such consistency is not undermined by the lack of statistical significance of the estimated contrasts in bone resorption between exposed groups in this work,
1 2 3 4 5 6 7 8 9 10 11 12 13 14 15 16 17 18 19 20 21 22 23 24 25 26 27 28 29 30 31 32 33 34 35 36 37 38 39 40 41 42 43 44 45 46 47 48 49 50 51 52 53 54 55 56 57 58 59 60 61
because even with a much larger sample not all half-life contrasts for compact and trabecular bone reach the traditional 5% level of significance [8].
In conclusion, this paper provides physiological evidence that Pb distributes differently in central compartments in Pb metabolism, such as cortical and trabecular bone, in healthy animals and animals with altered balance in bone turnover, and that exposure to Pb does have an impact on bone resorption resulting in OC-dependent osteopenia. These findings show that Pb may play a role in the etiology of osteoporosis and that its concentration in bones varies as a result of altered bone turnover characteristic of this disease. In addition, data collected in this study are consistent with previous observations of increased half-life of Pb in bone at higher exposures. This physiological evidence is relevant for the necessary revision of current PBKM for Pb, including possibly the new physiological skeletal model (PSM) recently developed [43] and which, to the best of the authors’ knowledge, has not been fit to epidemiological data on bone lead yet. This PSM is presented as an improvement on existing skeletal models, since it relies on structural concepts and kinetic parameters selected on the basis of physiological and anatomical criteria rather than on compartment structures which render good fits to biokinetic data. However, in a strict sense, it embodies a revision of existing models that preserves some of the main assumptions of older models and which were challenged by the physiological evidence provided by this study.
Acknowledgements
The authors wish to thank Egas Moniz – Cooperativa de Ensino Superior, CRL, for the financial support, and Instituto Rocha Cabral, for their assistance in the animal experiments.
References
1. Rosin A. The Long-term Consequences of Exposure to Lead. Isr Med Assoc J. 2009 Nov;11(11):689-94
2. Mushak P. Uses and limits of empirical data in measuring and modeling human lead exposure. Environ Health Perspect. 1998; Dec; 106 (Suppl 6):1467-84. 3. Leggett R. An age-specific kinetic model of lead metabolism in humans.
Environ Health Perspect. 1993; 101: 598-616.
4. O’Flaherty EJ. Physiologically Based Kinetic Models for Bone-Seeking Elements. Toxicology and Applied Pharmacology. 1993 Jan; 118 (1):16-29. 5. Fleming DE, Chettle DR, Webber CE, O’Flaherty EJ. The O'Flaherty model of
lead kinetics: an evaluation using data from a lead smelter population. Toxicol Appl Pharmacol. 1999; 161(1): 100-109.
6. Nie H, Chettle DR, Webber CE, Brito JA, O’Meara JM, McNeill FE. X-Ray fluorescence data in the study of human bone lead metabolism. J Environ Monit. 2005; 7: 1069-73.
7. Brito JAA, McNeill FE, Chettle DR, Webber CE, Vaillancourt C. Study of the relationships between bone lead levels and its variation with time and the cumulative blood lead index, in a repeated bone lead survey. J Environ Monit. 2000; 2: 271-6.
8. Brito J, McNeill FE, Chettle DR, Webber CE, Wells S, Richard N. Longitudinal changes in bone lead concentration: implication for modeling of human bone lead metabolism. J Environ Monit. 2001; 3: 343 - 51.
1 2 3 4 5 6 7 8 9 10 11 12 13 14 15 16 17 18 19 20 21 22 23 24 25 26 27 28 29 30 31 32 33 34 35 36 37 38 39 40 41 42 43 44 45 46 47 48 49 50 51 52 53 54 55 56 57 58 59 60 61
9. Brito JAA, McNeill FE, Webber CE, Chettle DR. Grid search: an innovative method for the estimation of the rates of lead exchange between body compartments. J Environ Monit. 2005; 7: 241-7.
10. European Commission. Report on osteoporosis in the European Community - Action for prevention. Luxembourg: Office for Official Publications of the European Communities. 1998.
11. Monir AU, Gundberg CM, Yagerman SE, van der Meulen MCH, Budell WC, Boskey AL, Dowd TL. The effect of lead on bone mineral properties from female adult C57/BL6 mice. Bone. 2010; 47(5): 888-94.
12. Kanis JA. Diagnosis of osteoporosis and assessment of fracture risk. Lancet. 2002; 359: 1929-36.
13. Seeman E. Pathogenesis of bone fragility in women and men. Lancet. 2002; 359: 1841-50.
14. Cummings SR, Melton III LJ. Epidemiology and outcomes of osteopororic fractures. Lancet. 2002; 559: 1761-7.
15. Fitzpatrick LA. Secondary causes of osteoporosis. Mayo Clinic Proc. 2002; 77: 453-68.
16. Potula V, Henderson A, Kaye W. Calcitropic hormones, bone turnover, and lead exposure among female smelter workers. Arch Environ Occup Health. 2005; 60(4): 195-204.
17. Alfven T, Jarup L, Elinder CG. Cadmium and lead in blood in relation to low bone mineral density and tubular proteinuria. Environ Health Perspect. 2002; 110: 699-702.
18. Sun Y, Sun DH, Zhou ZJ, Zhu GY, Zhang HY, Chang XL, Lei L, Jin T. Osteoporosis in a Chinese population due to occupational exposure to lead. Am J Ind Med. 2008; 51(6): 436-42.
19. Campbell JR, Auinger, P. The association between blood lead levels and osteoporosis among adults - Results from the Third National Health and Nutrition Examination Survey (NHANES III). Environ Health Perspect. 2007; 115(7): 1018-22.
20. Potula V, Kleinbaum D, Kaye W. Lead exposure and spine bone mineral density. J Occup Environ Med. 2006; 48(6): 556-64.
21. Campbell JR, Rosier RN, Novotny L, Puzas JE. The Association between Environmental Lead Exposure and Bone Density in Children. Environ Health Perspect. 2004; 112(11): 1200-03.
22. Thepeang K, Glass TA, Bandeen-Roche K, Todd AC, Rohde CA, Links JM, Schwartz BS. Associations of bone mineral density and lead levels in blood, tibia, and patella in urban dwelling women. Environ Health Perspect. 2008; 116(6): 784-90.
23. Adachi J, Arlen D, Webber C, Chettle D, Beaumont L, Gordon C. Is There Any Association Between the Presence of Bone Disease and Cumulative Exposure to Lead? Calcif Tissue Int, 1998; 63: 429-32.
24. Hau J, Hoosier GLV (Eds.). Handbook of laboratory animal science. Vol. II. Ch.10. 2nd ed. Boca Raton: CRC Press. 2003.
25. Durão SFO, Gomes PS, Silva-Marques JM, Fonseca HRM, Carvalho JFC, Duarte JAR, Fernandes MHR. Bone Regeneration in Osteoporotic Conditions: Healing of Subcritical-Size Calvarial Defects in the Ovariectomized Rat. Int J Oral Maxillofac Implants. 2012; 27:1400-08.
1 2 3 4 5 6 7 8 9 10 11 12 13 14 15 16 17 18 19 20 21 22 23 24 25 26 27 28 29 30 31 32 33 34 35 36 37 38 39 40 41 42 43 44 45 46 47 48 49 50 51 52 53 54 55 56 57 58 59 60 61
26. Reed WR, Chadha HK, Hubscher CH. Effects of 17-Estradiol on Responses of Viscerosomatic Convergent Thalamic Neurons in the Ovariectomized Female Rat. J Neurophysiol. 2009; 102: 1062-74.
27. Lowry NC, Pardon LP, Yates MA, Juraska J M. Effects of long term treatment with 17 β-estradiol and medroxyprogesterone acetate on water maze performance in middle aged female rats. Horm Behav. 2010, July; 58(2): 200-07.
28. Gupta DS, Hubscher CH. Estradiol treatment prevents injury nduced enhancement in spinal cord dynorphin expression. Front Physio. 2012; 3:28. doi: 10.3389/fphys.2012.00028
29. Osteoporosis, Pathophysiology and Clinical Management, Series: Contemporary Endocrinology, R.A. Adler, New York, NY: Humana Press, 2010. 2nd ed. 30. Gundberg CM, Lian JB, Booth SL. Vitamin K-Dependent Carboxylation of
Osteocalcin: Friend or Foe? American Society for Nutrition. Adv Nutr. 2012; 3: 149-57.
31. Parfitt AM, Drezner MK, Glorieux FH, Kanis JA, Malluche,H, Meunier PJ, Ott SM, Recker RR. Bone histomorphometry: Standardization of nomenclature, symbols, and units. Report of the ASBMR Histomorphometry Nomenclature Committee. J Bone Miner Res. 1987; 2: 595-610.
32. Vasikaran S, Eastell R, Bruyère O, Foldes AJ, Garnero P, Griesmacher A, McClung M, Morris HA, Silverman S, Trenti T, Wahl DA, Cooper C, Kanis JA. Markers of bone turnover for the prediction of fracture risk and monitoring of osteoporosis treatment: a need for international reference standards, Osteoporos Int. 2011; 22:391-420.
33. Brito JAA, Cavaleiro IIB, Fernandes TAP, Gonçalves LML. The feasibility of wavelength dispersive X-ray fluorescence spectrometry for the assessment of lead concentration in animal bone powder. Anal Methods. 2013; 5, 598-602. 34. Bellis DJ, Hetter KM, Verostek MF, PJ Parsons. Characterization of candidate
reference materials for bone lead via interlaboratory study and double isotope dilution mass spectrometry. J Anal At Spectrom, 2008; 23(3), 298-308.
35. Hill PA, Orth M. Bone Remodelling. British Journal of Orthodontics. 1998; 25, 101-7.
36. Engqvist L. The mistreatment of covariate interaction terms in linear model analyses of behavioural and evolutionary ecology studies. Animal Behaviour. 2005;70, 967-71.
37. Elsubeihi ES, Bellows CG, Jia Y, Heersche JNM. Ovariectomy of 12-month-old rats: effects on osteoprogenitor numbers in bone cell populations isolated from femur and on histomorphometric parameters of bone turnover in corresponding tibia. Cell Tissue Res.2007; 330:515-26.
38. Hara K, Kobayashi M, Akiyama Y. Influence of bone osteocalcin levels on bone loss induced by ovariectomy in rats. J Bone Miner Metab.2007; 25:345-53. 39. Wronski TJ, Cintron M, Dann LM. Temporal Relationship between Bone Loss
and Increased Bone Turnover in Ovariectomized Rats. Calcif Tissue Int. 1988; 43:179-83.
40. Wronski TJ, Lowry PL, Walsh CC, Ignaszewski LA. Skeletal Alterations in Ovariectomized Rats Calcif Tissue lnt. 1985; 37:324-28.
41. Shoji k, Elsubeihi ES, Heersche JNM. Effects of ovariectomy on turnover of alveolar bone in the healed extraction socket in rat edentulous mandible. Archives of Oral Biology. 2011; 56: 114-20.
1 2 3 4 5 6 7 8 9 10 11 12 13 14 15 16 17 18 19 20 21 22 23 24 25 26 27 28 29 30 31 32 33 34 35 36 37 38 39 40 41 42 43 44 45 46 47 48 49 50 51 52 53 54 55 56 57 58 59 60 61
42. Fatayerji D, Eastell R. Age-Related Changes in Bone Turnover in Men. Journal Of Bone And Mineral Research. 1999; 14 (7): 1203-10.
43. Richardson RB. A physiological skeletal model for radionuclide and stable element biokinetics in children and adults. Health Phys. 2010, Oct; 99(4):471-82.