New Polymeric films for Smart Windows
with Permanent Memory Effect
Dissertação para obtenção do Grau de Doutor em
Química Sustentável
Orientador: Prof. Doutor João Carlos da Silva Barbosa
Sotomayor, Professor Auxiliar, FCT-UNL
Júri
Setembro, 2019
Presidente: Prof. Doutor Manuel Luís de Magalhães Nunes da Ponte Arguentes: Prof. Doutor José Virgílio de Sousa Coelho Prata
Prof. Doutor João Luís Maia Figueirinhas Vogais: Prof. Doutora Maria Helena Figueiredo Godinho
Prof. Doutor João Francisco Alves Martins
III
Mestre em Bioorgânica
New Polymeric films for Smart Windows
with Permanent Memory Effect
Dissertação para obtenção do grau de doutor em
Química Sustentável
Orientador: Professor Doutor João Carlos da Silva Barbosa
Sotomayor, Professor Auxiliar, FCT-UNL
V
VII Copyright, Ana Isabel Machado Mouquinho, FCT/UNL, UNL
Indicação dos direitos de cópia
A Faculdade de Ciências e Tecnologia e a Universidade Nova de Lisboa têm o direito, perpétuo e sem limites geográficos, de arquivar e publicar esta dissertação através de exemplares impressos reproduzidos em papel ou de forma digital, ou por qualquer outro meio conhecido ou que venha a ser inventado, e de a divulgar através de repositórios científicos e de admitir a sua cópia e distribuição com objetivos educacionais ou de investigação, não comerciais, desde que seja dado crédito ao autor e editor.
Copyright
Faculdade de Ciências e Tecnologia and Universidade Nova de Lisboa have the perpetual right with no geographical boundaries, to archive and publish this dissertation through printed copies reproduced on paper or digital form or by any means known or to be invented, and to divulge through scientific repositories and admit your copy and distribution for educational purposes or research, not commercial, as long as the credit is given to the author and editor.
IX Firstly, I would like to express my sincere gratitude to my advisor, Professor João Sotomayor for the freedom and confidence placed in the chosen research routes, which was decisive for my scientific development. Thank you for your knowledge, for always treating me with cordiality, respect and equality.
Similar, gratitude goes to Professor Maria Teresa Barros, for being as dedicated as if she were a secondary advisor. Thank you for your immense knowledge, comments and encouragement over the years. I am particularly indebted for providing me the opportunity to work in her laboratory.
My sincere thanks also go to Dr. Krasimira Petrova for her friendship, support and accessibility that positively influenced the results.
Special mention goes to Professor João Figueirinhas, who provided me an opportunity to use his research laboratory and for the profitable theoretical discussions.
I am grateful to Professor Madalena Dionísio for her friendship, kindness and for her lab support in particular in differential scanning calorimeter.
I would like to acknowledge Professor Mário Eusébio for the development of a computer program essential to the electro-optical studies. Professor João Martins and Dr. Fernando Monteiro are acknowledged for their support in the experimental setup to measure the electro-optical properties of PDLC devices.
Special mention goes to Professor Gabriel Feio, Dr. Pedro Almeida and Dr. Marta Corvo for collaboration in solids magnetic resonance studies.
I am thankful to Professor Luís Pereira for the photolithography process, Professor Elvira Fortunato and Dr. Mafalda Costa for the confocal microscopy measurements, Professor Rita Branquinho for profilometry measurements and Dr. Daniela Gomes for scanning electron microscopy measurements. I also would like to thank Dr. Luz Fernandes for valuable help in discussing the results of MALDI-TOF. Thanks to Faculdade de Ciências e Tecnologia da Universidade Nova de Lisboa and especially to the Department of Chemistry that welcomed me and the availability of infrastructure, technical and human resources indispensable for the laboratory practice of this work.
Thanks to Fundação para a Ciência e Tecnologia for the financial support granted under the PhD scholarship (SFRH/BD/91870/2012).
I am grateful to colleagues and friends of the Faculdade de Ciências e Tecnologia. In particular, I am grateful to Andreia Forte.
Special thanks to my mother for all the love and support. No word serves to measure this thanks. Because no matter how hard I try, I will never show all the gratitude I have with me.
I am especially indebted to my husband, Victor for all that we have achieved. With love, understanding, sense of humor and effort this PhD completes another achievement.
Finally, I would like to express my profound gratitude to my lovely children, Manuel, Gabriel and João. The three were born during my PhD and they are my true masterpieces and so I dedicate this thesis to them.
XI In the field of the liquid crystals in device applications, the polymer dispersed liquid crystal (PDLC) with permanent memory effect can become feasible in technological applications. Although studies of the liquid crystals in technological applications were extensively reviewed in the literature, not so much has been reported on the permanent memory effect (PME) in PDLCs. PDLCs can change transmittance from a totally opaque state to a totally transparent state during the application of an external electric field. Typically, the opaque appearance returns to the PDLC when the electric field is switched OFF. However, in this work PDLCs have been produced that use the electric field to create a highly transparent state but the transparent state remains even when the electric field is switched OFF giving rise to a permanent alignment state of LC molecules. This property is called a permanent memory effect (PME). For optimizing this effect a series of linear polyethylene glycol di(meth)acrylate and multi-arm polyethylene glycol with linear chains arms extending radially from a central core with reactive (meth)acrylate end groups were synthesized and characterized. The resulting pre-polymers and also some commercial ones were then tested in preparation of PDLCs.
The 70 % of PME and the reproducibility even after multiple repetitions of the heating and electric field cycles application make the poly(ethyleneglycol) dimethacrylate of molecular weight 875 g mol-1 the most appropriate pre-polymer in preparation of PDLCs with PME. This effect is also dependent on the thermal polymerization which produces a polymer ball morphology type in the polymer matrix. In addition, PME is also highly dependent on the alignment layer type coating the glass PDLC cell (homogeneous alignment).
With the high transparent state permanently displayed at room temperature through PME (70 %), an efficient procedure to allow the PDLC to acquire its opaque state has been achieved. A method of removing the PME has been outlined by Joule effect with the application of the electric current to the conductive layer (ITO) of the glass PDLC cell. This procedure makes the experimental setup to destroy the LC alignment structure simpler and more practical than by radiation heat.
Conventional PDLCs need continuity of energy supply for keeping the ON state, which can be a very limiting aspect for many applications. However, PDLCs with PME besides having lower power consumption can be used in digital memory devices based on write-read-erase cycles. For this, a prototype has been assembled as proof of the concept to be used in the digital process of recording information with the binary language.
XIII No campo dos cristais líquidos (CL) com aplicação em dispositivos, o cristal líquido disperso numa matriz polimérica (PDLC) é viável para aplicações tecnológicas. Apesar dos diversos estudos de cristal líquido neste tipo de aplicação, pouco está referenciado sobre o efeito de memória permanente (EMP) em filmes de PDLC. Normalmente, dispositivos de PDLCs podem alternar a transmitância de um estado totalmente opaco para um estado totalmente transparente durante a aplicação de um campo elétrico. Contudo, o PDLC retoma a um estado opaco quando o campo elétrico é desligado. No entanto, neste trabalho foram produzidos PDLCs que usam o campo elétrico para criar um estado de elevada transparência mas um estado transparente permanece mesmo quando o campo é desligado dando origem a um estado de alinhamento permanente das moléculas de cristal líquido. Para otimizar este foi sintetizado e caracterizado uma série de polietilenoglicol dimetacrilato e diacrilato de cadeia linear e uma série de cadeia ramificada com os grupos metacrilato ou acrilato como grupos funcionais terminais.
A percentagem de 70 % de efeito de memória permanente e a reprodutibilidade após múltiplas repetições de aquecimento e aplicação de campo elétrico fazem com que o polietilenoglicol dimetacrilato com uma massa molecular de 875 g mol-1 seja o mais apropriado para preparar PDLCs com efeito de memória permanente. Este efeito é também dependente da polimerização térmica que possibilita uma morfologia do tipo “polymer ball”. Adicionalmente, o efeito de memória permanente é também dependente do tipo de camada de alinhamento que reveste o vidro da célula de PDLC (alinhamento homogêneo).
Com o estado de alta transparência permanentemente exibido pelo efeito de memória permanente (70 %) foi desenvolvido um procedimento eficiente para estes PDLCs adquirirem novamente um estado opaco. Este método foi delineado pelo efeito de Joule com aplicação de corrente elétrica à camada condutora (ITO) da célula de vidro de PDLC. Este procedimento faz com que a destruição do alinhamento das moléculas de CL seja mais simples e prático do que a aplicação de calor por radiação.
Os PDLCs convencionais precisam continuamente de energia para manter o estado ligado, o que pode ser um aspeto muito limitativo para muitas aplicações. No entanto, os PDLCs com efeito de memória permanente além do menor consumo de energia podem ser utilizados em dispositivos de memória digital baseados em ciclos de gravar, ler e apagar informação digital. Para isso, um protótipo foi montado como prova de conceito para ser utilizado num processo digital de gravação de informação em linguagem binária.
Palavras-chave:
xv List of Contents
1 Liquid Crystal Fundamentals and Applications ... 1
1.1 Basic Types and Structures of Liquid Crystals ... 1
1.2 Classification of Liquid Crystals ... 1
1.3 Phase Structures of Calamitic and Discotic Liquid Crystals... 2
1.3.1 Phase Structures of Calamitic LCs ... 2
1.3.2 Phase Structure of the Discotic Liquid Crystal ... 5
1.4 Physical Properties of Calamitic Nematic Liquid Crystals ... 6
1.4.1 Order in Calamitic Nematic Liquid Crystals ... 7
1.4.2 Refractive Index ... 8
1.4.3 Dielectric Properties ... 9
1.4.4 Elastic Constants ... 10
1.5 Liquid Crystalline Alignment Surfaces ... 11
1.5.1 Types of Surface Alignment ... 11
1.5.2 Methods and Materials to Create Homeotropic and Homogeneous Alignments 13 1.6 The Liquid Crystal in Device Applications ... 16
1.6.1 Liquid Crystals used in Displays ... 16
1.6.2 The Fréedericksz Transition ... 19
1.6.3 Twisted Nematic (TN) and Super-Twisted Nematic (STN) ... 20
1.6.4 In-Plane Switching (IPS)... 21
1.6.5 Addressing Principles of Passive and Active Matrix in LCDs... 22
1.7 Polymer Dispersed Liquid Crystal (PDLC) ... 23
xvi
1.7.2 Important Features of The Polymer to Be Used in PDLCs ... 26
1.7.3 Polymer Structure and Properties ... 27
1.7.4 Anchoring Effects in PDLCs ... 29
1.7.5 Liquid Crystal Domains Configurations in PDLCs ... 30
1.7.6 Scattering and Switching In PDLCs ... 31
1.7.7 Permanent Memory Effect (PME) ... 33
1.7.8 Some Useful Parameters to Characterize PDLCs ... 34
1.7.9 Special PDLCs ... 35
1.7.10 Applications of PDLCs ... 37
1.8 Green Chemistry ... 38
2 Materials and Experimental Techniques ... 41
2.1 Electro-Optical Characterization ... 41
2.2 Polarized Optical Microscopy (POM) ... 43
2.3 Scanning Electronic Microscopy ... 45
2.4 Confocal Laser Scanning Microscope ... 46
2.5 Differential Scanning Calorimetry ... 46
2.6 Matrix-Assisted Laser Desorption Ionization-Time of Flight Mass Spectrometry (MALDI-TOF MS) ... 48
2.7 Preparation of PDLC Samples ... 49
2.7.1 Materials ... 49
2.8 The Synthesis Reagents ... 52
2.9 Commercial Pre-Polymers ... 52
2.10 NMR Spectroscopy... 53
xvii
3.1 Electro-Optical Properties ... 56
3.2 Morphology of Polymer Matrix of PDLC Samples ... 58
3.3 Nematic to Isotropic Liquid Crystal Transition ... 58
3.4 Glass Transition Temperature and Permanent Memory Effect ... 59
3.5 Polymer Glass Transition Temperature and Permanent Memory Effect ... 61
3.6 Solid-State NMR ... 62
3.7 Conclusions ... 66
4 Appropriate Polymer Matrix Morphology in appearance of Permanent Memory Effect ... 69
4.1 Morphological Evolution of Polymer Matrix: Comparison between Thermal and Photo-Polymerization ... 69
4.2 Electro-Optical Properties of PDLC ... 75
4.2.1 Thermal Polymerization ... 75
4.2.2 Photochemical Polymerization ... 76
4.3 Polymer Ball and Swiss Cheese Polymer Matrix Morphology in Permanent Memory Effect 78 4.4 Conclusions ... 79
5 Di-Functional PEG with long linear chain length ... 81
5.1 Amorphousness and Crystallinity in Polymers ... 81
5.2 Synthesis, NMR and MALDI-TOF Characterization of End-Functionalized Poly (ethylene glycols)... 83
5.2.1 Nucleophilic Acyl Substitution Mechanism under Basic Conditions ... 83
5.2.2 Poly (ethylene glycol) dimethacrylate ... 85
5.2.3 Poly (ethylene glycol) diacrylate ... 87
xviii
5.4 Differential scan calorimetry results and discussion ... 93
5.5 Electro-Optical Properties ... 97
5.6 Polarized Optical Micrographs ... 98
5.7 Scanning Electron Microscopy ... 99
5.8 Conclusions ... 100
6 Multi-Functional Poly(ethylene glycol) ... 103
6.1 Synthesis and Characterization of Arm-PEG End-Functionalized ... 104
6.1.1 Tri-arm PEG with Methacrylate Ends Groups (3-armPEG TriM) ... 104
6.1.2 Tri-arm PEG with Acrylate Ends Groups (3-armPEG TriA) ... 108
6.1.3 MALDI-TOF MS ... 111
6.1.4 Four-arm PEG with methacrylate ends Groups (4-armPEG TetraM) ... 113
6.1.5 Four-arm PEG with Acrylate ends Groups (4-armPEG TetraA)... 117
6.1.6 MALDI-TOF MS ... 121
6.1.7 Differential scanning calorimetry ... 123
6.1.8 Electro-Optical Properties... 128
6.1.9 Co-Polymerization ... 130
6.2 Synthesis and Characterization of 3-armPEG-PPG with Highly Length Chains ... 133
6.2.1 Synthesis and Characterization of 3-armPEG-PPG with Methacrylate Ends Groups 133 6.2.2 Synthesis and characterization of 3-armPEG-PPG with acrylate ends groups 137 6.2.3 MALDI-TOF MS ... 140
6.2.4 Electro-Optical, Morphological and DSC properties ... 142
6.2.5 Nematic to Isotropic Transitions ... 145
xix
7 Effect of Surface Alignment Layers on Permanent Memory Effect ... 147
8 Manufacturing Passive PDLC Film Matrixes: Digital Memory PDLCs Devices based on Electrical Writing Digital Information... 153
8.1 Pattern Fabrication on ITO Covered with an Alignment Layer ... 154
8.1.1 Line-shaped ITO Electrodes Covered with Polyimide Thickness Measurement 156 8.2 PDLC Passive Matrix Assembly Device ... 157
8.3 PDLC Passive Matrix Device Operation... 158
9 Erase Stored Information and Rewrite it again ... 161
10 Final Conclusions ... 165
11 Bibliography ... 167
xxi List of Figures
Figure 1.1 – Schematic illustration of aggregate morphologies of lyotropic liquid crystals: a) cylinder; b) sphere and c) lamellar phases (adapted from3). ... 1 Figure 1.2 – Molecular structures and their templates: a) calamitic liquid crystal molecule and b) discotic liquid crystal molecule (adapted from1). ... 2 Figure 1.3 – Schematic representation of the sequence of phase transition exhibited by rod-like molecules between a crystalline solid and an isotropic liquid by increasing temperature (adapted from1). Tm is the melting transition temperature, TSC-SA is the smectic-C to the smectic-A transition temperature, TSA-N is the Smectic-A to the nematic transition temperature and TNI is nematic to the isotropic transition temperature. ... 3
Figure 1.4 – Molecular structure of a chiral liquid crystal (CB15). ... 4 Figure 1.5 – Schematic illustration of the molecular orientation in a chiral calamitic mesophase. The director (n) within each layer delineates a spiral molecular orientational along the structure (adapted from5). ... 4 Figure 1.6 – Schematic representation of the sequence of phase transition exhibited by discotic molecules between a crystalline solid and isotropic liquid by increasing the temperature (adapted from1). Tm is the melting transition temperature, TCN is the columnar to the nematic transition temperature and TNI is the nematic to the isotropic transition temperature. ... 5 Figure 1.7 – Schematic illustration of typical calamitic nematic liquid crystal molecule (adapted from 2). ... 6
Figure 1.8 – Schematic illustration of the effect of an electric field in calamitic liquid crystal molecules applied parallel (a) or perpendicular (b) to the core the molecule and the induced dipole moment vector: 𝑝|| and 𝑝, respectively (adapted from
2
). ... 7
Figure 1.9 – Schematic illustration of the states of rod-shaped molecules with different orientational order in a) perfect orientational order; b) the high degree of orientational order as nematic liquid crystal and c) without order as found in isotropic liquids (adapted from 2). ... 8 Figure 1.10 – Schematic illustration of the effect of electric field in reorientation of the n-director and in the polarization of LC molecule: a) and b) in nematic liquid crystal molecules with positive dielectric anisotropy (∆ε>0) and c) and d) in nematic liquid crystal molecules with negative dielectric anisotropy (∆ε<0) (adapted from 2
xxii
Figure 1.11 – Schematic representation of the spatial variation of n-director in a) undistorted nematic LC; b) with a splay distortion; c) with a twist distortion and d) when there is a bend distortion (adapted from2). ... 11
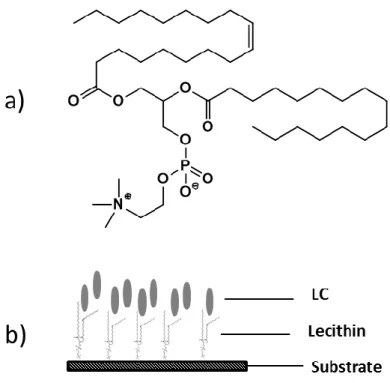
Figure 1.12 – Schematic illustration of a typical orientations of nematic liquid crystals when sandwich in two parallel substrates with different surface alignment: a) homogeneous; b) tilt; c) homeotropic; d) splay; e) twist nematic; f) bend; g) hybrid and h) super-twisted nematic alignment (adapted from12). ... 12 Figure 1.13 – Schematic illustration of LC cell with homogeneous alignment but with a different direction of alignment: a) antiparallel directions result in Fréedericksz cell and b) in the same directions of alignment result in π-cells (adapted from2
). ... 13 Figure 1.14– Schematic illustration of homeotropic alignment using lecithin: a) chemical structure of lecithin and b) homeotropic alignment using lecithin (adapted from 2). ... 14 Figure 1.15– Chemical structure of rubbing polymers a) Polyvinyl alcohol (PVA), b) polyimide (PI2555), c) schematic illustration of rubbing technique and d) LC molecules align along the direction of the grooves (adapted from 1,2). ... 15 Figure 1.16– Schematic illustration of Fréedericksz transition of a liquid crystal with positive dielectric anisotropy sandwiched between two parallel substrates treated in homogeneous alignment when: a) V<Vth; b) V> Vth and c) V>> Vth (adapted from2). ... 19 Figure 1.17– Schematic illustration of the operation of a twisted nematic (TN) cell when a) no voltage applied (white) and b) with a voltage applied above the Vth (black) (adapted from12). .. 20 Figure 1.18– Schematic representation of the basic principle of the IPS switching mode in the OFF and ON state (adapted from 15). ... 21 Figure 1.19 – Schematic representation of a passive address matrix in. The row drivers (left) and column drivers (above) are used to addressing every pixel in the matrix (adapted from 16). ... 22 Figure 1.20– Schematic representation of active address matrix display (adapted from 16
) ... 23 Figure 1.21– Simple schematic illustration of the microstructure of the polymer matrix with a polymer ball morphology type (left) and swiss cheese morphology type (right). ... 26
Figure 1.22- Schematic representations of different polymer structures: a) linear, b) branched and c) crosslinked (adapted from 27). ... 27
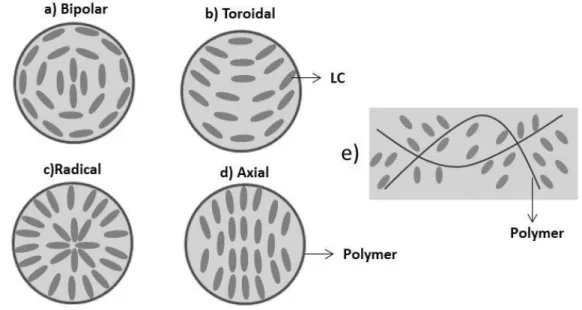
xxiii Figure 1.23– Generalized simply mechanism for free radical polymerization (adapted from 18,32
). ... 29 Figure 1.24– Schematic illustration of the liquid crystal director configuration inside spherical domains (left) and (adapted from12) and irregular domains (right). ... 30 Figure 1.25– The relationship between temperature and refractive indices ordinary (no) and extraordinary (ne) of a typical nematic liquid crystal and for an isotropic liquid crystal (ni) (solid lines) and the refractive index of a typical polymer (np) (dashed line) (adapted from
35
). ... 32 Figure 1.26 – Schematic representation of a PDLC with a) randomly orientation of the domains director producing a highly scattering state and b) with the application of an applied field LC molecules (∆ε>0) align up with the field matching the refractive indices (no and np) and a highly transparent state is achieved. ... 33 Figure 1.27– Electro-optical response of PDLC a) with no hysteresis, b) with hysteresis and c) with permanent memory effect ... 33 Figure 1.28– Schematic representation of holographic PDLCs at zero electric field with randomly orientation structure of LC. The cell has a periodic refractive index and light is highly reflected (a) and with the application of an applied field (b) LC molecules (∆ε>0) align with the field matching the refractive indices of the polymer rich layer and liquid crystal rich layer and light is transmitted (adapted from1). ... 36 Figure 1.29 – The twelve principles of green chemistry (adapted from63
). ... 39 Figure 2.1– Schematic of the experimental set-up developed to measure the electro-optical properties of the PDLC devices. ... 41 Figure 2.2– Schematic representation of a calibration set-up of voltage amplifier using a signal generator. ... 42 Figure 2.3– Schematic explanation of how to get polarized transmitted light from random light (adapted from64). ... 43 Figure 2.4– Schematic representation of a) align and b) cross-polarizer (adapted from64
). ... 44 Figure 2.5– Schematic illustration of the interaction of birefringent material with polarized light between crossed polarizers in an optical microscope (adapted from 65). ... 45 Figure 2.6– Schematic illustration of different instruments used in DSC to detect energy changes occurring in a sample: a) heat flux DSC and b) power compensation DSC (adapted from71). ... 47
xxiv
Figure 2.7 – Schematic representation of a DSC curve achieved by the heat flux method where conventionally the endothermic peaks go down unlike exothermic peaks... 47
Figure 2.8 – Thermal cleavage of 2,2’-azobisisobutyronitrile (AIBN) to give two isobutyronitrile radicals and molecular nitrogen (adapted from 32). ... 49
Figure 2.9 – Ultraviolet light-induced decomposition of p-xylylene bis-(N,N-diethyldithiocarbamate) (XDT) into a dithicarbamyl and a carbon radicals (adapted from 78,79). 50 Figure 2.10 – Schematic representation of the preparation of PDLC films by PIPS method. .... 51
Figure 2.11 – Schematic representation of a) top view of ITO glass substrate model D256A-X000 provide by Instec Inc (left) and b) lateral view of a manufactured LC cell (right) (adapted from81). ... 51
Figure 2.12 – Schematic representation of a top view (left) and lateral view (right) of a commercial LC cell model LC2-20.0 provide by Instec Inc (adapted from81). ... 52 Figure 3.1– Chemical structure of diol-PEG where n is the number of ethylene oxide units. ... 55
Figure 3.2 – The electro-optical response for PDLC films prepared with a)TriEGDM, b)TetraEGDM, c)PEGDM550 and d)PEGDM875 and E7 with weight ratios of 30/70 (wt%), and 1 wt% of AIBN with respect to the pre-polymer, polymerized at 70 °C, overnight. The transmittance was measured by applying increasing electric field (filled symbols) and decreasing electric field (open symbols). ... 57 Figure 3.3 – Scanning electronic micrographs for the microstructure of the polymer matrix of the PDLC films prepared with different pre-polymers: a) TriEGDM; b) TetraEGDM; c) PEGDM550; d) PEGDM875. All samples were prepared with pre-polymer and E7 with weight ratios of 30/70 (wt. %), and 1wt. % of AIBN with respect to the monomer. ... 58 Figure 3.4 – Thermogram obtained from DSC measurement during the Cycle I and II for a pure liquid crystal E7. The cycle I correspond to the first heating and cooling runs and cycle II to the second heating and cooling runs, both at 5 ºC min-1... 59 Figure 3.5 – Thermograms (heat flow vs. temperature) of a mixture of PEGDM875 oligomer with 1wt.% of AIBN collected at the heating scan at 5 ºC min-1 and for PEGDM875 polymer collected with two heating and cooling cycles at 5 ºC min-1. ... 60
Figure 3.6 – Thermograms (heat flow vs. temperature) of PEGDM550 oligomer with 1wt.% of AIBN collected with a heating scan at 5 ºC min-1 and for PEGDM550 polymer collected with two heating and cooling cycles at 5 ºC min-1. ... 60
xxv Figure 3.7 – A simplified illustration of liquid crystal orientation influenced by Tg of polymer: a) Tg higher than room temperature (TriEGDM and TriEGDM polymers) and b) Tg lower than room temperature (PEGDM550 and PEGDM875 polymers) (adapted from106). ... 62
Figure 3.8 – The composition and molecular structures of the components of the nematic LC mixture E7. In the aliphatic chains, the methyl, α-methylene and methylene group adjacent to the aromatic core are depicted in grey by CH3, α-CH2 and Ar-CH2, respectively. ... 63 Figure 3.9 – 13
C CPMAS spectra of (a) E7, (b) TriEGDM polymer and (c)TriEGDM/E7 PDLC. In aliphatic peaks, the methyl, α-methylene and methylene group adjacent to the aromatic core are depicted in grey by CH3, α-CH2 and Ar-CH2, respectively. ... 64 Figure 3.10 – 13
C CPMAS spectra of (a) E7, (b) PEGDM875 polymer and (c) PEGDM875/E7 PDLC. In aliphatic peaks, the methyl, α-methylene and methylene group adjacent to the aromatic core are depicted in grey by CH3, α-CH2 and Ar-CH2, respectively. ... 64 Figure 3.11 – 13
C MAS spectra of (a,b) TriEGDM/E7 PDLC and (c,d) PEGDM875/E7 PDLC. The spectra were acquired (a, c) without and (b, d) with cross-polarization. In aliphatic peaks, the methyl, α-methylene and methylene group adjacent to the aromatic core are depicted in grey by CH3, α-CH2 and Ar-CH2, respectively. ... 65 Figure 4.1– The evolution of phase separation morphology observed by polarized optical micrographs with crossed polarizers of PDLC films prepared with the PEGDM875 (1 wt.% of AIBN)+E7 in a weight ratio of 30/70 (wt.%) thermally polymerized at 70 ºC with different polymerization time in initial OFF state: (a) 4 min; (b) 5 min; (c) 6 min; (d) 20 min; (e) 60 min and (f) 60 min in OFF state but upon removal the applied electric field, x100 magnification. ... 70
Figure 4.2 –The evolution of phase separation morphology observed by polarized optical micrographs with crossed polarizers of PDLC films prepared with the PEGDM875 (1 wt.% of XDT)+E7 in a weight ratio of 30/70 (wt.%) photochemically polymerized at curing 366 nm UV light intensity 48 mWcm-2 with different exposure time: (a) 300 s; (b) 500 s; (c) 700 s and (d) 900 s in initial OFF state, x100 magnification. ... 71
Figure 4.3 – The evolution of phase separation morphology observed by polarized optical micrographs with crossed polarizers of PDLC films prepared with the PEGDM875 (1 wt. % of XDT) +E7 in a weight ratio of 30/70 (wt.%) photochemically polymerized at curing 366 nm UV light intensity at 0.48 mWcm-2 with different exposure time: (a) 30000 s; (b) 50000 s; (c) 70000 s and (d) 90000 s in initial OFF state, x100 magnification. ... 72 Figure 4.4 – Scanning electronic microscopy micrographs for the microstructure of the polymer matrix of the PDLC films prepared with the PEGDM875(1 wt.% of AIBN)+E7 in a weight ratio of
xxvi
30/70 (wt.%) thermally polymerized at different temperatures and times: a) 60 ºC, 90 min; b) 66 ºC, 60 min; c) 90 ºC, 10 min. ... 72 Figure 4.5 – Scanning electronic microscopy micrographs for the microstructure of the polymer matrix of the PDLC films prepared with the PEGDM875 (1 wt.% of XDT)+E7 in a weight ratio of 30/70 (wt.%) photochemically polymerized at 366 nm UV light curing intensity at 48 mWcm-2 during different times: a) 300 s; b) 500 s; c) 700 s; d) 900 s. ... 73 Figure 4.6 – Scanning electronic microscopy micrographs for the microstructure of the polymer matrix of the PDLC films prepared with the PEGDM875(1 wt. % of XDT)+E7 in a weight ratio of 30/70 (wt.%) photochemically polymerized at 366 nm UV light curing intensity at 0.48 mWcm-2 during different times: a) 30000 s; b) 50000 s; c) 70000 s; d) 90000 s... 73 Figure 4.7– Dependence of average LC domains diameter with the UV exposure time for each UV curing light intensity used. The average size of the liquid crystal domains was determined using scanning electronic microscopies images. ... 74 Figure 4.8 – Confocal visible microscopy scans through the entire thickness of the PDLC glass sample: a) 20 µm of PDLC cell thickness for polymer-ball morphology and b) 5 µm PDLC cell for swiss-cheese morphology. In the images, the polymer matrix appears as dark regions and bright regions are LC domains. ... 75 Figure 4.9– The electro-optical response optimized for PDLC films prepared with the PEGDM875(1 wt.% of AIBN)+E7 in a weight ratio of 30/70 (wt.%) and polymerized at different temperatures and times: (a) 55 ºC, 120 min (b) 70 ºC, 120 min (c) 74 ºC, 40 min (d) 90 ºC, 10 min. The transmittance was measured by applying increasing electrical field (filled symbols) and decreasing electrical field (open symbols). ... 76 Figure 4.10 – The electro-optical response for PDLC films prepared with the PEGDM875(1 wt.% of XDT)+E7 in a weight ratio of 30/70 (wt.%) and polymerized at different curing UV 366 nm light intensities and times: a) 48 mW cm-2; 900 s; b) 0.48 mW cm-2; 90000 s. The transmittance was measured by applying increasing electrical field (filled symbols) and decreasing electrical field (open symbols). ... 77 Figure 4.11 – The electro-optical response for PDLC films prepared with the PEGDM875(1 wt.% of XDT)+E7 in a weight ratio of 30/70 (wt.%) and polymerized at different curing UV light intensities and times: a) 48 mW cm-2; 300, 500, 700 and 900 s; b) 0.48 mW cm-2; 30000, 50000, 70000 and 90000 s. The transmittance was measured by applying increasing electrical field (filled symbols) and decreasing electrical field (not shown). ... 77 Figure 5.1– Schematic illustration of the crystallization behavior in a) atomic or short chain molecular system and b) macromolecular system (adapted from123). ... 82
xxvii Figure 5.2 – Schematic illustration of a finged-micelle model of the microstructure of semicrystalline macromolecules (adapted from124). ... 83 Figure 5.3 – General scheme for the synthesis of PEGDA and PEGDM; R=H or CH3, n= number of repeating ethylene oxide units (EO). ... 84
Figure 5.4- Nucleophilic acyl substitution reaction mechanism under basic conditions (NEt3), R = alcohol side chain (ethylene oxide); R´= H or CH3. ... 85 Figure 5.5 – MALDI-TOF mass spectra of [PEG+Na]+
: a) [PEG1000+Na]+, b) [PEG2000+Na]+, c) [PEG4000+Na]+, d) [PEG6000+Na]+. ... 90 Figure 5.6 – MALDI-TOF mass spectra of [PEG di(metha)acrylate+Na]+
: a) [PEG1000DA+Na]+, b) [PEG1000DM+Na]+, c) [PEG2000DA+Na]+, d) [PEG2000DM+Na]+, e) [PEG4000DA+Na]+, f) [PEG4000DM+Na]+, g) [PEG6000DA+Na]+, h) [PEG6000DM+Na]+. ... 91 Figure 5.7 – Thermograms (heat flow vs. temperature) of PEG1000 collected at three heating and two cooling cycles at 5 ºC min-1... 94 Figure 5.8 – Thermograms (heat flow vs. temperature) obtained for a mixture of PEG1000DM oligomer with 1wt.% of AIBN collected at the heating scan at 5 ºC min-1 and PEG1000DM polymer collected at two heating and cooling cycles at 5 ºC min-1. ... 95 Figure 5.9 – Thermograms (heat flow vs. temperature) obtained for a mixture of PEG2000DM oligomer with 1wt.% of AIBN collected at the heating scan at 5 ºC min-1 and PEG2000DM polymer collected at two heating and cooling cycles at 5 ºC min-1. ... 95 Figure 5.10 – Thermograms (heat flow vs. temperature) of PEG2000 collected at three heating and two cooling cycles at 5 ºC min-1... 96
Figure 5.11 – The electro-optical response of PDLC films prepared with 30wt.% of a) PEG1000DA, PEG1000DM, b) PEG2000DA, PEG2000DM, c) PEG4000DA, PEG4000DM, d) PEG6000DA and PEG6000DM, with 1wt.% of AIBN and 70wt.% of E7, polymerized at 70 °C overnight. The transmittance was measured by applying the electrical field (filled symbols) and after removed the electric field (open symbols). ... 97 Figure 5.12 – Polarized optical micrographs observed for PDLC samples: a) initial OFF state of PEG1000DA PDLC; b) OFF state upon removal the applied electric field of PEG1000DA PDLC; c) initial OFF state of PEG1000DM PDLC; d) OFF state upon removal the applied electric field of PEG1000DM PDLC; e) initial OFF state of PEG2000DA PDLC; f) OFF state upon removal the applied electric field of PEG2000DA PDLC; g) initial OFF state of PEG2000DM PDLC; h) OFF state upon removal the applied electric field of PEG2000DM PDLC; i) initial OFF state of
xxviii
PEG4000DA PDLC; j) OFF state upon removal the applied electric field of PEG4000DA PDLC; k) initial OFF state of PEG4000DM PDLC; l) OFF state upon removal the applied electric field of PEG4000DM PDLC; m) initial OFF state of PEG6000DA PDLC; n) OFF state upon removal the applied electric field of PEG6000DA PDLC; o) initial OFF state of PEG6000DM PDLC; p) OFF state upon removal the applied electric field of PEG6000DM PDLC, x100 magnification. ... 99
Figure 5.13 – SEM micrographs for the microstructure of the polymer matrix of PDLC films prepared with different PEG pre-polymers: a) PEG1000DA PDLC; b) PEG1000DM PDLC; c) PEG2000DA PDLC; d) PEG2000DM PDLC; e) PEG4000DA PDLC; f) PEG4000DM PDLC; g) PEG6000DA PDLC and h) PEG6000DM PDLC. ... 100 Figure 6.1 – Synthetic scheme of synthesis of Tri-armPEG with tri-methacrylate ends groups (3-armPEG TriM). ... 104 Figure 6.2 – 1
H-NMR spectrum of 3-armPEG TriM. ... 105 Figure 6.3 – 1
H-NMR spectrum of methacryloyl chloride. ... 106 Figure 6.4 – 13
C NMR spectrum of 3-armPEG TriM. ... 106 Figure 6.5 – 13
C DEPT spectrum of 3-armPEG TriM. ... 107 Figure 6.6 – COSY spectrum of 3-armPEG TriM. ... 107
Figure 6.7 – HSQC spectrum of 3-armPEG TriM. ... 108
Figure 6.8– Synthetic scheme of synthesis of tri-armPEG with acrylate ends groups (3-armPEG TriA). ... 108 Figure 6.9 – 1
H-NMR spectrum of 3-armPEG TriA. ... 109 Figure 6.10 – 13
C NMR spectrum of 3-armPEG TriA. ... 109 Figure 6.11 – 13
C DEPT spectrum of 3-armPEG TriA. ... 110 Figure 6.12 – COSY spectrum of 3-armPEG TriA. ... 110
Figure 6.13 – HSQC spectrum of 3-armPEG TriA. ... 111
Figure 6.14 – MALDI-TOF mass spectra of a) [3-armPEG+Na]+; b) [3-armPEG TriM+Na]+ c) [3-armPEG TriA+Na]+. ... 112 Figure 6.15 – Synthetic scheme of synthesis of four-armPEG with methacrylate ends groups (4-arm PEGTetraM). ... 113
xxix Figure 6.16 – 1
H-NMR spectrum of 4-arm PEGTetraM. ... 114 Figure 6.17 – 13
C NMR spectrum of 4-armPEGTetraM. ... 115 Figure 6.18 – 13
C DEPT spectrum of 4-armPEG TetraM. ... 116 Figure 6.19 – COSY spectrum of 4-armPEG TetraM... 116
Figure 6.20 – HSQC spectrum of 4-armPEG TetraM. ... 117
Figure 6.21– Synthetic scheme of synthesis of four-arm PEG with acrylate ends groups (4-armPEGTetraA). ... 117 Figure 6.22 – 1
H-NMR spectrum of 4-armPEG TetraA. ... 118 Figure 6.23 – 13
C NMR spectrum of 4-armPEG TetraA. ... 119 Figure 6.24 – 13
C DEPT spectrum of 4-armPEG TetraA. ... 120 Figure 6.25 – COSY spectrum of 4-armPEGTetraA. ... 120
Figure 6.26 – HSQC spectrum of 4-armPEGTetraA. ... 121
Figure 6.27– MALDI-TOF mass spectra of a) [4-armPEG+Na]+
; b) [4-armPEG TetraM+Na]+ c) [4-armPEG TetraA+Na]+. ... 122 Figure 6.28 – Thermogram (heat flow vs. temperature) of 3-armPEG collected at two heating and cooling cycles at 5 ºC min-1. ... 124 Figure 6.29 – Thermograms (heat flow vs. temperature) of 3-armPEG TriM oligomer + 1 wt.% of AIBN collected at the heating scan at 5 ºC min-1 (dashed lines) and for 3-armPEG TriM polymer collected at two heating and cooling cycles at 5 ºC min-1 (solid lines). ... 124 Figure 6.30 – Thermograms (heat flow vs. temperature) of 3-armPEG TriA oligomer + 1 wt.% of AIBN collected at the heating scan at 5 ºC min-1 (dashed lines) and for 3-armPEG TriA polymer collected at two heating and cooling cycles at 5 ºC min-1 (solid lines). ... 125 Figure 6.31 – Thermograms (heat flow vs. temperature) of 3-armPEG TriA oligomer + 1 wt.% of AIBN collected at the heating scan at 20 ºC min-1 (dashed lines) and for 3-arm PEG TriA polymer collected at two heating and cooling cycles at 20 ºC min-1 (solid lines). ... 126 Figure 6.32 – Thermograms (heat flow vs. temperature) of 4-armPEG collected at two heating and cooling cycles at 5 ºC min-1. ... 126
xxx
Figure 6.33 – Thermograms (heat flow vs. temperature) of 4-armPEG TetraM + 1 wt.% of AIBN collected at the heating scan at 5 ºC min-1 (dashed lines) and for 4-armPEG TetraM polymer (solid lines) collected at two heating and cooling cycles at 5ºC min-1. ... 127 Figure 6.34 – Thermograms (heat flow vs. temperature) of 4-armPEGTetraA oligomer + 1 wt.% of AIBN collected at the heating scan at 5 ºC min-1 (dashed lines) and for 4-armPEGTetraA polymer collected at two heating and cooling cycles at 5 ºC min-1 (solid lines). ... 128
Figure 6.35 – Dependence of the polymerization time on the transmittance versus applied electric field of a) armPEG TetraM(1 wt.% of AIBN)+E7 in a weight ratio of 30/70 (wt.%); b) 4-armPEG TetraA(1 wt.% of AIBN)+E7 in a weight ratio of 30/70 (wt.%); c) 3-4-armPEG TriA(1 wt.% of AIBN)+E7 in a weight ratio of 30/70 (wt.%) and d) 3-armPEG TriM (1 wt.% of AIBN)+E7 in a weight ratio of 30/70 (wt.%). ... 129
Figure 6.36 – Synthetic scheme of synthesis of Tri-armPEG-PPG with methacrylate ends groups (3-armPEG-PPG TriM). ... 133 Figure 6.37 – 1
H-NMR spectrum of 3-armPEG-PPG TriM. ... 134 Figure 6.38 – 13
C-NMR spectrum of 3-armPEG-PPG TriM. ... 135 Figure 6.39 – 13
C DEPT spectrum of 3-armPEG-PPG TriM. ... 135 Figure 6.40 – COSY spectrum of 3-armPEG-PPG TriM. ... 136
Figure 6.41 – HSQC spectrum of 3-armPEG-PPG TriM. ... 136
Figure 6.42 – Synthetic scheme of synthesis of Tri-armPEG-PPG with acrylate ends groups (3-arm PEG-PPG TriA). ... 137 Figure 6.43 – 1
H-NMR spectrum of 3-armPEG-PPG TriA. ... 137 Figure 6.44 – 13
C-NMR spectrum of 3-armPEG-PPG TriA. ... 138 Figure 6.45 – 13
C DEPT spectrum of 3-armPEG-PPG TriA. ... 139 Figure 6.46 – COSY spectrum of 3-armPEG-PPG TriA. ... 139
Figure 6.47 – HSQC spectrum of 3-armPEG-PPG TriA. ... 140
Figure 6.48 – MALDI-TOF mass spectra of a) [3-armPEG-PPG+Na]+; b) [3-armPEG-PPG TriM+Na]+ c) [3-armPEG-PPG TriA+Na]+. ... 141
xxxi Figure 6.49 – Crossed Polarized optical micrographs observed for PDLC samples prepared with 3-armPEG-PPG TriM with 1wt.% of AIBN and E7 with weight ratios of a) 30/70 (wt.%) and b) 40/60 (wt.%), x100 magnification. ... 142 Figure 6.50 – Crossed Polarized optical micrographs observed for PDLC samples prepared with 3-arm PEG-PPGTriA with 1wt.% of AIBN and E7 with weight ratios of a) 30/70 (wt.%) and b) 40/60 (wt.%), x100 magnification. ... 143
Figure 6.51 – Thermogram (heat flow vs. temperature) of 3-armPEG-PPG collected at two heating and cooling cycles at 5 ºC min-1. ... 143
Figure 6.52 – Thermograms (heat flow vs. temperature) of 3-armPEG-PPG TriA + 1wt.% of AIBN collected at the heating scan at 5 ºC min-1 (dashed lines) and for 3-armPEG-PPG TriA polymer (solid lines) collected at two heating and cooling cycles at 5 ºC min-1. ... 144
Figure 6.53 – Thermograms (heat flow vs. temperature) of 3-armPEG-PPG TriM + 1wt.% of AIBN collected at the heating scan at 5 ºC min-1 (dashed lines) and for 3-armPEG-PPG TriM polymer (solid lines) collected at two heating and cooling cycles at 5 ºC min-1. ... 144
Figure 7.1 – Conoscopic images of a) homeotropic aligned of E7 and b) homogeneous alignment of E7... 149
Figure 7.2 – The effect of the alignment layer on electro-optical (transmittance-electrical field) properties of PDLCs prepared by PEGDM875 (1 wt.% of AIBN)+E7 in a weight ratio of 30/70 (wt.%) and polymerized at 70 ºC, overnight: a) lecithin-PDLC cell cell (23 μm thick); b) ITO-PDLC cell (23 μm thick); c) commercial LC20-ITO-PDLC cell (20 μm thick); d) perpendicular-ITO-PDLC (23 μm thick); e) Parallel-PDLC (23 μm thick) and f)anti-parallel-PDLC (23 μm thick). ... 150
Figure 7.3 – Schematics of the arrangement of the pre-polymer and liquid crystal in a) homogeneous alignment-PDLC cell; b) homeotropic alignment-PDLC and c) random planar alignment- PDLC cell145,146. ... 151 Figure 8.1 – Top view of a schematic representation of the working principle of optical storage materials in an 8 x 8 passive matrix using PDLC with permanent memory effect units (rows of electrodes on one piece of glass and columns of electrodes on the opposing piece of glass). 153 Figure 8.2 – Photodisintegration of the photoactive compound and subsequent reactions1
. ... 155 Figure 8.3 – Image of line-shaped ITO electrodes coated on the glass substrate. ... 156
Figure 8.4 – Schematic illustration of photolithography process for making line-shaped ITO electrodes covered with polyimide. ... 156
xxxii
Figure 8.5 – Schematic illustration of the line thickness measure (a) and line thickness profile (b). ... 157
Figure 8.6 – Photographs of direct observation of the macroscopic performance of PDLC display example in an 8x8 passive matrix: Electrically written at 1 KHz with an applied voltage of a) 0 VRMS, b) 75.3 VRMS, c) 254.4 VRMS and d) after the applied voltage is switched off. ... 158
Figure 8.7 – Photographs of direct observation of the macroscopic performance of PDLC display example in an 8x8 passive matrix, demonstrating the electrically written information effect at 1 KHz with an applied voltage of a) 126.2 VRMS and in b) after the applied voltage is switched off. ... 159 Figure 9.1 – PDLC transmittance variation in time depending on turn-on time by Joule heating effect with electrical current intensity at 0.10 A; 0.12 A; 0.15 A and 0.18 A and turn-off time after Joule heating effect during cooling for each electrical current intensity applied. Solid lines denote to the application of the Joule heating effect and dotted lines denote to the cooling period of time. The PDLC sample was prepared by commercial Instec LC cell (20 μm of thickness) filled with PEGDM875 (1 wt. % of AIBN) + E7 in a ratio of 30/70 (wt.%) mixture thermally polymerized at 70 ºC, overnight... 163
Figure 9.2 – Three repetition of PDLC transmittance variation in time depending on the Joule heating effect with electrical current intensity at 0.15 A and turn-off time after Joule heating by cooling treatment. Solid lines denote to the application of the Joule heating effect and dotted lines denote the cooling period of time. The PDLC sample was prepared in commercial Instec LC cell (20 μm of thickness) filled with PEGDM875 (1 wt. % AIBN) +E7 in a ratio of 30/70 (wt. %) mixture thermally polymerized at 70 ºC, overnight. ... 164 Figure 12.1 – 1 H-NMR spectrum of PEG2000DM. ... 173 Figure 12.2 – 13 C-NMR spectrum of PEG2000DM. ... 173 Figure 12.3 – 1 H-NMR spectrum of PEG4000DM. ... 174 Figure 12.4 – 13 C-NMR spectrum of PEG4000DM. ... 174 Figure 12.5 – 1 H-NMR spectrum of PEG6000DM. ... 175 Figure 12.6 – 13 C-NMR spectrum ofPEG6000DM. ... 175 Figure 12.7 – 1 H-NMR spectrum of PEG1000DM. ... 176 Figure 12.8 – 13 C-NMR spectrum of PEG1000DM. ... 176
xxxiii Figure 12.9 – 13
C DEPT spectrum of PEG1000DM. ... 177 Figure 12.10 – COSY spectrum of PEG1000DM. ... 177
Figure 12.11 – HSQC spectrum of PEG1000DM... 178
Figure 12.12 – 1 H-NMR spectrum of PEG2000DA. ... 178 Figure 12.13 – 13 C-NMR spectrum of PEG2000DA. ... 179 Figure 12.14 – 1 H-NMR spectrum of PEG4000DA. ... 179 Figure 12.15 – 13 C-NMR spectrum of PEG4000DA. ... 180 Figure 12.16 – 1 H-NMR spectrum of PEG6000DA. ... 180 Figure 12.17 – 13 C-NMR spectrum of PEG6000DA. ... 181 Figure 12.18 – 1 H-NMR spectrum of PEG1000DA. ... 181 Figure 12.19 – 13 C-NMR spectrum of PEG1000DA. ... 182 Figure 12.20 – HSQC spectrum of PEG1000DA. ... 182
Figure 12.21 – 13
C DEPT NMR spectrum of PEG1000DA. ... 183 Figure 12.22 – COSY spectrum of PEG1000DA. ... 183
Figure 12.23 – Dependence of the polymerization time on the transmittance versus applied electric field of a) ((25 wt.% 4-armPEGTetraM, 75 wt.% PPGM )(1 wt.% AIBN))+E7 in a ratio of 30/70 (wt.%); b) ((50 wt.% 4-armPEG TetraM, 50 wt.% PPGM )(1 wt.% AIBN))+E7 in a ratio of 30/70 (wt.%); c) ((75 wt.% 4-armPEG TetraM, 25 wt.% PPGM )(1 wt.% AIBN))+E7 in a ratio of 30/70 (wt.%). ... 186
Figure 12.24 – Dependence of the polymerization time on the transmittance versus applied electric field of a) ((25 wt.-% 4-armPEG TetraA, 75 wt.-% PPGM )(1 wt.% AIBN))+E7 in a ratio of 30/70 (wt.%); b) ((50 wt.% 4-armPEG TetraA, 50 wt.% PPGM )(1 wt.% AIBN))+E7 in a ratio of 30/70 (wt.%) and c) ((75 wt.% 4-armPEG TetraA, 25 wt.% PPGM )(1 wt.% AIBN))+E7 in a ratio of 30/70 (wt.%). ... 186
Figure 12.25 – Dependence of the polymerization time on the transmittance versus applied electric field of a) ((25 wt.-%3-armPEGTriA, 75 wt.% PPGM )(1 wt.% AIBN))+E7 in a ratio of 30/70 (wt.%);b) ((50 wt.% 3-arm PEG TriA, 50 wt.% PPGM )(1 wt.% AIBN))+E7 in a ratio of
xxxiv
30/70 (wt.%) and c) ((75 wt.% 3-armPEG TriA, 25 wt.% PPGM )(1 wt.% AIBN))+E7 in a ratio of 30/70 (wt.%). ... 186
Figure 12.26 – Dependence of the polymerization time on the transmittance versus applied electric field of a) ((25 wt.% 3-armPEG TriM, 75 wt.% PPGM )(1wt.% AIBN))+E7 in a ratio of 30/70 (wt.%);b) ((50 wt.% 3-arm PEG TriM, 50 wt.% PPGM )(1 wt.% AIBN))+E7 in a ratio of 30/70 (wt.%) and c) ((75 wt.% 3-arm PEG TriM, 25 wt.% PPGM)(1 wt.% AIBN))+E7 in a ratio of 30/70 (wt.%). ... 187
xxxv List of Tables
Table 1.1– Physical properties of isolated compounds in an LC mixture known as E79,14
. ... 18 Table 3.1 – Electro-optical properties for PDLC films prepared with TriEGDMA, TetraEGDMA, PolyEGDMA550 and PolyEGDM875 and E7 with weight ratios of 30/70 (wt. %), and 1 wt. % of AIBN by weight with respect to the pre-polymer. ... 57 Table 3.2 – Nematic to isotropic transition temperatures (TNI) determine by POM under crossed polarized during heating a rate of 1 ºC min-1 from 25 to 70 ºC, for TriEGDM/E7, TetraEGDM/E7, PEGDM550/E7, PEGDM875/E7 PDLCs and for pure LC E7. ... 59 Table 3.3 – Normalized peak area (area of the aromatic peaks between 127.2 and 129.5 ppm = 1) for nematic LC E7 and for the two different PDLCs TriEGDMA + E7 and PolyEGDM875 + E7. The increment percentage is calculated having the area of each peak obtained using HPDEC as a reference... 65 Table 4.1 – Percentage of PME and E90 obtained by the electro-optical measurements of PDLC films polymerized at different cure temperatures (55, 60, 66, 70, 74, 80 and 90 ºC). ... 76 Table 5.1 – The theoretical and observed molecular weights of starting material [PEG+Na]+
and resulting products obtained from MALDI-TOF measurements for the main series of peaks. ... 92
Table 5.2 – Calculated and experimental mass m(n) of the most intense peak in each [macromolecule+Na]+ spectrum. ... 93
Table 5.3 – The theoretical and observed molecular weights of [PEG2000A+Na]+, [PEG4000A+Na]+ and [PEG4000M+Na]+ obtained from MALDI-TOF measurements for minor series of peaks (if only one end of PEG was functionalized). ... 93 Table 5.4 – Electro-optical properties of the PDLCs films prepared from 30wt.% of PEG pre-polymer with 1wt.% of AIBN and 70wt.% of E7. ... 98 Table 6.1– The theoretical and observed molecular weights of [3-armPEG+Na]+
and resulting products, [3-armPEG TriM+Na]+ and [3-armPEG TriA+Na]+ obtained from MALDI-TOF measurements. ... 113 Table 6.2 – The theoretical and observed molecular weights from MALDI-TOF measurements for minor series of peaks in [3-armPEG TriM+Na]+ spectrum. ... 113
xxxvi
Table 6.3 – The theoretical and observed molecular weights of [4-armPEG+Na]+ and resulting spectra products obtained, [4-armPEG TetraM+Na]+ and [4-armPEG TetraA+Na]+, from MALDI-TOF measurements for the main series of peaks. ... 123
Table 6.4– The theoretical and observed molecular weights of tri-functionalized species cationized with Na+obtained from MALDI-TOF measurements of minor series in [4-armPEG TetraM+Na]+ spectrum (if only three ends of 4-armPEG were functionalized). ... 123 Table 6.5 – Composition of samples for PDLCs films preparation by co-polymerization. ... 131
Table 6.6 – Electro-optical properties of PDLCs prepared by co-polymerization. ... 132
Table 6.7 – The theoretical and observed molecular weights of [3-armPEG-PPG+Na]+ and resulting spectra products obtained, [3-armPEG-PPG DiM+Na]+ and [3-armPPG-PEG TriA+Na]+, from MALDI-TOF measurements. ... 142
Table 6.8 – Nematic to isotropic transition temperatures determine by POM under crossed polarized during heating at the rate of 1 ºC min-1 from 25 to 70 ºC for 3-armPPG-PEG TriA polymer/E7 and 3-armPPG-PEG TriM polymer/E7 PDLCs. ... 145 Table 8.1– Specifications of passive matrix PDLC device. ... 157
Table 12.1 – Thermal properties of PEG macromolecules obtained by DSC during two cooling/heating cycles. Tg: glass transition temperature; Tm: melting temperature; Tc: crystallization temperature, ∆Hm and ∆Hc: melting and crystallization enthalpies, respectively. ... 184
Table 12.2 – Thermal properties of multi-functional PEG obtained by DSC during two cooling/heating cycles. Tg: glass transition temperature; Tm: melting temperature; Tc: crystallization temperature; TCC: cold-crystallization temperature; ∆Hm and ∆Hc: melting and crystallization enthalpies, respectively. ... 185
xxxvii List of Symbols and Abbreviations
8OCB 4,4´-n-octyloxycyanobiphenyl
5CT 4´n-pentyl-4-cyanoterphenyl
5CB 4-cyano-4´-pentyl-1,1´-biphenyl
7CB 4-n-heptyl-4´cyanobiphenyl
AC Alternating Current
n|| An alternative designation for the extraordinary refractive index of the nematic liquid crystal (ne)
n An alternative designation for the ordinary refractive index of the nematic liquid crystal (no)
A Ampere
Bit Binary digit
13
C-NMR Carbon Nuclear Magnetic Resonance Spectroscopy
TCC Cold-crystallization temperature
COSY Correlation spectroscopy
J Coupling constant Tc Crystallization temperature Tcc Cold-crystallization temperature Da Dalton CDCl3 Deuterated chloroform ∆ε Dielectric anisotropy
ε|| Dielectric constants according to the direction parallel to the director
ε Dielectric constants according to the direction perpendicular to the director
xxxviii
𝑝⃗|| Dipole moment vector parallel to the molecular axis
𝑝⃗ Dipole moment vector perpendicular to the molecular axis
DC Direct Current
𝑛⃗⃗ Director of the liquid crystal
DEPT Distortionless Enhancement by Polarization Transfer spectroscopy
dd Double doublet
d Doublet
E90 Electric field required for the PDLC reaches 90% of its maximum transmittance
ε Electric permittivity
P Electric Power
I Electrical Current Intensity
ne Extraordinary refractive index of the nematic liquid crystal
Tg Glass transition temperature
HSQC Heteronuclear Single Quantum Correlation Spectroscopy
HPDEC High Power Proton Decoupling Pulse Sequence spectroscopy
H-PDLC Holographic PDLC
ITO Indium Tin Oxide
α|| Induced dipole moments per unit electric field parallel to the molecular axis
α Induced dipole moments per unit electric field perpendicular to the molecular axis
IPS In-Plane Switching
LEDs Light Emitting Diodes
xxxix LCD Liquid Crystal Display
TMAX Maximum transmittance of PDLC during electric field ON
Tm Melting temperature
MSC Memory state contrast
mW cm-2 Milliwatts per square centimeter
T0 Minimum transmittance for the initial opaque state of PDLC at electric field off
AIBN N,N-azobisisobutyronitrile
E7 Nematic liquid crystal from Merck
TNI Nematic to isotropic transition temperature
Mn Number average molecular weight
∆n Optical anisotropy
no Ordinary refractive index of the nematic liquid crystal
ppm Parts per million
wt.% Percentage by weight
PME Permanent Memory Effect
POM Polarized Optical Microscopy
PEG Poly(ethylene glycol)
PPGA Poly(Propylene Glycol)Acrylate
PPGM Poly(Propylene Glycol)Methacrylate
PDI Polydispersity index
PDLC Polymer Dispersed Liquid Crystal
xl 1
H-NMR Proton Nuclear Magnetic Resonance Spectroscopy
ni Refractive index of the nematic liquid crystal in the isotropic phase
np Refractive index of the polymer
R Resistance
VRMS Root Mean Square Voltage
SEM Scanning Electron Microscopy
s Singlet
13
C CPMAS Solid State Cross-Polarization Magic Angle Spinning carbon spectroscopy 13
C MAS Solid State Magic Angle Spinning carbon spectroscopy
SIPS Solvent-Induced Phase Separation
v Speed of light in the material
c Speed of light in vacuum
STN Super Twisted Nematic
TMS Tetramethylsilane
TIPS Thermally Induced Phase Separation
TFT Thin Film Transistor
TLC Thin Layer Chromatography
Vth Threshold Voltage
TOFF Transmittance of PDLC after removing electric field
NEt3 Triethylamine
TN Twisted Nematic
1
Chapter I
1
Liquid Crystal Fundamentals and Applications
1.1
Basic Types and Structures of Liquid Crystals
Liquid crystals (LC) are compounds with properties between crystalline solid and isotropic liquid. This is due to the fact that they exhibit optical birefringence as crystalline solids and can flow and not support shearing as isotropic liquids. In this way, LC are liquids but with properties of crystalline solids. A stable LC phase known as mesophase is characterized by having a degree of molecular order intermediate between the orientational and positional order of crystalline solids and the disorder of isotropic liquids1.
1.2
Classification of Liquid Crystals
LCs can be divided into two principal groups according to the parameters that influence the phase transitions. The thermotropic LCs, when the most relevant parameters are temperature and pressure and therefore mesophases are stable at defined temperatures and pressures1,2 and the so-called lyotropic LCs when the mesophases are formed by molecules dissolved in an appropriate solvent in a suitable concentration. Lyotropic LCs usually consist of amphiphilic molecules with two distinct parts: a hydrophilic polar group and a hydrophobic nonpolar group often a hydrocarbon tail. In high enough concentration amphiphilic molecules form ordered structures, molecules arranged themselves such either the polar ends are turned out in a polar solvent or the nonpolar ends are turn out in a nonpolar solvent. For instance, in a polar solvent such as water, the hydrophobic tails arranged together and present the hydrophilic heads to the solvent (Figure 1.1)1,3,4. For low concentration, the amphiphilic molecules distributed randomly throughout the solvent and on interfaces.
Figure 1.1 – Schematic illustration of aggregate morphologies of lyotropic liquid crystals: a) cylinder; b) sphere and c) lamellar phases (adapted from3).
2
The lyotropic LCs are present in human body cells, brain, nerves, muscles and blood and they are important in biologic functions. For example, organ membranes that are lyotropic LC must be fluid but must maintain structural order. In this way, this type of LC has the fluidity necessary to allow diffusion (proteins and enzymes) keeping the required molecular structure 5. However, they are not used in technical applications1. Therefore this type of mesophase is not discussed in this work. In this way, more details of thermotropic LCs will be referred which are important for technical applications.
1.3
Phase Structures of Calamitic and Discotic Liquid Crystals
Organic compounds with shape anisotropy are able to form thermotropic mesophases. In this way, two principal types of molecules can be identified: ellipsoid or rod-like and discoid molecules. Ellipsoid or rods like molecules give rise to calamitic LCs, which include nematic and smectic LCs. Discoid molecules produce nematic-discotic and columnar LCs. A typical calamitic crystal molecule is 4´-n-pentyl-4-cyano-biphenyl (5CB) and can be regarded as a cylinder (Figure 1.2 a). A typical discotic LC molecule has a rigid core of aromatics surrounded by flexible chains and the molecular shape can be compared to a disk (Figure 1.2 b)1,2.
Figure 1.2 – Molecular structures and their templates: a) calamitic liquid crystal molecule and b) discotic liquid crystal molecule (adapted from1).
1.3.1 Phase Structures of Calamitic LCs
The transitions that could involve rod-like molecules are shown in Figure 1.3. At high temperatures, the molecules are in an isotropic liquid state where they do not have either positional or orientational order. When the temperature decreases reaching the nematic to isotropic transition temperature (TNI), the material transforms into the nematic phase, which is the most common and simplest LC phase. In this phase, the molecules have orientational order but there is no long-range positional ordering of the molecules. The rod-like molecules tend to align parallel to each other (spontaneous parallel orientation of the molecules) and roughly in
3 the same direction. The average molecular orientation of molecules is denoted by LC director (𝑛⃗⃗)1,2
.
Figure 1.3 – Schematic representation of the sequence of phase transition exhibited by rod-like molecules between a crystalline solid and an isotropic liquid by increasing temperature (adapted from1). Tm is the melting transition temperature, TSC-SA is the smectic-C to the smectic-A transition temperature, TSA-N is the Smectic-A to the nematic transition temperature and TNI is nematic to the isotropic transition temperature. When the temperature continues to decrease the material could reach the smectic phase. In this phase besides the orientational order, the molecules form a layered structure (partial positional order). The lamellar smectic state is classified in subgroups according to the degree of the in-plane positional ordering of the molecules and the tilt orientational ordering of the long axes of the molecules relative to the layer planes. However, the smectic A and smectic C phases are the most common and have been utilized in display devices2. In the smectic A phase, the molecules are arranged in layers where the LC director is perpendicular to the layers. The layers can also be organized in semi-bilayer and bilayer structures. This is because of molecules with terminal polar groups, for example, cyano group could interact with the ends of the central cores of adjacent molecules1,2.
When the temperature is decreased further, the material may transform into the smectic C phase, where the molecules continue arranged in diffuse layers but the LC director is tilted relative to the layer (no longer perpendicular to the layer as smectic-A phase)1,2. As the smectic-A phase, other sub-phases of the smectic C phase can also be found2.
At low temperature, the translational viscosity becomes high and the molecules almost do not diffuse. In this way, the material is in the crystal solid phase where there are both positional and orientational orders. However, not all rod-like molecules exhibit all the LC phases presented in Figure 1.3 they may exhibit only some of the LC phases1.
The calamitic nematic LC is the less ordered mesophase which results in lower viscosity. These properties allow this LC type to respond more sensitively to the external applied electric field when compared with more ordered mesophases (like smectic mesophase). The application of an electric field could not induce enough change in the optical properties of a smectic LC for
4
display applications. For this reason, calamitic nematic LCs are the most chosen LC for this type of applications5–7.
LCs were discovered in 1888 by Austrian botanist Friedrich Reinitzer. At 145.5 ºC cholesteryl benzoate melted from a solid to a cloudy liquid and when temperature continues to increase until 178.5 ºC it became a clear liquid. While temperature decreased a pale blue color appeared as the clear liquid turned cloudy and then a bright blue-violet color as the cloudy liquid crystallized. Later, a German physicist Lehmann studied with a polarized optical microscope and observed that the sample can flow like liquids also exhibit optical properties such as crystals. In this way, these studies established a new thermodynamic state of matter. Lehman first called this new state flowing crystal and later on liquid crystals. The LC that Reintzer observed is a chiral LC. One example of chiral LC is known as CB15 shown in Figure 1.45.
Figure 1.4 – Molecular structure of a chiral liquid crystal (CB15).
The structure of chiral calamitic mesophase consists of chiral molecules where they are aligned parallel to each other with the long axis in a plane (similarly to non-chiral nematic phase). However, different orientation of the molecules describes a helical distortion of the LC director along the structure as shown in Figure 1.5. The average orientation within each layer delineates a spiral molecular orientational along the structure5. The axis around which the director twists is called helical axis and the distance over which the director rotates by 360º is called the pitch1.
Figure 1.5 – Schematic illustration of the molecular orientation in a chiral calamitic mesophase. The director (n⃗⃗) within each layer delineates a spiral molecular orientational along the structure (adapted from5).
If the pitch length is in order of the wavelength of visible light, light can be selectively reflected. The pitch length is temperature dependent. In general, at higher temperatures due to the higher thermal energy the angle at which the director changes are larger and so the pitch is straight.
5 However, when temperature decreases the pitch length increases changing the colors selectively reflected7.
In this way, the color of cholesteric LCs changes with temperature which enables thermographic applications, for example, in the thermal mapping of human skin for the diagnosis of circulatory diseases or the detection of tumors. In industrial applications for direct temperature diagrams, detection of wave fields, locating faults in electronic devices and for thermally activated information display8.
1.3.2 Phase Structure of the Discotic Liquid Crystal
Some of the LC phases of disk-like molecules are shown in Figure 1.6. At high temperatures, molecules are in the isotropic liquid state where there is no positional and orientational order. When the temperature is decreased, the material transforms into the discotic nematic phase which has orientational order but not positional order. The planes of the disc-like shape molecules are roughly parallel to one another, although the molecules have no positional order. The director is normal to the planes of the discs-like molecules2.
When the temperature continues to decrease the material transforms into the columnar phase like stacks of disc-like molecules. In this phase, in additional to orientational order there is also a partial positional order. Finally, at low temperature, the material transforms into the crystalline solid phase where beside long-range order the positional order along the columns is achieved. The molecules are normal to the column axis1. The columns in columnar and in crystal solid can be hexagonally or orthorhombically closely packed together2.
Figure 1.6 – Schematic representation of the sequence of phase transition exhibited by discotic molecules between a crystalline solid and isotropic liquid by increasing the temperature (adapted from1). Tm is the melting transition temperature, TCN is the columnar to the nematic transition temperature and TNI is the nematic to the isotropic transition temperature.
Chirality in a discotic phase can be achieved by the incorporation of a chiral unit into one or more flexible chains that surround the benzene groups (discotic core)1,2.