UNIVERSIDADE TÉCNICA DE LISBOA
Faculdade de Medicina Veterinária
VARIATIONS IN THE VULVAR TEMPERATURE OF SOWS AS DETERMINED BY INFRARED THERMOGRAPHY AND ITS RELATION TO OVULATION
VASCO JORGE GASPAR SIMÕES
CONSTITUIÇÃO DO JÚRI ORIENTADOR
Doutora Graça Maria Leitão Ferreira Dias Doutor Guy-Pierre Martineau Doutora Luísa Maria Freire Leal Mateus
Doutor Fernando Jorge Silvano Boinas CO-ORIENTADOR
Doutor Guy-Pierre Martineau Doutor Fernando Jorge Silvano Boinas
2012 LISBOA
UNIVERSIDADE TÉCNICA DE LISBOA
Faculdade de Medicina Veterinária
VARIATIONS IN THE VULVAR TEMPERATURE OF SOWS AS DETERMINED BY INFRARED THERMOGRAPHY AND ITS RELATION TO OVULATION
VASCO JORGE GASPAR SIMÕES
DISSERTAÇÃO DE MESTRADO EM MEDICINA VETERINÁRIA
CONSTITUIÇÃO DO JÚRI ORIENTADOR
Doutora Graça Maria Leitão Ferreira Dias Doutor Guy-Pierre Martineau Doutora Luísa Maria Freire Leal Mateus
Doutor Fernando Jorge Silvano Boinas CO-ORIENTADOR
Doutor Guy-Pierre Martineau Doutor Fernando Jorge Silvano Boinas
2012 LISBOA
i
To my grandfather Abílio. May I, one day, be the man he once was.
iii
Acknowledgements
Firstly, to Prof. Dr. Guy-Pierre Martineau, my supervisor and professor in swine medicine in the National Veterinary School of Toulouse (ENVT), France, for accepting me as an intern, for his enthusiastic way to face every challenge and for the will to share all his knowledge. A truly inspiring reference, from both a professional and personal point of view.
Secondly, to Prof. Dr. Fernando Boinas, my co-supervisor and professor in the Faculty of Veterinary Medicine, Technical University of Lisbon, for all his support in the elaboration of this thesis. His professionalism and dedication honor our institution.
Prof. Dr. Agnès Waret Szkuta, for all the support and friendship during my internship. Prof. Dr. Nicole Hagen-Picard and Prof. Dr. Veronique Gayrard, for their invaluable help in the planning and realization of ultrasonography in this project. Prof. Dr. Faouzi Lyazrhi, professor of biostatistics in the ENVT, for helping me deal with the statistic and for all the shared knowledge in this area. Without the support of this team, this project would not be possible.
To my parents, for supporting this journey of 6 years, for their advices and warnings. For their efforts to give me the opportunities they never had.
To the Souvestre family, a truly example of what a family should be. For all their help in my integration in a foreign country, making me feel as if I was at home.
To all the friends from FMV and ENVT, with a special reference to Ângelo Pitães, Joel Mendes and Rui Silva, for lightening me the luggage when it seemed too heavy. This was not a one-man job, and my success is also yours.
To all the people who I did not mentioned but, directly or indirectly, contributed to the realization of this project, my sincere gratitude.
Finally, to Abílio Gaspar, my grandfather, best friend and a truly life example. For teaching me how to love and respect animals and nature. For being my inspiration for many, many years. Keep looking for me up there.
v
Abstract
VARIATIONS IN THE VULVAR TEMPERATURE OF SOWS AS DETERMINED BY INFRARED THERMOGRAPHY AND ITS RELATION TO OVULATION.
The productive results of a pig’s herd are closely related to the reproductive performance of their animals. Although in the last years several techniques were implemented to improve the reproductive efficiency of pig production, such as artificial insemination (AI) and estrus synchronization, the prediction of ovulation continues to be made with some degree of uncertainty due to the lack of an accurate, practical and fast technique.
In this experimental study, we tested the applicability of infrared thermography (IRT) for ovulation prediction, based on the variations observed in the vulvar skin temperature (VST) during the proestrus and estrus period. The group tested was composed by 36 crossbred Large White x Landrace females, of which 6 gilts and 30 multiparous sows. Estrus detection was performed twice daily in the morning and afternoon, starting one day after weaning (day 1). Temperature measurements were performed every 6 hours at 0000h, 0600h, 1200h and 1800h, from day 1 to day 7. Temperature was obtained from the vulvar area and from two marked spots in the gluteal area (GST), which worked as a control. A third variable (VGT) was obtained from the differential temperature between VST and GST. Ovary ultrasonography was performed in days 5 and 6, in order to detect ovulation; however, the exams were inconclusive and so a theoretical diagnosis of ovulation had to be established based on the weaning-to-estrus interval and the duration of estrus.
The statistical analysis focused mainly in the VGT of two sub-groups of animals, starting estrus at days 4 and 5. The VGT increased progressively during the proestrus (p = 0.003 and p=0.017), reaching a peak 61 ± 10.8 h and 82 ± 6.6 h before expected time of ovulation (eOv) in group D4 and D5, respectively. After this point, it decreased significantly (p = 0.002), reaching a lowest point 25 ± 10.8 h and 28 ± 6.6 h before eOv. Although the occurrence of ovulation could not be determined but only estimated, we believe the variations found in the VGT reflect the variations in the estradiol blood levels that will, indirectly, lead to the occurrence of ovulation. Even if no statistical relationship between vulvar temperature and ovulation could be established, the results suggest that these temperature variations may be indirectly related to the occurrence of ovulation.
vii
Resumo
VARIAÇÕES NA TEMPERATURA VULVAR EM PORCAS DETERMINADAS POR TERMOGRAFIA DE INFRAVERMELHOS E A SUA RELAÇÃO COM OVULAÇÃO
Os resultados produtivos de uma exploração de suínos estão intimamente relacionados com o desempenho reprodutivo dos seus animais. Apesar de nos últimos anos várias técnicas terem sido implementadas com vista a melhorar a eficiência deste sector, como inseminação artificial e sincronização do estro, prever a ocorrência de ovulação continua a envolver um certo grau de incerteza, dada a inexistência de uma técnica precisa, prática e rápida.
Neste estudo experimental foi testada a aplicabilidade da termografia de infravermelhos (IRT) para predição da ovulação, tendo por base as variações de temperatura registadas ao nível da região vulvar (VST) ao longo do pró-estro e estro. O grupo-teste era composto por 36 porcas cruzadas Large White x Landrace, das quais 6 eram marrãs e 30 porcas multíparas. A detecção do estro iniciou-se 1 dia após o desmame (dia 1), sendo realizada duas vezes por dia, de manhã e à tarde. As medições de temperatura foram realizadas a intervalos de 6 horas, às 0000h, 0600h, 1200h e 1800h, entre o dia 1 e dia 7. Foi avaliada a temperatura vulvar e de 2 pontos marcados na região gluteal (GST) que desempenharam o papel de controlos. Uma terceira variável (VGT) foi obtida a partir do diferencial de temperatura entre a VST e GST. Com vista a detectar a ovulação, foram realizadas ecografias aos ovários durante os dias 5 e 6; no entanto, os resultados foram inconclusivos, pelo que a ocorrência de ovulação foi estimada a partir do intervalo desmame-estro e duração do estro.
A análise estatística centrou-se sobretudo na variável VGT de dois sub-grupos, compreendendo animais com início de estro no dia 4 e dia 5. A VGT aumentou durante o pró-estro (p=0.003 e p=0.017 para os grupos D4 e D5), atingindo um pico 61 ± 10.8 h and 82 ± 6.6 h antes da ocorrência estimada de ovulação (eOv). De seguida, diminuiu significativamente (p=0.002), atingindo um valor mínimo 25 ± 10.8 h e 28 ± 6.6 h antes da ocorrência estimada da ovulação. Ainda que a ovulação não possa ter sido determinada com rigor, entendemos que as variações observadas na VGT reflectem as variações nos níveis sanguíneos de estradiol que, indirectamente, vão levar à ovulação. Assim, apesar não ter sido demonstrada uma relação inequívoca, os nossos resultados apontam para uma possível relação indirecta entre as variações de temperatura vulvar e a ovulação.
ix
Table of contents
1. Internship report ... 1
2. Introduction ... 3
2.1. Reproductive management as a key factor in the pig’s production ... 4
2.2. Goals of this study ... 5
3. Literature Review ... 6
3.1. Anatomy of the reproductive organs ... 6
3.2. Physiology of the estrous cycle ... 9
3.2.1. Phases of the estrous cycle ... 9
3.3. Estrus expression ... 13
3.3.1. Physiological Signs ... 14
3.3.2. Behavioral Signs ... 15
3.4. Alternative methods for estrus detection ... 17
3.4.1. Non-automated methods ... 18 3.4.2. Automated methods ... 18 3.5. Ultrasonography ... 20 3.5.1. Historical background... 20 3.5.2. Basic principles ... 21 3.5.3. Instrumentation ... 22
3.5.4. Applications of ultrasonography in swine industry ... 23
3.6 Infrared thermography ... 26
3.6.1. Historical background... 26
3.6.2. Physical principles ... 27
3.6.3. Pros and cons of IRT ... 28
3.6.4. Applications of IRT ... 28
4. Materials & Methods ... 32
4.1. Animals and Housing ... 32
4.2. Detection of estrus ... 33
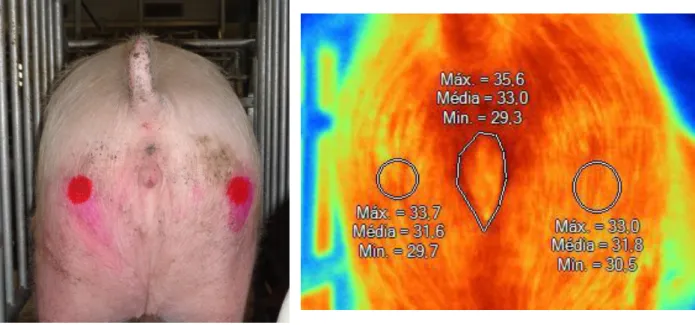
4.3. Thermal imaging ... 33
4.4. Real-time Ultrasound ... 35
4.5. Statistical Analysis ... 36
5. Results and Discussion ... 39
5.1. Validation of the skin temperature measurements ... 39
5.2. Characterization of estrus ... 42
5.3. Temperature profiles... 46
5.4. Ovulation diagnosis with ultrasonography ... 60
5.5. Alternative methods to estimate occurrence of ovulation ... 66
5.6. Relationship between temperature variations and ovulation ... 67
6. Conclusions ... 71
7. References... 73
Annex ... 92
Annex 1: One-way ANOVA for the repeatability test. ... 92
Annex 2: Correlation tests and linear regression analysis between weaning-to-estrus interval and duration of estrus. ... 94
Annex 3: Student’s t-test comparing the vulvar skin temperature of the measurements obtained at 0600 h and 1800 h ... 95
x
Annex 4: Student’s t-test comparing the gluteal skin temperature of the measurements obtained at 0600 h and 1800 h ... 96 Annex 5: Correlation tests and linear regression analysis between vulvar skin temperature and room temperature ... 97 Annex 6: Correlation tests and linear regression analysis between gluteal skin temperature and room temperature ... 98 Annex 7: Student’s t-test comparing the vulvar skin temperature of gilts and sows, before and during estrus. ... 99 Annex 8: Student’s t-test comparing the gluteal skin temperature of gilts and sows. ... 102 Annex 9: Student’s t-test comparing the vulvar skin temperature before and during estrus in all animals. ... 103 Annex 10: One-way ANOVA to infer the evolution of vulvar skin temperature of all animals along the trial ... 104 Annex 11: One-way ANOVA to infer the evolution of gluteal skin temperature of all animals along the trial ... 106 Annex 12: CD-ROM containing the complementary annexes ... 108
xi
List of Figures
Figure 1 - Distribution of numbers of fattening pigs by herd size in the European Union .... 3
Figure 2 - Anatomy of the reproductive tract of a sow and adjacent structures ... 6
Figure 3 - Phases of the estrous cycle and hormonal profiles ... 10
Figure 4 - Events occurring during proestrus that lead to the preovulatory LH surge ... 11
Figure 5 - Vulva of gilt in proestrus, with obvious reddening and swelling ... 14
Figure 6 - Female in estrus showing “ear popping” ... 16
Figure 7 - Female in standing reflex ... 16
Figure 8 - Electromagnetic spectrum ... 27
Figure 9 - Comparison between a normal and a thermal image ... 34
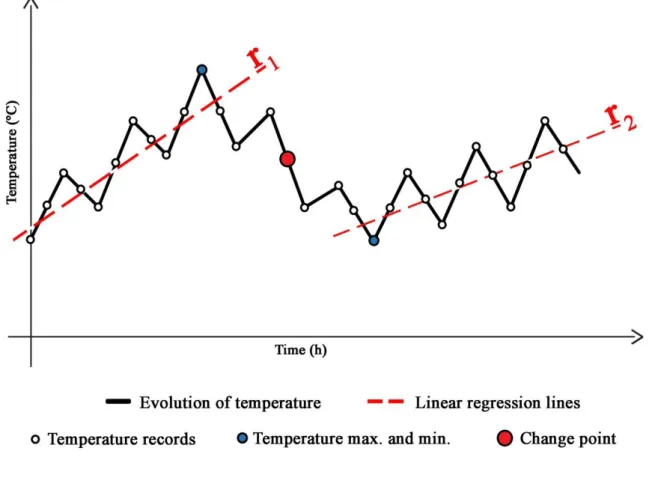
Figure 10 - Graphic representation with a theoretical temperature variation pattern ... 38
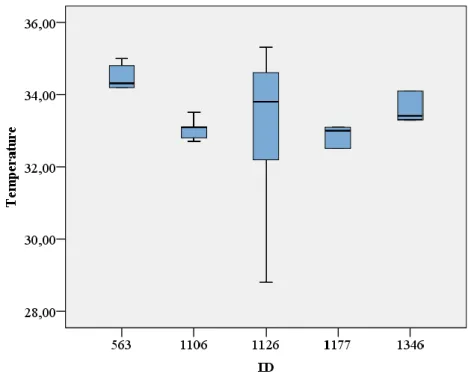
Figure 11 - Boxplot for the vulvar skin temperature records of the repeatability test ... 40
Figure 12 - Boxplot for the gluteal skin temperature records of the repeatability test ... 40
Figure 13 - Thermograms from sow ID 1126... 41
Figure 14 - Plan of the experimental room, with the animals distributed by their individual crates ... 43
Figure 15 - Relationship between weaning-to-estrus interval and duration of estrus in 29 multiparous sows ... 45
Figure 16 - Daily variation in the average vulvar skin temperature and average gluteal skin temperature from all animals ... 46
Figure 17 - Evolution of room temperature along the trial compared to the average vulvar skin temperature and gluteal skin temperature from all animals ... 49
Figure 18 - Scatter plot and linear regression line between room temperature and vulvar skin temperature ... 50
Figure 19 - Scatter plot and linear regression line between room temperature and gluteal skin temperature ... 50
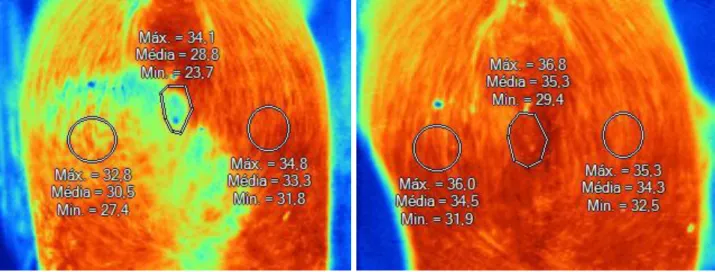
Figure 20 - Comparison between the vulva’s shape of a gilt and a sow ... 52
Figure 21 - Variation in vulvar skin temperature and 4-points average ... 54
Figure 22 - Variation in gluteal skin temperature and 4-points average ... 55
Figure 23 - Variation in vulvar-gluteal temperature and 4-points average from all animals.56 Figure 24 - Variation in vulvar-gluteal temperature and 4-points average in group D4 ... 58
Figure 25 - Variation in vulvar-gluteal temperature and 4-points average in group D5 ... 59
Figure 26 - Ovary ultrasonography of a gilt ... 62 Figure 27 - Variation in the daily average room temperature during the course of the trial 69
xii
List of Tables
Table 1 - Average weight and length of reproductive organs at different stages of the sows’ sexual life ... 7 Table 2 - Temperature records of the repeatability test, regarding the vulvar skin temperature and gluteal skin temperature ... 39 Table 3 - Average vulvar skin temperature from all animals according to day and hour of measurement ... 47 Table 4 - Average gluteal skin temperature from all animals according to day and hour of measurement ... 47 Table 5 - Room temperature during the trial ... 49 Table 6 - Vulvar skin temperature, gluteal skin temperature and vulvar-gluteal temperature relative to onset of estrus in all animals ... 53 Table 7 – Vulvar-gluteal temperature related to onset of estrus in groups D4 and D5 ... 57 Table 8 - Descriptive of the ovarian ultrasonography exams ... 63 Table 9 - Comparison between the expected time of ovulation and our hypothetical diagnosis of ovulation ... 65 Table 10 - Occurrence of vulvar-gluteal temperature maximum and minimum peaks in groups D4 and D5 and its relation with the expected time of ovulation ... 67
List of equations
xiii
List of Abbreviations and Symbols
AI – Artificial insemination AVG – Average ºC – Celsius degrees CH – Corpora hemorrhagica CL - Corpora lutea cm – centimeters
CNS - central nervous system Cp – Change-point
DD – Differential diagnosis DE – Duration of estrus
eOv – Expected time of ovulation f – Frequency of wave
FSH – Follicle Stimulating hormone g – grams
GST – Gluteal skin temperature h – hour
ICC - intra-class correlation coefficient ID – Animal identification number IgA - immunoglobulin A
IgG - immunoglobulin G IR – Infrared radiation IRT – Infrared thermography LH - Luteinizing hormone n – sample size
OATD - Osteoarthrosis tarsi deformans OE – Onset of estrus
Ov - Ovulation P – P-value
PGF2α - Prostaglandin F2α
PSE – Pale, soft and exudative meat
r – Pearson product-moment correlation coefficient R2 - Coefficient of determination
xiv ri – Repeatability index
RT – Room temperature
RTU – Real-time ultrasonography SD – Standard deviation
SE – Standing estrus
SEM - Standard error of the mean TAU – Transabdominal ultrasonography Tg_avg – Average gluteal temperature Tg_max – Maximum gluteal temperature Tg_min – Minimum gluteal temperature TRU – Transrectal ultrasonography Tv_avg – Average vulvar temperature Tv_max – Maximum vulvar temperature Tv_min – Minimum vulvar temperature US – Ultrasonography
VER – Vaginal electrical resistance VGT – Difference between VST and GST VST – Vulvar skin temperature
WEI – Weaning to Estrus interval Z – Acoustic impedance
ε – Emissivity λ - wavelength
1
1. Internship report
In order to fulfill the requirements of the Integrated Master in Veterinary Medicine from the Faculty of Veterinary Medicine, Technical University of Lisbon, I’ve made an internship in the National Veterinary School of Toulouse, France, for 7 months, between September 5, 2011 and March 30, 2012, in a total of 1040 hours, of which results this report.
During this period, I worked in the swine medicine department, under the supervision of Prof. Doctor Guy-Pierre Martineau. During the first 4 months, the majority of work consisted in swine clinic’s consultancy. Regarding this consultancy work, we were contacted by practitioners that were facing clinical cases of difficult resolution, usually related to reproductive or nutritional issues. We asked an exhaustive description of these cases, and also the G3T (reproductive performance data) and GTT (technical management data) records of the last 2 or 3 years. I was then responsible for the analysis of this data, establish possible causes for this particular problem and propose corrective measures. After this preliminary analysis was concluded, the team held a meeting to discuss my conclusions and suggest other improvements. In the next phase, when we had a better understanding of the problem, we visited the problematic farms, confirm or deny some of our hypothesis and suggest corrective measures. One month after, the farms were re-evaluated to assess the success of the implemented measures.
Besides this, several other activities were also developed. I gave support to the students during their swine medicine practical lessons, namely in the resolution of clinical cases and in the farms’ visits. I visited the SPACE from 13 to 16 September 2012, an international livestock trade show, with a strong presence of pharmaceutical companies, veterinarians and genetics companies, and had the opportunity to share different point of views regarding the swine industry and gather contacts for future projects. I attended the annual congress of the French Association of Veterinarian Swine Medicine, in Paris, between 1 and 2 December 2011, under the subject “Updates in swine pathology” and several other seminars promoted by Pfizer under the swine health subject. Between 31 October and 11 November 2011 I worked with Dr. Jean-Luc Sevin, a pig practitioner working for Triskalia in Brittany, France. During this period, I followed his daily work visiting several pig herds, spent some days with the technicians to learn further about swine nutrition and management and collaborated also with the LDA22, a national laboratory, performing pig’s necropsies. Between February and March 2012, I collaborated with Pfizer in the Power Learning Project, creating video tutorials
2
regarding swine medicine issues, based on the principle of the Kahn Academy, a non-profit organization that advocates free knowledge access in a worldwide scale, offering more than 3,000 free micro lectures via video tutorials on their website (www.khanacademy.org), covering various areas like mathematics, history, medicine, biology, astronomy, economics, etc.
In November 2011, with the support of a working team composed by Prof. Dr. Guy-Pierre Martineau, Prof. Dr. Agnès Waret Szkuta, Prof. Dr. Nicole Hagen-Picard, Prof. Dr. Veronique Gayrard and Prof. Dr. Faouzi Lyazrhi, I started the planning of the project that would lead, ultimately, to this thesis. The project took place from January 25, 2012 to February 2, 2012. From February until the end of March, I worked on the results of this project and, at the end of my internship, made a global presentation for my department with the preliminary conclusions of this study. After the conclusion of this internship, I wrote an article regarding the results of this project which is waiting to be peer-reviewed and will be further published in a refereed journal.
3
2. Introduction
In the last 30 years, the pork industry has gone through several major changes. The small and familiar production units, once profitable, now struggle to stay afloat. Market globalization, decreased profit margins and the rule of economies of scale led to a shift in the structure of this sector, with a decrease in the number of farms along the development of bigger production units, with more animals per unit, dilution of production costs and a strong investment in automated systems. In 2010, 1.5% of the largest fatteners were responsible for 75% of the total pork production of the European Union (Eurostat, 2010). This fact is particularly noticeable in countries where pig production has a special relevance like Denmark, Germany, France or Spain (figure 1). Additionally, new improvements in nutrition and genetics and the application of new husbandry practices like artificial insemination, estrus synchronization and ultrasound diagnosis of pregnancy lead to a progressive increase in the productivity of a sector where every small detail counts.
Figure 1: Distribution of numbers of fattening pigs by herd size in the European Union. Note
the particularly high percentage of pigs concentrated in big herds in countries where pig production is especially relevant like Denmark (DK), Germany (DE), France (FR) or Spain (ES). Adapted from Eurostat, 2010.
4
2.1. Reproductive management as a key factor in the pig’s production
The reproductive performance of the sows is one of the key factors for the farm’s economic viability. It is usually evaluated based on the number of piglets produced per sow per year or the number of farrowings per sow per year. Other factors that should also be considered include litter size, fertility, fecundity and number of non-productive days (Ate & Oyedipe, 2011).
Optimal fertilization results are achieved when insemination is performed in the 24 hours period prior to ovulation (Soede, Wetzels, Zondag, de Koning and Kemp, 1995; Cassar, 2006). However, timing of ovulation vary largely among animals (ranging from 10 h to 85 h after onset of estrus, according to the Soede and Kemp, 1997) and the available methods to successfully predict its occurrence are still difficult to perform and of limited applicability in the farm daily routine, as they are very time-consuming and involve advanced training by their operators.
Given this, the timing of ovulation is usually estimated based on the weaning-to-estrus interval (WEI) and relies on an accurate detection of heat by the farmer and the boar. A deep knowledge and understanding of the behavioral and physical signs associated with the OE is of the upmost importance, so females are not erroneously classified. Nevertheless, this method still involves a certain level of uncertainty, as a slight variation in the occurrence of ovulation is always expected, even in females with similar WEI.
If AI is performed more than 24 hours before ovulation, the semen’s viability at ovulation will be reduced, resulting in a lower fertilization rate and therefore a lower number of normal embryos (Soede, Langendijk and Kemp, 2002). To avoid this, multiple inseminations are employed as a standard swine practice, so that at least one matches that 24 hours period. This obvious has its drawbacks, since it is a time-consuming task and involves the risk of performing post-ovulation inseminations, which will induce a uterine inflammatory response and consequently early embryonic loss, prolonged estrus interval and also an increase of abnormal vaginal discharges (Rozeboom, Troedsson, Shurson, Hawton & Crabo, 1997; Kaeoket, Tantasuparuk & Kunavongkrit, 2005). The critical point is, thus, to find a simple, fast and inexpensive method that can not only detect ovulation, but above all predict its occurrence so the AI can be performed at ideal time.
In this context, infrared thermography (IRT) may prove to be a valuable tool. IRT is a noninvasive and accurate technique through which surface temperatures are monitored and
5
recorded. It can detect slight changes in the superficial body temperature without inducing stress in the animals, as it does not require contact with the object to perform these measurements. It is intuitive and does not require advanced knowledge to be performed. During the proestrus and early estrus, the vulvar area goes through several physical changes, becoming noticeably more red and swollen during proestrus, signs that begin to subside 24 to 36 hours before standing estrus (Worwood, 2007). These signs are closely related to hormonal changes, particularly the estrogen levels (Stelletta, Gianesella, Vencato, Fiore and Morgante, 2012). Since these changes are due to an increased local blood flow, resulting in a concomitant increase in the local temperature, IRT might detect these temperature fluctuations and, indirectly, infer the variations in the hormonal levels that will eventually lead to ovulation.
2.2. Goals of this study
With this study, we intended to answer several questions, with special focus on the following points:
Assess the applicability of infrared thermography to evaluate the vulvar skin temperature of pigs.
Assess variations in the vulvar skin temperature of pigs during proestrus and estrus. Establish a possible relationship between these temperature variations and ovulation. Evaluate the usefulness of this technique to predict the occurrence of ovulation under
the farm’s daily routine.
Compare the accuracy and applicability of transabdominal and transrectal ultrasonography to visualize the ovaries of sows and gilts and detect ovulation.
6
3. Literature Review
3.1. Anatomy of the reproductive organs
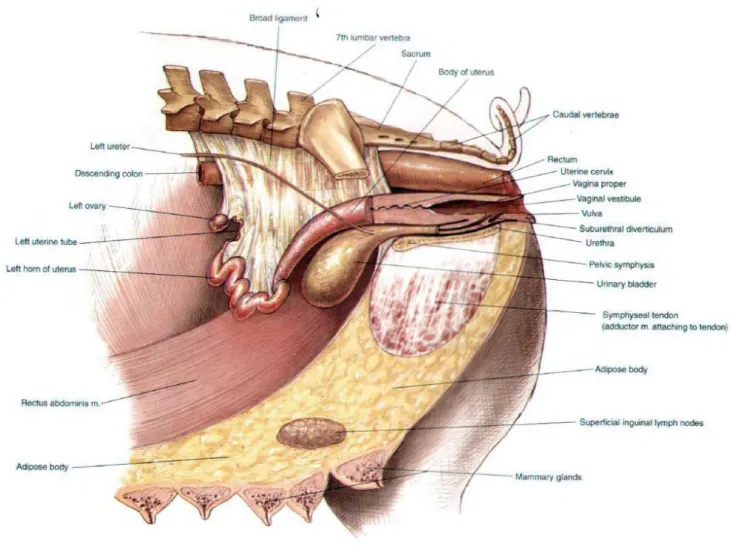
The reproductive tract of the sow is composed by a pair of ovaries, two uterine tubes (also called oviducts), the uterus, the vagina and the vulva (figure 2). These organs present important morphological variations depending on the sows’s age, breed and phase of the estrous cycle (Martinat-Botté, Renaud, Madec, Costiou & Terqui, 1998). In table 1, the differences between immature and mature females are evident.
Figure 2: Anatomy of the reproductive tract of a sow and adjacent structures (adapted from
7
Table 1: Average weight and length of reproductive organs at different stages of the sows’
sexual life (adapted from Martinat-Botté et al., 1998).
Parameters
Immature
Prepubertal
Pubertal-Cyclic
Weight of both
ovaries (grams) 6.3 6.5 10-20
Length of the uterine
horn (centimeters) 20-55
Uterus Weight (g) 66 90 350-900
Uterus Length (cm) 104 106 220-430
Length of the uterine
cervix 21 25
Vagina Weight (g) 60 66 67
Vagina Length (cm) 21 21 21
3.1.1. Ovaries
The ovaries are the primary organs of reproduction in the female. They have both endocrine and gametogenic functions as they produce hormones, such as estradiol and progesterone, and ova, which are released from the surface of the ovary during ovulation (Frandson, Wilke & Fails, 2009). The aspect of the ovary changes significantly depending on its physiological state, being its surface generally uneven because of the many protruding ovarian follicles and/or corpora lutea. Prior to ovulation several finely vascularized pre-ovulatory follicles measuring between 0.8 and 1 cm in diameter are visible on the surface of the ovary while 2 days after its surface is characterized by purple corpora lutea with visible follicle rupture points (Kyriazakis & Whittemore, 2006).
The ovaries are surrounded by a dense connective tissue capsule, the tunica albuginea, and are composed by medulla and cortex. The medulla, or central portion, consists of connective tissue and extensive vascular and nervous systems, while the cortex, or outer portion, consists largely of dense, irregular connective tissue interspersed with follicles and/or corpora lutea at various stages of development or regression (Frandson et al., 2009).
8
3.1.2. Uterine tubs
The two uterine tubs (previously known as fallopian tubes or oviducts) are responsible for conducting the ova from each ovary to the respective horn of the uterus and are the usual site of fertilization of ova by the spermatozoa (Frandson et al., 2009). They have a long, convoluted shape and are composed by three functional segments: infundibulum, the free cranial extremity funnel-shaped opening near the ovary; ampulla, a slight dilated section that accounts for about half the length of the oviduct; and finally the isthmus which connects the uterine tubs with the uterine lumen (Kyriazakis & Whittemore, 2006).
3.1.3. Uterus
The pig uterus is composed by two uterine horns, body and cervix, consisting of three different layers, from the outside towards the inside: serosa (perimetrium), muscular (myometrium), and mucosa (endometrium, the internal secretory layer) (Dyce, Sack & Wensing, 2009). The uterine horns contain many folds and may be up to 2 meters long, converging in the short and narrow uterine body. The cervix, longer than the uterine body, connects the uterus and the vagina. Its internal wall delimits the cervical canal, which contains a corkscrew arrangement of ridges or annular rings well adapted to the spiral twisting of the boar’s penis. The cervix has a sphincter-like function, being usually tightly closed except during estrus and parturition (Martinat-Botté et al., 1998; Kyriazakis & Whittemore, 2006).
3.1.4. Vagina, vestibule and vulva
The vagina is about 20 cm long and has thick walls that get thinner towards the vestibule, its caudal portion in which the urinary meatus is located (Martinat-Botté et al., 1998). The mucosa is lined by a stratified squamous epithelium, with the glands confined to its cranial portion. In pigs, a short blind sac called suburethral diverticulum can be found ventral to the opening of the urethra (Dyce et al., 2009).
The vulva is the external part of the female’s reproductive tract and consists of major and minor labia, meeting dorsally and ventrally to form the dorsal and ventral commissures. The ventral commissure is usually somewhat pendulous and conceals the clitoris (Frandson et al., 2009). At the onset of estrus, the high estrogen levels promote the swelling and reddening of the vulva and clitoris, typical signs of upcoming standing heat (Worwood, 2007).
9
3.2. Physiology of the estrous cycle
The domestic sow is a polyestrous animal with an average length of the estrous cycle around 21 days (Kyriazakis & Whittemore, 2006). Contrary to their wild ancestors which tended to mate in early winter and farrow in late spring, the nowadays sow doet show a striking seasonal infertility, although some negative effects in farrowing rate, weaning-to-estrus interval and age of puberty in gilts have been reported during late summer and early autumn (Peltoniemi, Love, Heinonen, Tuovinen & Saloniemi, 1999).
According to Tummaruk, Tantasuparuk and Kunavongkrit (2008), the age of puberty in gilts is usually defined as “the time of the first estrus and ovulation with a continuation of regular estrous cycles”. It largely differs among breeds, with the average being highest in Duroc and lowest in Meishan (Bidanel, Gruand & Legault, 1996; Evans & O’Doherty, 2001). Other factors influencing the attainment of puberty include nutrition, live weight, boar exposure, confinement, season and disease (Faillace, Biggs & Hunter, 1994; Tummaruk, Tantasuparuk, Techkumphu & Kunavongkrit, 2004). In average, it occurs between 5 and 8 months of age in the different European breeds (Martinat-Botté et al., 1998). Although the physiological mechanisms responsible for the onset of puberty remain partially unclear, the luteinizing hormone (LH) appears to play a key role in the control of ovarian development and, hence, the age at puberty in gilts, with a progressive increase in mean LH concentrations and LH pulse frequency before puberty, leading to the final maturation of ovarian follicles and, ultimately, the first ovulation (Evans & O’Doherty, 2001). Evidences suggest that the adenohypophysis is capable of releasing FSH and LH before GnRH becomes available to stimulate their release, however contrary to the LH, no relationship was found between the levels of FSH and the onset of puberty (Evans & O’Doherty, 2001; Frandson et al., 2009).
3.2.1. Phases of the estrous cycle
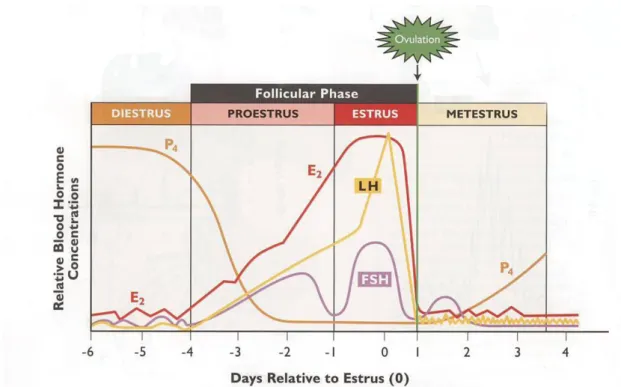
The estrous cycle can be divided into two distinct phases according to the dominant ovarian structure: the follicular phase (approximately from day 1 to day 7) and the luteal phase (approximately from day 8 until day 21) (Kyriazakis & Whittemore, 2006). The follicular phase, incorporating proestrus and estrus, starts with the regression of the corpora lutea and extends until ovulation. The luteal phase, from ovulation until corpora lutea regression, incorporates metestrus and diestrus and is characterized by the active secretion of progesterone by the corpora lutea (figure 3) (Martinat-Botté et al., 1998; Senger, 1999).
10
Figure 3: Phases of the estrous cycle and hormonal profiles (adapted from Senger, 1999).
3.2.1.1. Proestrus
The first phase of the estrous cycle (proestrus) is characterized by a rapid follicular growth. Right after the lysis of the corpora lutea at the end of diestrus, by the influence of prostaglandin F2α (PF2α), the progesterone levels start to subside, which releases the hypothalamus from its negative feedback inhibition (figure 4). Consequently, GnRH is released from the hypothalamus with increasing amplitude and frequency, which will stimulate the adenohypophysis to produce follicle stimulating hormone (FSH) and luteinizing hormone (LH) (Pineda & Dooley, 2002). These hormones will promote the growth of the follicles, which by their turn will produce increasing amounts of estrogen, responsible for the onset of sexual receptivity and several physiological changes like thicken of the vaginal walls and reddening and swelling of the vulva (Coffey, 1997; Cochran, 2011).
The dynamics of antral follicles are composed by four processes: recruitment, selection, dominance and atresia (Senger, 1999). By the start of proestrus the numbers of small and medium follicles rapidly decline and a cohort (group) of about 50 antral follicles with 1-6 mm is recruited for further growth under FSH stimulation and estradiol production (Knox, 2005; Schwarz, Kopyra & Nowicki, 2008). After the recruitment phase the follicles will go through a selection, in which the dominant follicles, 3-4 mm bigger than the subordinate ones, start to produce inhibin which will inhibit the FSH secretion from the adenohypophysis. The drop in
11
the FSH levels, coupled with a reduced blood supply to the smaller follicles, results eventually in atresia of the non-dominant follicles. Only the bigger follicles receiving a large blood supply and, thus, higher levels of gonadotropin, will continue to grow (Senger, 1999). Another key factor in the dominance dynamic is the shift on the follicle’s dependence from FSH to LH. Along with the decrease of the FSH levels due to the influence of inhibin, there is a simultaneous increase in the number of LH receptors on the granulosa cells of the dominant follicles. This way, these follicles shift from an FSH-dependency to an LH-dependency state, while the smaller follicles, with fewer LH receptors, eventually go into atresia (Zhenzhong, Garverick, Smith, Smith, Hamilton & Youngquist, 1995; Driancourt, 2001).
Figure 4: Events occurring during proestrus that lead to the preovulatory LH surge (adapted
from Senger, 1999).
3.2.1.2. Estrus
Estrus is, by definition, the period of sexual receptivity. It is characterized by a number of morphological and behavioral changes, induced by the high estrogen levels, which will be discussed in further detail on Chapter 3.3 “Estrus expression”. The duration of estrus in sows can vary from 24 to 96 h (Weitze, Wagner-Rietschel, Waberski, Richter & Krieter, 1994; Soede et al., 1995), being influenced by several factors like weaning-to-estrus interval (WEI), parity, boar effects, season and stress (Weitze et al., 1994; Soede & Kemp, 1997).
At this phase, the dominant follicles are producing increasing amounts of estradiol and inhibin, responsible for suppressing the FSH secretion from the adenohypophysis, while the
12
LH is progressively increasing. When the estradiol levels reach a threshold in association with the low progesterone levels, the hypothalamus is stimulated to release a large amount of GnRH, which will by its turn induce a sudden LH surge secreted by the adenohypophysis (Senger, 1999). This surge occurs 26 to 34 h before ovulation and it is directly responsible for the onset of ovulation, involving a complex interaction of proteolytic enzymes, PGF2α, Interleukin-1, histamine, among others (Soede et al., 1994; Tsafriri, 1995; Senger, 1999). Ovulation occurs usually 36 to 40 hours after onset of estrus, although it might range from 10 to 85 hours (Soede & Kemp, 1997; Gotszling & Baas, 1998), being affected by variables like season, parity, genotype and WEI (Knox & Zas, 2001; Belstra, Flowers & See, 2004). It might last from 1 to at most 7 hours, being in average 2 or 3 hours long (Soede, Hazeleger & Kemp, 1998).
3.2.1.3. Metestrus
Metestrus is the transitional period between ovulation and the full development of corpora lutea (CL). After ovulation, the estrogen levels start to subside and progesterone levels increase progressively, produced by the CL under development. This will eventually switch the organism from an estrogen-dominance to a progesterone-dominance, characteristic of the luteal phase (Pineda & Dooley, 2002).
After ovulation, and as a result of the vascular rupture on the follicles, each follicle gives place to a new structure, the corpora hemorrhagica (CH), which appear as small, hemorrhagic structures at the surface of the ovary. Under the influence of LH, the granulosa cells and some theca cells of these structures go through a process known as luteinization (Senger, 1999). At the end of metestrus the fully functional CL had lost their hemorrhagic appearance and produces actively progesterone, the dominant hormone of the luteal phase.
3.2.1.4. Diestrus
Diestrus is the longest stage of the estrous cycle, extending from about day 3 through day 13-15 post-ovulation. It is characterized by the presence of fully functional CL and high levels of progesterone (Senger, 1999).
After the complete maturation of the CL under the influence of LH, the progesterone levels keep increasing, reaching a peak 11 to 13 days after ovulation (Kyriazakis & Whittemore, 2006). The high levels of progesterone found during this stage play a crucial role in the
13
preparation for the upcoming pregnancy. On the central nervous system (CNS) exerts a negative feedback in the hypothalamus, suppressing the release of GnRH and, indirectly, FSH and LH; at the uterus, stimulates the production of glandular secretions from the endometrial glands and inhibits the contractibility and tone of the myometrium; finally, stimulates the development of the alveolar growth of the mammary gland, allowing initiation of lactation (Senger, 1999).
At the end of diestrus, if a successful pregnancy is not established, the CL will go through a regression process called luteolysis due to the action of PGF2α produced by the endometrium. The CL decrease in size, the capillaries undergo degeneration and the lutein cells are replaced by fibroblasts. The remaining structure named corpus albicans is visible as a connective tissue scar at the surface of the ovary (Pineda & Dooley, 2002; Miyamoto & Shirasuna, 2009). With the regression of all CL, the progesterone levels fall and the inhibition of the hypothalamic-pituitary axis is disrupted, allowing the start of a new cycle.
3.3. Estrus expression
Detection of estrus is one of the most critical components of a successful swine breeding program. With the widespread use of artificial insemination (AI), the responsibility of detecting estrus has shifted from boar to breeding technician. An accurate detection of estrus will ensure an increase in the herd’s reproductive performance and a decrease in the non-productive days. To achieve this, a good knowledge of all the typical signs related to estrus expression is fundamental.
Estrus is, by definition, “the time during the reproductive cycle in animals when the female displays interest in mating and will stand to be mounted” (Blood & Studdert, 1999). The physiological and behavioral changes observed during this period are closely related to the high estrogen and low progesterone levels (Pederson, 2007; Cochran, 2011). During the mid to late proestrus, as the production of estrogen increases from the growing follicles, several physiological changes occur in the reproductive tract due to an increase in the local blood flow, causing genital swelling and change in tissue electrical conductivity, increased mucosal secretion, uterine gland growth and increased uterine tone (Senger, 1999).
14
3.3.1. Physiological Signs
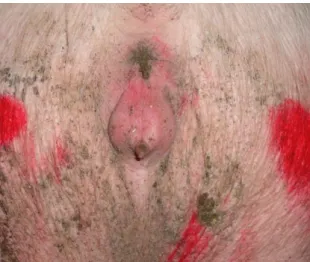
The swelling of the vulva is, perhaps, the most noticeable sign of the upcoming estrus in pigs (figure 5). Reddening and swelling of the vulva appears 2 to 5 days before standing heat and begin to subside in the 24 to 36 hours prior to standing heat (Worwood, 2007). It is due to an increased local blood flow that increases the local capillary pressure and causes lymph to buildup in the external genitalia, causing a local retention of fluids. These signs might be less pronounced in older parity sows since, although the described physiological changes occur the same way, the change in color and size is masked by their loose, flaccid skin around the vulva, as a result of the numerous farrowings (Diehl, Day & Flowers, 1998). These changes extend also to the clitoris, causing it to protrude outward, engorged with blood, and to the cervix, ensuring an effective “lock” for the boar’s penis and, thus, an effective insemination into the body of the uterus (Diehl et al., 1998; Senger, 1999).
Figure 5: Vulva of gilt in proestrus, with obvious reddening and swelling. Original image.
A clear and sticky mucus discharge is often present just before and during standing heat. As the estrus approaches, this mucus increases in thickness, conductivity and pH (Belstra, Flowers, See & Singleton, 2008). This mucus acts as lubrication during copulation and promotes sperm penetration of the utero-cervical junction; additionally, it has also an important role on the local immunity, since it acts as a barrier to contamination of uterus by flushing out foreign material introduced during copulation and by supporting phagocytic activity of the neutrophilic granulocytes (Branscheid & Holtz, 1988; Senger, 1999).
15
In the uterus, estrogen causes increased tone due to myometrial contractions and also an increased motility of the muscularis, partially responsible for sperm transport to the uterine tubes (Senger, 1999).
A special reference must be made to the regulatory role of estrogens in the uterine local immunity. Several studies proved the positive impact of estradiol in the uterine immunity, due to an increase in the concentration of immunoglobulin A and G (IgA and IgG) on the uterine lumen (Wira & Sandoe, 1980; Wira & Sullivan, 1985; Wira & Stern, 1986). This increased local immunity, associated with the above-mentioned functions performed by the uterine mucus, prepares the uterus for the upcoming fertilization removing all the unwanted agents that might threaten the success of fertilization and implantation.
Finally, under the influence of estrogen, the uterine tube’s epithelium increases its secretory rate and their ciliated cells increase their motility, facilitating gamete and fluid transport (Senger, 1999).
3.3.2. Behavioral Signs
According to Beach (1976), the estrus in female mammals can be divided in two components: the proceptive and the receptive behavior. Proceptive behavior corresponds to the “various reactions by the female toward the male which constitute her assumption of initiative in establishing or maintaining sexual interaction”, while the receptive component connotes “female responses necessary and sufficient for the male's success in achieving intravaginal ejaculation” (Beach, 1976).
The first behavioral sign that sows are coming into heat is an increase in activity and vocalization, increased restlessness and reduced appetite (Diehl et al., 1998; Almond, Flowers, Batista & D’Allaire, 2006). When housed in crates, sows often increase their forward-backward or lateral movements and attempt to nibble or nose the adjacent females. Additionally, they might paw at the front door of the crate and “chant” to animals in front of them; when housed in pens, typical activities include sniffing and nuzzling the rear and fore flanks (Diehl et al., 1998).
A typical sign of sows coming into or going out of estrus is trying to mount and ride other females. The behavior of the mounted female may differ: if not in standing heat, she will not tolerate being mounted and will vocalize loudly and try to escape; if she’s already in standing heat, she will stand immobilized (Belstra et al., 2004). These behavioral changes have
16
presumably the purpose of attracting the attention of the boar and stimulate his sexual activity, as already demonstrated in goats (Shearer & Katz, 2006).
When in presence of a boar, the female will actively try to approach him and if possible, will spend more time close to his pen (Pedersen, 2007). The visual, olfactory, auditory and tactile stimuli of the boar are one of the critical factors responsible for a full and effusive expression of estrus by the female (Zink & Diehl, 1984; Langendijk, van den Brand, Soede & Kemp, 2000; Kemp et al, 2005). The male pheromone 5-α androsterone, produced in the testis and salivary glands, is one of the responsible components for the female’s sexual receptivity, triggering one of the most unequivocal signs of estrus, the standing reflex (Diehl et al., 1998; Gerritsen, Langendijk, Soede & Kemp, 2005). When exposed to a boar, females will assume a rigid, motionless stance, in anticipation of being mounted known as standing reflex or immobilization response. Their hind limbs start isometric muscle contractions, their back arches slightly and in some breeds the ears are hold erected, known as “ear popping” (figure 6) (Belstra et al., 2004). The standing reflex assumes a particular importance in heat detection, as it is the reference point upon which most breeding protocols are based. In order to detect the standing reflex, a method called “back-pressure test” is used, which consists in pushing down on the animal’s loin with both hands or sitting on the loin (figure 7); if the female is in heat and standing reflex is present, the animal will not try to avoid this contact and the above-mentioned signs might be visible (Worwood, 2007). This test should be performed ideally with the presence of the boar, if possible with nose-to-nose contact, as it increases significantly the expression of these signs, improving by 30% to 40% the chance of identifying females in estrus. If a boar stimulus is not provided, the standing reflex may not be detected, especially in the early and late estrus (Diehl et al., 1998).
Figure 6 (right): Female in estrus showing “ear popping” (adapted from Singleton, 1997).
17
Since this immobilization response requires a great expenditure of energy to support the muscle contractions, this state will last in most animals only 15 to 30 minutes, after which muscles become fatigued and the animal enter a refractory period that last for a few hours (Levis & Hemsworth, 1995). If back-pressure test is performed during the refractory period, it will result in a negative diagnosis and this animal will be erroneously classified as not in estrus. To avoid this, the contact of the male should be restricted to a small number of females, either 5 to 10 crates or 1 to 2 pens, so the estrus detection can be made simultaneously with the boar stimulation (Knox, 2008).
3.4. Alternative methods for estrus detection
The classical and most used method to detect females in standing heat is looking for all the signs already mentioned, using simultaneously a mature boar to stimulate the exhibition of these signs by the females. The success of this method is greatly dependable on the experience of the herdsman recognizing the estrus behavioral signs and on a correct management of the boar. Sometimes females will cycle and ovulate without showing obvious behavioral signs (known as silent estrus) and so a good knowledge of the physiological changes is also required (Napel, Kemp, Luiting & Devries, 1995). When the first signs of estrus are detected in a female, some producers opt, additionally, to take her individually to the boar pen, in order to allow a stronger stimulation and thus confirm the diagnosis (Senger, 1999). Estrus detection should be performed twice daily, as close as possible to 12 hours intervals; this will eliminate most cases of false estrus, since sows that are not truly in estrus will rarely stand for two consecutive exams (Worwood, 2007).
All these procedures are obviously very laborious and, with the continuous increase of the pigs’ herd size, they turn to be very time-consuming and labor-demanding. Moreover, these methods are particularly difficult to apply in sows housed in pens or open spaces, due to the difficulty to restrain the animal movements and identify these behavior signs.
Thus, other methods to identify females in estrus were developed, some of them perfectly tailored to use routinely, while others more focused on experimental trials. Both non-automated and non-automated methods will be briefly discussed, with more emphasis given to the latter due to their significantly higher importance in the pig industry.
18
3.4.1. Non-automated methods
3.4.1.1. Measurement of Vaginal Electrical Resistance
In the last decades, several reports have described significant changes in the electrical resistance of the vaginal mucus (VER) associated with day of the estrous cycle (Ko, Evans & Hopkins, 1989; Szenci, Sima, Hartmann & Keresztes, 1990). However, several authors stand that although VER increases slightly during estrus, there is a considerably variation between animals and this method cannot be used as a stand-alone reliable tool to fix the proper time to inseminate (Harbison, Kirkwood, Aherne & Sather, 1987; Charuest, Dufour, Savoie & Richard, 1990; Stokhof, Soede & Kemp, 1996).
3.4.1.2. Ultrasonography
The use of ultrasonography in the porcine reproduction field brought a great understanding of the follicle dynamics and its relation with estrus expression. Although mainly used as a pregnancy diagnosis tool, ultrasonography is frequently applied in experimental studies to monitor follicle development or detect ovulation (Knox & Althouse, 1999; Kauffold & Althouse, 2007). This subject will be discussed in further detail in chapter 3.5.4 “Applications of ultrasonography in swine industry”.
3.4.2. Automated methods
The automated estrus detection methods assume special relevance in the current pig production industry given the progressive increase in the size of the herds and the growing need for methods that can reduce the dependence of human labor. The recent developments in legislation about animal welfare and the increasing awareness of the consumer for this question as led to a rise in the group-housing facilities, bringing additional difficulties to the classical estrus detection methods and giving space to improvements in the detection methods. The use of automated mechanisms may alert the producer, for instance, for a sow that is returning to estrus in a group of served females, leading this way to a precocious detection of fertilization failure and, thus, avoid a greater increase in the non-productive days.
19
3.4.2.1. Accelerometer
An accelerometer is a device that detects movement and measures the accumulated distance over time.
One of the first signs of a sow approaching heat is an increased activity, restlessness and exploratory behavior (Diehl et al., 1998). When applied an accelerometer to a female (in pigs, usually in a neck collar) this device will detect the increased movement when the animal is getting close to heat and thus the producer can focus its attention in the suspected animals. Bressers (1993) tested this method in group-housed sows and reported that this method could reduce 10 to 15% of the check-ups when compared to no automated system. In 1995, Geers et al. (cited by Cornou, 2006) tested its applicability in crate-housed sows and reported physical activity to be 10 times higher the day before estrus.
3.4.2.2. Infrared sensor
Freson, Godrie, Bos, Jourquin and Geers (1998) tested the use of infrared sensors to quantify the movement of sows housed in crates. These sensors were installed 50 cm above the sow’s shoulders and the movement was detected based on a change in position of the body in relation to the sensor. The authors reported that 86% of the sows were correctly classified when using the mean daily activity as the selection parameter, with 79% sensitivity and 68% specificity.
3.4.2.3. Visit to the boar pen
One of the components of the sexual behavior of the estrous female is, as already mentioned, the proceptive behavior, which can be described as “the tendencies to ‘search for the boar’, ‘stay close to the boar’ and ‘present’ in front of the boar” (Cornou, 2006). Based on this, some automated estrus detection systems have been developed to evaluate the interest of the females by the boar and the time spent close to him. The boar is housed in a separate pen from the sows but nose-to-nose contact is possible. When a female approaches the boar to establish contact, a transmitter–receiver device reads their individual identification and sends to a central computer the frequency and length of the visits. Using this method, Bressers, Te-Brake and Noordhuizen (1991) were able to detect 95% of the sows that came into estrus, while Ostersen, Cornou and Kristensen (2010) reported a sensitivity of 87.4% and a
20
specificity of 99.4%. Several other studies confirmed the usefulness of this method as a complementary tool in estrus detection (Blair, Nichols & Davis, 1994; Korthals, 1999).
A major limitation of the methods based on behavioral traits may be related to motility problems such as lameness and hierarchical conflicts observed within group housed sows. These factors may either increase or decrease the physical activity and the frequency of visits to the boar pen and therefore impair the results of these methods (Cornou, 2006).
3.4.2.4. Body Temperature
Several studies reported significant changes in the body temperature around the time of estrus, but their results are often discordant and so the applicability of this method remains unclear. The temperature records are usually obtained from implants placed in the base of the ear or inside the vagina. Junge and Holtz (1984) measured intravaginal temperature of sows and cows and found a defined pattern in relation to estrus, with the temperature reaching the lowest value 2 days before standing estrus (SE) and the highest value 2 days after SE. Regarding the ear base temperature, Geers et al. (1995) found a significant rise in 75% of the sows until 2 days prior the standing reflex.
Henne (1991, cited by Soede, Hazeleger, Broos & Kemp, 1997), by his turn, measured the rectal temperature twice daily and found a large variability between animals: in 30% of the gilts the temperature rose at onset of estrus, in 20% remained stable and declined in 50% of the animals.
Given the still remaining variations in terms of results between different studies, the monitoring of body temperature is not used yet to detect estrus in swine herds.
3.5. Ultrasonography
3.5.1. Historical backgroundDiagnostic sonography, or simply ultrasonography (US), is a diagnostic imaging technology used to visualize internal organs using high frequency sound waves, usually between 2 and 18 Mhz (Burk & Feeney, 2002). The use of ultrasound in the human medical field dates back to 1940, when it was used not only as a diagnosis tool, but also as a therapy for several conditions, such as arthritic pain, gastric ulcers, eczema or urinary incontinence (Woo, 2002).
21
In fact, this technology was seen almost as a "cure-all" remedy, despite the lack of scientific evidences. Karl Dussik (1908-1968), a neurologist from the University of Vienna, was the first physician who employed ultrasound in medical diagnosis, in order to locate brain tumors and the cerebral ventricles (Man & Karmakar, 2006; Suetens, 2009).
In 1980, Palmer and Driancourt reported for the first time the use of an ultrasound imaging system as an early pregnancy diagnosis method in mares (Kähn, Volkmann & Kenney, 2004). This was the first step for the use of ultrasonography in animal reproduction.
Today, ultrasonography is routinely used in many species for reproductive and obstetric exams. In pigs, it assumes particular importance as a pregnancy diagnosis tool, being nowadays an absolute requisite for the modern pig industry (Williams, Piñeyro & de la Sota, 2003; Boulot, 2010; Medan & Abd El-Aty, 2010).
3.5.2. Basic principles
Ultrasonography is based in the pulse-echo principle, similar to the echolocation used by bats, whales and dolphins. A pulse of high-frequency sound (ultrasound) is transmitted into the body by a probe, which travels through the body until it reaches a boundary between tissues of different physical properties. When it hits this boundary, part of the sound waves are reflected back to the probe, while others are transmitted and keep travel on further until they reach another boundary and get reflected. The reflected waves (echoes) are picked up by the probe and transmitted to the central unit which estimates the position of the reflecting structure based on the gap in time between the transmission of these sound waves and the return to the probe, usually on the order of millionths of a second (Arbona, Khabiri & Norton, 2010). This is possible since it is assumed the sound travels at a fairly constant speed in the body tissues, around 1,540 m/s (Gorgas, 2011). The ultrasound unit displays then a two dimensional image in the screen representing not only the distance at which a sound wave was reflected, giving thus a visual representation of the organs’ anatomical relationships, but also its intensity, which will vary from a bright image for a highly reflective, hyperechoic surface like the lungs to a dark image representative of a poorly reflective, hypoechoic structure like the urinary bladder (Burk & Feeney, 2002; Arbona et al., 2010).
22
3.5.3. Instrumentation
With the advances in ultrasonography technology, lighter and more affordable ultrasound units were developed. Currently, a wide range of models are available in the market to fulfill the demands of the clinics, from heavy, bulky units with great resolution to light, portable units to use under field conditions. The basic ultrasound unit is composed by a transducer probe, responsible for sending and receiving the sound waves, a central processing unit that processes all the information and contains the electrical power supplies, transducer pulse controls that allow the operator to change the amplitude, frequency and duration of the pulses emitted from the transducer probe and a display that shows the image resulting from the processed echoes (Martinat-Botté et al., 1998).
The transducer is the main component of the ultrasound unit. It can differ in terms of frequency and design, so special attention shall be paid to the selection of this component. Usually, each transducer can only operate in a specific frequency, with higher frequencies more suited to visualize superficial organs and lower frequencies used for deeper examinations, although with a significant loss in the image resolution. (Merritt, 2011). As a general guideline, 5 MHz probes will image properly to a depth of 15 cm, 7.5 MHz will image up to 7 cm and 10 MHz will only image well to a depth of 4–5 cm (Mannion, 2006). Recently, multifrequency transducers have been developed in order to allow the selection of a specific frequency within a certain range, which allows the simultaneous imaging of the near and far fields with sound waves of different frequencies without the need to change the probe (Nyland et al., 2002).
Concerning their design, transducers can be classified as array or phased array. The first ones produce a rectangular image, as wide as the array, clear and without a significant loss of information on the edges (Rizk, 2010). They are especially useful when the acoustic window is large, such as in obstetrics exams. Phased array transducers produce a pie-shaped image and are mainly used when the acoustic window is small, like in echocardiography due to the presence of the ribs, and also to visualize deeply located structures in bigger animals. However, it has a limited value for scanning superficial structures and its image shows a slightly distortion on the edges (Martinat-Botté et al., 1998; Gorgas, 2011).
23
3.5.4. Applications of ultrasonography in swine industry
Although the use of ultrasound to evaluate biological tissues dates back to the 1940s, the widespread of this technology in livestock species was somewhat slow, mainly due to the high investment costs involved (Moeller, 2002). One of the first studies regarding the use of ultrasound in pigs was conducted by Temple, Stonaker, Hovry, Posakony and Hazaleus (1956, cited by Szabo et al., 1999) who reported the applicability of this technology in the evaluation of backfat thickness in live pigs. Several studies followed, with Price, Pearson, Pfost and Deans (1960), Urban and Hazel (1965) and Moody and Zobrisky (1966) confirming the accuracy of this technique.
In the latter years, its use has greatly increased due to advances in the ultrasound hardware, with the onset of lighter, portable and less expensive equipment, suited to use under field conditions. Among several advantages, this method is non-invasive and harmless to the animal, there is no risk of abortion in pregnant sows, the results are immediate and can be stored for further analysis (Martinat-Botté et al., 1998). It has, though, some limitations: the exam might be difficult to perform if the animal is not still and the skin must be perfectly cleaned and coated with ultrasound gel (Martinat-Botté et al., 1998). In fat animals might be difficult to perform transcutaneous ultrasonography, while in prepubertal gilts the transrectal approach is not always possible (Waberski, Kunz-Schmidt, Neto, Richter & Weitze, 2000). Given the importance of this technique in the pig production, some of its applications will be briefly reviewed.
3.5.4.1. Pregnancy diagnosis
Early and accurate identification of nonpregnant sows improves reproductive efficiency in commercial swine farms by reducing number of non-produtive days and, thus, increasing the number of farrows per year (Pequeno, Zúniga & Wilschral, 2009).
With Doppler or A-mode ultrasound, the initial financial investment is lower but the sensibility and specificity of these methods are not very high at the beginning of gestation, which make them not very useful before 30-35 days of gestation (Williams et al., 2003). With B-mode, real-time ultrasonography (RTU) better results can be achieved. Using this technique, the earliest detection of pregnancy reported varies among the sources, but is usually described between 12 and 16 days of gestation (Knox & Althouse, 1999; Resnis, Bigliardi, Parmigiani & Peters, 2000; Romero, 2005). Nevertheless, sometimes it may be
24
quite difficult to have a correct diagnosis so soon using the routine transcutaneous RTU with a 5.0 MHz probe, so usually this exam should be performed after 21 days post artificial insemination (AI) (Flowers, Armstrong, White, Woodhard & Almond, 1999). Using transrectal scanning and a 7.5 MHz probe, it is possible to anticipate a few days, being an embryo usually detected between days 18 and 20 of gestation (Miller et al., 2003).
3.5.4.2. Monitoring of follicle dynamics and ovulation
The application of ultrasonography to the ovaries visualization greatly increased our understanding of follicle development and its dynamics along the estrous cycle. When performed in complement with blood assays for hormonal measurements, several authors were able to establish a relationship between FSH, LH, estradiol and progesterone levels and the follicle development (Dalin, Nanda, Hultén & Einarsson, 1995; Madej, Lang, Brandt, Kindahl, Madsen & Einarsson, 2005; Madej, Brandt & Einarsson, 2009). Through US several external factors were identified as having influence on the follicle development post-weaning, including high ambient temperature (Barb et al., 1991), low energy feed intake during lactation (van den Brand, Dieleman, Soede & Kemp, 2000), parity and body condition score (Bracken, Lamberson, Safranski & Lucy, 2003).
Ovary US is also a valuable tool to detect ovulation, being currently the gold-standard technique to determine its occurrence (Boulot, 2010). Several authors believe the implementation of US as a routine method for monitoring ovulation would be economically viable due to a more precise AI program, a decrease in the number of AI per animal and the absence of post-ovulatory inseminations (Knox & Althouse, 1999; Waberski et al., 2000; Kauffold & Althouse, 2007). According to Knox & Althouse (1999), only the transrectal technique can provide the required resolution and sensitivity to successfully visualize the ovarian structures and identify follicles, corpora hemorrhagica (CH) and corpora lutea (CL). The precision of this diagnosis in terms of timing of ovulation can go up to 4 hours, depending on the frequency of the examinations. A positive diagnosis of ovulation is established when sequential examinations showed the disappearance or a significant decrease in the number of pre-ovulatory follicles, followed, but not mandatorily, by the visualization of CH (Kemp & Soede, 1996; Kauffold & Althouse, 2007)