EUROPEAN ORGANISATION FOR NUCLEAR RESEARCH (CERN)
CERN-PH-EP-2012-236
Submitted to: PLB
Searches for heavy long-lived sleptons and R-hadrons with the
ATLAS detector in pp collisions at
√
s
= 7 TeV
The ATLAS Collaboration
Abstract
A search for long-lived particles is performed using a data sample of 4.7 fb−1 from proton-proton collisions at a centre-of-mass energy √s = 7 TeV collected by the ATLAS detector at the LHC. No excess is observed above the estimated background and lower limits, at 95% confidence level, are set on the mass of the long-lived particles in different scenarios, based on their possible interactions in the inner detector, the calorimeters and the muon spectrometer. Long-lived staus in gauge-mediated SUSY-breaking models are excluded up to a mass of 300GeV for tan β = 5−20. Directly produced long-lived sleptons are excluded up to a mass of 278GeV. R-hadrons, composites of gluino (stop, sbottom) and light quarks, are excluded up to a mass of 985 GeV (683 GeV, 612 GeV) when using a generic interaction model. Additionally two sets of limits on R-hadrons are obtained that are less sensitive to the interaction model for R-hadrons. One set of limits is obtained using only the inner detector and calorimeter observables, and a second set of limits is obtained based on the inner detector alone.
Searches for heavy long-lived sleptons and R-hadrons with the
ATLAS detector in pp collisions at √s = 7 TeV
ATLAS Collaboration
Abstract
A search for long-lived particles is performed using a data sample of 4.7 fb−1from proton-proton
collisions at a centre-of-mass energy √s = 7 TeV collected by the ATLAS detector at the LHC. No excess is observed above the estimated background and lower limits, at 95% confidence level, are set on the mass of the long-lived particles in different scenarios, based on their possible interactions in the inner detector, the calorimeters and the muon spectrometer. Long-lived staus in gauge-mediated SUSY-breaking models are excluded up to a mass of 300 GeV for tan β = 5−20. Directly produced long-lived sleptons are excluded up to a mass of 278 GeV. R-hadrons, composites of gluino (stop, sbottom) and light quarks, are excluded up to a mass of 985 GeV (683 GeV, 612 GeV) when using a generic interaction model. Additionally two sets of limits on R-hadrons are obtained that are less sensitive to the interaction model for R-hadrons. One set of limits is obtained using only the inner detector and calorimeter observables, and a second set of limits is obtained based on the inner detector alone.
Keywords: long-lived, GMSB, slepton, R-hadron, ATLAS, LHC 1. Introduction
Heavy long-lived particles (LLP) are pre-dicted in a range of theories which ex-tend the Standard Model (SM). Supersym-metry (SUSY) [1–9] models allow long-lived charged sleptons (˜`), squarks (˜q) and gluinos (˜g). Heavy LLPs produced at the Large Hadron Collider (LHC) could travel with speed measurably lower than the speed of light. These particles can be identified and their mass, m, determined from their speed, β, and momentum, p, using the relation m = p/γβ, with γ being the relativistic Lorentz factor. Four different searches are presented in this Letter, using time-of-flight to measure β and specific ionisation energy loss, dE/dx,
to measure βγ. The searches are optimised for the different experimental signatures of sleptons and composite colourless states of a squark or gluino together with SM quarks and gluons, called R-hadrons.
Long-lived charged sleptons would inter-act like muons, releasing energy by ionisa-tion as they pass through the ATLAS detec-tor. A search for long-lived sleptons iden-tified in both the inner detector (ID) and in the muon spectrometer (MS) is therefore per-formed (“slepton search”). The results are in-terpreted in the framework of gauge-mediated SUSY breaking (GMSB) [10–16] with the light stau (˜τ) as the LLP. In these models a sub-stantial fraction of the events would contain two LLP candidates, and this feature is also
utilised in discriminating signal from back-ground. Direct pair production of sleptons is also used to interpret the data independently of the mass spectrum of the other SUSY parti-cles.
Coloured LLPs (˜q and ˜g) would hadronise forming R-hadrons, bound states composed of the LLP and light SM quarks or gluons. They may emerge as charged or neutral states from the pp collision and be converted to a state with a different charge by interactions with the detector material, and thus arrive as neu-tral, charged or doubly charged particles in the muon spectrometer.
In ATLAS, LLPs can be identified via the timing information in the muon spectrometer or calorimeters and via the measurement of the energy loss in the silicon pixel detector. All of these techniques are combined in this analysis to achieve optimal sensitivity for the “full-detector R-hadron search”. In addition, searches based on only the calorimeter and the inner detector information (“MS-agnostic R-hadron search”), and based solely on the in-ner detector (“ID-only R-hadron search”) are performed. The latter two cases are motivated by the limited understanding of R-hadron in-teractions in matter, in particular the possibil-ity that R-hadrons are electrically neutral in the MS. Furthermore, these searches are sensitive to scenarios in which the R-hadrons decay be-fore reaching the MS. In all searches the sig-nal particles are assumed to be stable within the ATLAS detector, at least to the point it hits the last relevant component of the subdetector used for detecting it.
Previous collider searches for LLPs have been performed at LEP [17–20], HERA [21], the Tevatron [22–28], and the LHC [29–35].
2. Data and simulated samples
The work presented in this Letter is based on 4.7 fb−1of pp collision data collected at a
centre-of-mass energy √s = 7 TeV in 2011. The events are selected online by muon trig-gers for the slepton search and by missing transverse momentum and muon triggers for the R-hadron searches. Data and Monte Carlo Z → µµ samples are used for timing resolution studies. Monte Carlo signal samples are used to study the expected signal behaviour and to set limits.
The GMSB samples are generated with the following model parameters: number of super-multiplets in the messenger sector, N5 = 3, messenger mass scale, mmessenger =
250 TeV, sign of the Higgsino mass param-eter, sign(µ) = 1, and Cgrav, the scale factor
for the gravitino mass which determines the ˜τ lifetime was set to 5000 to ensure that the ˜τ does not decay in the detector. The ratio of the vacuum expectation values of the two Higgs doublets, tan β, is varied between 5 and 40 and the SUSY-breaking mass scale Λ is varied from 50 to 150 TeV, corresponding to light ˜τ masses varying from 122.2 to 465 GeV. The mass spectra of the GMSB models are ob-tained from the Spice program [36] and the events are generated using Herwig [37].
The R-hadron samples are generated with gluino (squark) masses from 300–1500 GeV (200–1000 GeV). The pair production of gluinos and squarks is simulated in Pythia [38], incorporating specialised hadronisation routines [39–41] to produce final states con-taining R-hadrons. A 10% gluino-ball frac-tion is assumed in the gluino sample pro-duction. The simulation of R-hadron inter-actions with matter is handled by dedicated Geant4 [42, 43] routines based on a generic model [44]. All Monte Carlo events pass the full ATLAS detector simulation [42, 45] and
are reconstructed with the same programs as the data. All signal Monte Carlo samples are normalised to the integrated luminosity of the data.
3. The ATLAS detector
The ATLAS detector [46] is a multipur-pose particle physics detector with a forward-backward symmetric cylindrical geometry and near 4π coverage in solid angle1. The ID
consists of a silicon pixel detector, a silicon micro-strip detector, and a transition radiation tracker. The ID is surrounded by a thin super-conducting solenoid providing a 2 T magnetic field, and by high-granularity liquid-argon sampling electromagnetic calorimeters (LAr). An iron/scintillator-tile calorimeter provides coverage for hadrons in the central rapidity range. The end-cap and forward regions are in-strumented with liquid-argon calorimeters for both electromagnetic and hadronic measure-ments. The MS surrounds the calorimeters and consists of three large superconducting air-core toroids each with eight coils, a system of precision tracking chambers, and detectors for triggering.
The ATLAS trigger system is designed to select the events of most interest with a data-taking rate of about 400 Hz from a beam bunch crossing rate as high as 40 MHz. The first-level trigger (first-level-1) selection is carried out by custom hardware and identifies detector re-gions and the bunch crossing for which a trig-ger element is found. The high-level trigtrig-ger
1ATLAS uses a right-handed coordinate system with
its origin at the nominal interaction point in the centre of the detector and the z-axis coinciding with the axis of the beam pipe. The x-axis points from the interaction point to the centre of the LHC ring, and the y-axis points upward. Cylindrical coordinates (r, φ) are used in the transverse plane, φ being the azimuthal angle around the beam pipe. The pseudorapidity is defined in terms of the polar angle θ as η = − ln tan(θ/2).
is performed by dedicated software, seeded by data acquired from the bunch crossing and re-gions found at level-1. The components of particular importance to this analysis are de-scribed in more detail below.
3.1. The pixel detector
As the innermost detector system in AT-LAS, the silicon pixel detector provides at least three precision measurements for each track in the region |η| < 2.5 at radial distances from the LHC beam line r < 15 cm. The sensors in the pixel barrel (covering the cen-tral |η|-region) are placed on three concentric cylinders around the beam-line, whereas sen-sors in the end-cap (covering the high-|η| re-gion) are located on three disks perpendicular to the beam axis on each side of the barrel. In the barrel (end-cap) the intrinsic accuracy is 10 µm in the rφ-plane and 115 µm in the z(r)-direction. The data are only read out if the sig-nal is larger than a set threshold. The time for which the signal exceeds that threshold, ToT, is recorded. The larger the initial signal is the longer this time.
3.1.1. Pixel detector specific ionisation (dE/dx) measurement
The relation between the ToT and the charge deposition in each pixel is measured in dedi-cated calibration scans and shows a good lin-earity. Therefore, the ToT measurement is well correlated with the energy loss of a charged particle in the pixel detector. The maximum ToT value corresponds to 8.5 times the av-erage charge released by a minimum ionis-ing particle (MIP) for a track perpendicular to the silicon detectors and leaving all its ionisa-tion charge on a single pixel. If this value is exceeded, the ToT (and therefore the charge) is not correctly measured. In LHC collisions the charge generated by one track crossing the pixel detector is rarely contained in just one
pixel. Neighbouring pixels are joined together to form clusters and the charge of a cluster is calculated by summing up the charges of all pixels after calibration correction. The specific energy loss dE/dx is defined as the average of all individual cluster charge measurements for the clusters associated with the track. To re-duce the Landau tails, the average is evaluated after having removed the cluster with the high-est charge (the two clusters with the highhigh-est charge are removed for tracks having five or more clusters).
3.1.2. Mass measurement with the pixel detec-tor
The masses of slow charged particles can be measured using solely the ID information by fitting each dE/dx and momentum mea-surement to an empirical Bethe-Bloch func-tion and deducing their βγ value. The mea-surable βγ range lies between 0.2 and 1.5, the lower bound being defined by the overflow in the ToT spectrum, and the upper bound by the overlapping distributions in the relativistic rise branch of the curve. This particle identifica-tion method [47] uses a five-parameter func-tion to describe how the most probable value of the specific energy loss (MdE
dx) depends on βγ: MdE dx(βγ) = p1 βp3 ln(1 + (p2βγ) p5) − p 4 (1)
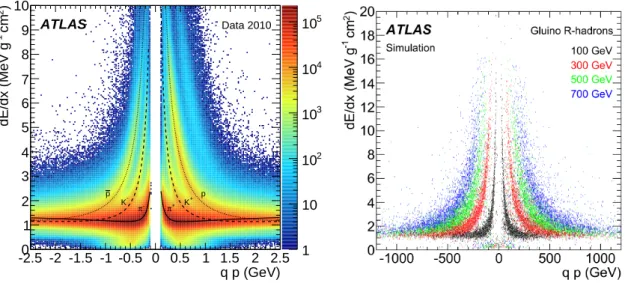
Fig. 1(left) shows how this function de-scribes data for low momentum tracks. Fig. 1(right) shows the simulated pixel dE/dx spectra for singly-charged hypothet-ical R-hadrons of masses 100, 300, 500 and 700 GeV. As expected, these distribu-tions extend into the high pixel dE/dx re-gion even for high momentum tracks. The most probable value of dE/dx for MIPs is about 1.2 MeVg−1cm2 with a spread of about
0.2 MeVg−1cm2 and a slight η dependence,
in-creasing by about 10% from low-η to high-η regions.
For all tracks having a reconstructed mo-mentum p and a measured specific energy loss dE/dx above the value for MIPs, a mass es-timate mβγ = p/βγ is obtained by inverting
Eq. (1). The procedure is continuously mon-itored through precise (< 1%) measurements of the mass of known particles (kaons and pro-tons). For LLPs the expected dE/dx values are much larger than those of SM particles, allow-ing for identifyallow-ing them based on this informa-tion.
3.2. Calorimeters
Liquid argon is used as the active detec-tor medium in the electromagnetic (EM) bar-rel and end-cap calorimeters, as well as in the hadronic end-cap (HEC) calorimeter. All are sampling calorimeters, using lead plates for the EM calorimeters and copper plates for the HEC calorimeter. The barrel EM calorimeter covers the region |η| < 1.475 and consists of three layers and a pre-sampler. The EM end-cap calorimeter consists of three layers in the region 1.375 < |η| < 2.5 (two for 2.5 < |η| < 3.2) and a pre-sampler for 1.5 < |η| < 1.8. The four layers of the HEC calorimeter cover the range 1.5 < |η| < 3.2.
The ATLAS tile calorimeter is a cylindrical hadronic sampling calorimeter. It uses steel as the absorber material and plastic scintilla-tors as the active layers. It covers radii from 2280 to 4230 mm and the η coverage extends to |η| . 1.7. The calorimeter is subdivided into a central barrel covering |η| . 1.0 and an ex-tended barrel covering 0.8 . |η| . 1.7. Both barrel parts are divided into 64 modules and the cells in each module are divided into three layers.
q p (GeV) -2.5 -2 -1.5 -1 -0.5 0 0.5 1 1.5 2 2.5 ) 2 cm -1 dE/dx (MeV g 0 1 2 3 4 5 6 7 8 9 10 1 10 2 10 3 10 4 10 5 10 ATLAS Data 2010 p + K + π p -K π
-Figure 1: Left: Distribution of dE/dx versus charge times momentum for minimum bias collisions in a data sample
from 2010. With tracks reconstructed for pT > 100 MeV this sample is more suitable for the calibration of the
Bethe-Bloch function than 2011 data in which tracks had a cutoff of pT =400 MeV. The distribution of the most
probable value for pions (solid), kaons (dashed) and protons (dotted) are superimposed. The band due to deuterons is clearly visible. Right: Simulated distribution of specific energy loss versus momentum for singly-charged hypothetical R-hadrons of various masses.
3.2.1. Calorimeter β measurement
The ATLAS tile and LAr calorimeters have sufficiently good timing resolutions to distin-guish highly relativistic SM particles from the slower moving LLPs. The time resolution depends on the energy deposited in the cell and also the layer type and thickness, but typ-ical resolutions are 2 ns for an energy de-posit of 1 GeV and generally better for the tile calorimeter.
To ensure the highest possible timing accu-racy, it is necessary to calibrate the data us-ing particles with known speed. This calibra-tion applies a common shift for each run, and is then performed as a function of calorime-ter layer and cell energy. The reliability of such a calibration for this analysis depends on the assumption that the particles used for calibration have similar characteristics to the LLPs in question when depositing energy in the calorimeters. The analysis uses muons for this purpose and it is cross-checked that jets
give a consistent result. The effect of a possi-ble bias in the measured time for late-arriving signals was tested by applying an arrival-time-dependent resolution function and found neg-ligible. The β measurements from all cells assigned to the extrapolated track are com-bined in a cell-energy-weighted average, typ-ically using timing measurements from three or four calorimeter cells. The resolution of the resulting β measurement can be seen in Fig. 2(left). For data (MC) the mean β-value is 0.983 (0.986) and the resolution is 0.090 (0.092).
3.3. The muon detectors
The MS forms the outer part of the ATLAS detector and detects charged particles exiting the calorimeters and measures their momenta in the pseudorapidity range |η| < 2.7. It is also designed to trigger on these particles in the re-gion |η| < 2.4. In the barrel the chambers are arranged in three concentric cylindrical shells
around the beam axis, while in the two end-caps the muon chambers are arranged in three wheels that are perpendicular to the beam axis. The precision momentum measurement is performed by monitored drift tube (MDT) chambers, using the η coordinate. These chambers consist of three to eight layers of drift tubes. In the forward region (2.0 < |η| < 2.7), cathode strip chambers are used in the in-nermost tracking layer. Resistive plate cham-bers (RPC) in the barrel region (|η| < 1.05) and thin gap chambers in the end-cap (1.05 < |η| < 2.4) provide a fast level-1 trigger and measure both the η and φ coordinates of the track. 3.3.1. β measurement in the MS
The default reconstruction of particles in the MDT chambers [48] relies on the assumption that they travel with the speed of light (β = 1). To improve the track quality for slow LLPs, the individual track segments can be recon-structed with different values for β. The ac-tual β of the particle is estimated from the set of segments with the lowest χ2. In a
succes-sive combined track re-fit, including ID and MS hits, the particle trajectory is estimated more accurately. The time-of-flight to each tube is then obtained using the difference be-tween the time-of-flight corresponding to the re-fitted track position in each tube and the time actually measured. By averaging the β values estimated from the time-of-flight in the different tubes an improved MDT β estimation can be achieved.
The RPCs have an intrinsic time resolution of ∼1 ns while the digitised signal is sampled with a 3.12 ns granularity, allowing a measure-ment of the time-of-flight. In the RPCs, β is first calculated separately for each hit from the independent position and time measurements. A single β estimate is obtained by averaging the β values from all the hits.
By definition, in a perfectly calibrated
de-tector, any energetic muon coming from a col-lision at the interaction point will pass the de-tector at t0 = 0. The t0 distributions in the
dif-ferent detector systems are measured and their means used to correct the calibration. The ob-served width of these distributions after cor-rection is used as the error on the time mea-surement in the β fit and to smear times in the simulated samples. The time resolution in the MS (about 3 ns) does not depend on the arrival time.
3.4. Combining β measurements
There are three possible β measurements per track, from the RPCs, the MDTs and the calorimeters. The β measurements from the different detectors are only used if β > 0.2 (the limit of the sensitivity) and if they are consis-tent internally, i.e. the χ2probability of the
av-erage between hits is reasonable (calorimeter) or the RMS of the measurement is consistent with the expected errors (MS). Measurements that are accepted are combined in a weighted average. The weights are obtained from the calculated error of each measurement multi-plied by the pulls of the β distributions for muons from Z boson decays.
Since β is estimated from the measured time-of-flight, for a given resolution on the time measurement, a slower particle has a bet-ter β resolution. Prior to the β estimation, the timing values of the hits in the MC samples are smeared to reproduce the resolution mea-sured in the data. Fig. 2(right) shows the β distribution for selected Z → µµ candidate events in data compared to simulation after having smeared the hit times in simulation as described above. The data are well reproduced by the smeared MC distribution: the mean ues are 1.000 and 0.996 and the resolution val-ues are 0.035 and 0.033 for data and MC, re-spectively. The smearing mechanism repro-duces the measured muon β distribution. The
same time-smearing mechanism is applied to the signal Monte Carlo samples.
4. LLP candidate and event selection 4.1. Trigger selection
This analysis is based on events collected by two main trigger types: single-muon and miss-ing transverse momentum triggers.
4.1.1. Single-muon trigger
The muon trigger and its performance in 2011 data are described in detail in Refer-ences [49, 50]. This analysis uses un-prescaled muon triggers with a pT threshold of 18 GeV.
Offline muons are selected with pT >50 GeV,
well above the trigger threshold.
Level-1 muon triggers are accepted and passed to the high-level trigger only if as-signed to the collision bunch crossing. Late triggers due to late arrival of the particles are thus lost. The trigger efficiency for particles arriving late at the muon spectrometer is dif-ficult to assess from data, where the major-ity of candidates are in-time muons. This ef-ficiency is obtained from simulated R-hadron and GMSB events passing the level-1 trigger simulation. The muon triggers are found to be efficient for GMSB signatures, which contain two typically high-β LLPs that reach the MS, and additional muons stemming from neu-tralino decays. The trigger efficiency increases roughly linearly from zero at β = 0.62 to its full potential of about 90% at β = 0.82 for sleptons and R-hadrons that reach the MS. The estimated trigger efficiency for GMSB slep-ton events is between 70% and 85%. Muon triggers are less efficient for R-hadron events, where one or both of the R-hadrons may be un-charged as they enter the MS and β is typically low.
4.1.2. Missing transverse momentum trigger Since gluinos and squarks are produced via the strong interaction, R-hadron events often contain high-pT jets from QCD radiation. The
modest energy depositions of the R-hadrons themselves combined with these jets natu-rally give rise to missing transverse momen-tum (magnitude denoted as Emiss
T ).
The R-hadron analyses use missing trans-verse momentum triggers utilising only calorimeter information [50, 51] with thresh-olds between 60 and 70 GeV (a full description of the ATLAS trigger system is given in [46]). For the full-detector search the single-muon trigger described in the previous section is used in addition to the Emiss
T trigger. Unlike
the muon trigger, there is no loss of efficiency for the Emiss
T triggers when R-hadrons arrive
late. The efficiency of the Emiss
T triggers
de-creases with increasing R-hadron mass as the relative contribution of gg-initiated processes decreases, though it remains between 15% and 20% for heavy R-hadrons.
4.2. Offline selection
Two different signal types are studied: slep-tons and R-hadrons. Given their different ex-pected interactions with the ATLAS detector, two dedicated LLP candidate and event selec-tions are used as described in the following sections.
4.2.1. Common event selection
Collision events are selected by requiring a good primary vertex, with at least three ID tracks, and with requirements on the position of the reconstructed primary vertex. The pri-mary vertex is defined as the reconstructed ver-tex with the highest P p2
T of associated tracks.
Events recorded during a time where a prob-lem was present in one of the relevant subde-tectors are rejected. Cosmic-ray background is rejected by removing tracks that do not pass
β 0 0.2 0.4 0.6 0.8 1 1.2 1.4 Muons / 0.01 0 20 40 60 80 100 120 140 160 180 200 3 10 × = 0.090 σ Mean = 0.983 = 7 TeV) s Data 2011 ( = 0.092 σ Mean = 0.986 µ µ → MC, Z Calorimeter -1 L dt = 4.7 fb
∫
ATLAS β 0 0.2 0.4 0.6 0.8 1 1.2 1.4 Muons / 0.01 0 10 20 30 40 50 3 10 × = 0.035 σ Mean = 1.000 = 7 TeV) s Data 2011 ( = 0.033 σ Mean = 0.996 µ µ → MC, Z Calorimeter + MS -1 L dt = 4.7 fb∫
ATLASFigure 2: Distribution of β for the calorimeter (left) and combined calorimeter + MS measurements (right) obtained for selected Z → µµ decays in data and MC simulation. The typical resolutions are quoted in the figures.
close to the primary vertex in z. Candidates with an ID track with |ztrk
0 − zvtx0 | > 10 mm or
|dtrk
0 | > 2 mm are removed, where ztrk0 is the
coordinate along the beam direction and dtrk 0
is the transverse impact parameter at the dis-tance of closest approach of the track to the primary vertex. Both requirements are tight-ened to 1.5 mm for the ID-only analysis. For the analyses involving the muon spectrome-ter, events with cosmic rays are also rejected by a topological cut on any two candidates with opposite η and φ (|η1 + η2| < 0.005 and
||φ1− φ2| − π| < 0.005).
4.2.2. Slepton candidate selection
The analysis searching for sleptons requires two muon candidates in each event, because two sleptons are produced, and both have a high probability of being observed in the MS. Two sets of selection criteria are applied. A loose selection with high efficiency is used to select candidates in events where there are two LLP candidates. In events where only one can-didate passes the loose selection, that
candi-date is required to pass a tight selection. Candidates in the loose slepton selection are required to have pT > 50 GeV. The pT
mea-surements in the ID and MS are required to be consistent, so that the difference between the ID pTand the combined fit pT does not exceed
a half of their average. Each candidate is re-quired to have |η| < 2.5. Any two candidates that combine to give an invariant mass close to the Z boson mass (±10 GeV) are both rejected. Candidates are also required to have associated hits in at least two of the three super-layers of precision measurement chambers in the MS.
The number of calorimeter cells plus MS hits contributing to the β measurement must exceed the number of detector (sub)systems used by three. For signal LLPs, the β values are expected to be consistent between the in-dividual measurements, whereas for muons a low β-value is typically due to a poor mea-surement in one detector component and thus not consistent between different components. Therefore the estimated β is required to be consistent for measurements in the same
de-tector system, based on the hit time resolu-tions, and the β measurements from the dif-ferent detector systems are required to be con-sistent with each other. The different detec-tor system measurements of β are required to be pair-wise consistent at the 3σ level, and the combined β to be consistent with the βγ esti-mated in the pixel detector within 3σ. Finally, in order to reduce the muon background, the combined β measurement is required to be less than 0.95.
To pass the tight selection, a candidate is required in addition to have pT > 70 GeV,
at least two separate detector systems measur-ing β, the number of hits minus the number of detector systems participating in the measure-ment be at least twelve, and the consistency between β estimates in different detector sys-tems be within 2σ. These cuts are optimised to give better background rejection.
Finally, a mass cut is applied on the can-didate mass, mβ = p/γβ, calculated from the
candidate’s measured momentum and β. This cut depends on the hypothetical ˜τ mass and is different for different points in the GMSB model parameters space, determined by the ex-pected significance of the signal. For the two-candidate sample, both masses are required to be above the cut.
The number of background and expected signal events above the mass cut in the two-candidate and one-two-candidate signal regions is used to search for the presence of sleptons and R-hadrons.
Typical efficiencies for signal events to pass all cuts including the mass cut are 20% for each of the one and two candidate event cat-egories, giving 40% efficiency in total.
4.2.3. R-hadron candidate selection
Since the R-hadron contains light quarks and gluons in addition to the squark or gluino, the charge of the R-hadron can change
fol-lowing nuclear interactions with the detector material. This possibility makes it difficult to rely on a single detection mechanism without some loss of detection efficiency, as a neutral state would go undetected until the next nu-clear interaction occurs. Some of the main hadronic states regarded in the models consid-ered are neutral, and it is thus natural to take an inside-out approach, starting from the ID track and adding discriminators from outer de-tector systems if a signal is seen along the ex-trapolated track. This is reflected in the three different R-hadron searches; “full-detector”, “MS-agnostic” (not considering the MS) and “ID-only” (relying solely on the ID); mak-ing successively fewer assumptions about the R-hadron scattering model and lifetime. While the first two differ only in their estimate of β (the “MS-agnostic” uses only the calorime-ters) and the utilised triggers, the ID-only se-lection is generally more restrictive in order to reject the larger backgrounds.
In the full-detector and MS-agnostic analy-ses, R-hadron candidates are required to have a good quality ID track with p > 140 GeV and |η| < 2.5. The track must not be within an η− φ distance ∆R =
q
(∆η)2+(∆φ)2 = 0.3 of
any jet with pT > 40 GeV, reconstructed using
the anti-kt jet algorithm [52] with distance
pa-rameter set to 0.4. Furthermore, the track must not have any nearby (∆R < 0.25) tracks with pT > 10 GeV nor pixel hits shared with
an-other track. Tracks with momenta greater than 3.5 TeV are rejected as unphysical. The can-didate must have a good dE/dx measurement and a good estimate of β. The uncertainty on β is required to be less than 10% when mea-sured with the calorimeter only, and less than 4% when the result of a combination.
In the ID-only analysis, selection require-ments are further tightened. Vertices must have more than four associated tracks and
the Emiss
T trigger must be confirmed off-line
(Emiss
T > 85 GeV, including MS contributions)
to ensure better background rejection. Can-didate R-hadron tracks must have more than two (six) pixel (silicon micro-strip) hits, im-pact parameters compatible with the primary vertex, pT > 50 GeV and p > 100 GeV.
The isolation cut is also more severe, reject-ing events that have a track of pT > 1 GeV
within ∆R = 0.25 of the R-hadron candidate. Additionally, tracks are discarded if their mo-mentum resolution exceeds 50%, or if they are identified as an electron.
In events with multiple R-hadron candi-dates, only one – randomly chosen – candidate is used.
The final signal selection in the full-detector and MS-agnostic analyses, optimised for each mass hypothesis, is based on βγ and β requir-ing βγ < 1.5 − 2.0 and β < 0.8 − 0.9, with lower values for higher masses. A signal re-gion is defined in the mβγ-mβ plane for each
mass point. The lower value of the mass cut is set such that it corresponds to being 2σ of the mass resolution below the nominal mass value. The upper value is set to 2.5 TeV. For the ID-only analysis the final selection requires the measured dE/dx value to exceed a certain threshold, which has been set as function of η such that the rejection of MIPs is indepen-dent of η. The selection efficiency for gluino R-hadrons of 900 GeV mass is about 11% and 7% in the full-detector and MS-agnostic analy-ses, respectively. It is about 6% in the ID-only analysis.
An alternative R-hadron model, which is an extension of the triple-Regge model used to describe squark R-hadrons [44] has also been considered. In this model, the signal efficiency is 40% lower at 300 GeV and increasing to the same level at 900 GeV above which it is higher, compared to the model used throughout this analysis.
5. Background estimation
The background for both the slepton and the R-hadron searches is mostly composed of high-pT muons with mis-measured β or large
ionisation. The background estimation is de-rived from data in all cases. The background mass spectrum is estimated by calculating a mass from the pT spectrum of candidates and
the measured β distribution of the background obtained from control samples.
The estimation of the background mass dis-tributions relies on two assumptions: that the signal-to-background ratio before applying cuts on β is small, and that the β distribution for background candidates is due to the finite resolution of the measurement and is therefore independent of the source of the candidate and its momentum. Checks of the validity of these assumptions are discussed in Section 6.3.
The detector is divided into η regions so that the β resolution within each region is similar. The muon β probability density function (pdf) in each η region is the distribution of the mea-sured β of all muons in the region normalised to one. The sample used in producing the β pdf is enlarged with respect to the main se-lection of the analysis by lowering the pT cut
to 30 GeV and removing the Z veto, in order to increase the acceptance and reduce possible signal contamination. Similarly, a βγ pdf is constructed from tracks in a background dom-inated region.
The reconstructed mass distribution of muons in different regions of the detector de-pends on both β and momentum distributions through m = p/γβ. The regions also differ in the muon momentum distribution; therefore the combination of momentum with random β (see below) is done separately in each region and the resulting mass distributions are added together.
5.1. Slepton search
The background is determined by convolut-ing the β-distribution of muons with the ex-pected muon momentum spectrum. The mo-mentum spectrum is determined by selecting candidates that pass all selection requirements listed in Section 4.2.2 apart from the require-ments on β and m. Each candidate then gets as-signed a β-value by drawing it randomly from the muon β distribution. If the assigned β-value is below the cut β-value it is used (to-gether with the measured momentum) to as-sign a mass to the candidate. The statistical un-certainty is reduced by using each muon can-didate multiple times. The distribution of mass values obtained this way gives the background estimate.
5.2. R-hadron searches
For the R-hadron full-detector and MS-agnostic analyses, the momentum, βγ and β are obtained by taking a pT-spectrum of
charged particle tracks from the data and as-signing randomly βγ and β values to these tracks. The mass is then calculated from the measured p value and the assigned value of βγ or β. The mass distributions are then nor-malised to data by scaling to a sideband out-side the signal region.
For the ID-only analysis the choice of the control sample takes into account the non-negligible correlations between p, dE/dx and η. The ionisation dependence on the path length in the sensor is not linear [53], so the pixel dE/dx depends on η; the ionisation also depends on the particle βγ via the Bethe-Bloch formula, and therefore on its momentum, un-til the Fermi plateau is reached; finally p and ηare not uncorrelated. The distributions used for the random-sampling are derived from two categories of background events. They are ob-tained by applying modified selections which ensure that signal contamination is minimised.
• A first sample (“low-ionisation”) is used to generate the η and p distributions. This is selected in the same way as the event candidates, but without the require-ment on high ionisation. Instead, an up-per bound is placed on the dE/dx (at (1.8 MeVg−1cm2)), ensuring
orthogonal-ity with the signal selection.
• A second background sample (“low-momentum”) is used to generate the dE/dx templates. A background sample free of signal but with no upper bound on the dE/dx is obtained by consider-ing tracks that have a maximum momen-tum of 100 GeV. Specifically, tracks in the “low-momentum” background sam-ple satisfy all the event candidate require-ments except that the transverse momen-tum cut is looser, pT > 10 GeV, and the
momentum p is required to be between 40 and 100 GeV (where the Fermi plateau has already been reached).
A large background sample consisting of two million p, η, dE/dx triplets is randomly generated. The momentum is first generated according to a binned function based on “low-ionisation” events. Then the pseudorapidity is generated according to the η(p) binned func-tions based on “low-ionisation” events. Fi-nally the ionisation is generated according to dE/dx(η) binned functions based on “low-momentum” events. The normalisation of the generated background to the selected data is obtained by scaling the background to the data before the high dE/dx cut and in the region of the mass distribution where no signal is ex-pected (mass below 140 GeV).
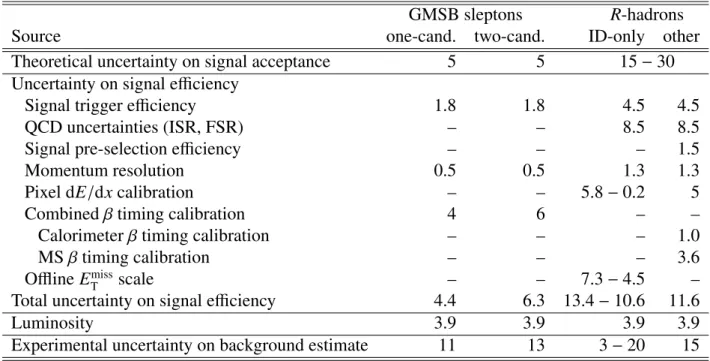
6. Systematic uncertainties
Several possible sources of systematic ef-fects are studied. The resulting systematic
un-certainties are summarised in Table 1. The er-rors given are those on the expected yields in the signal region.
6.1. Theoretical cross-sections
Signal cross-sections are calculated to next-to-leading order in the strong coupling con-stant, adding the resummation of soft gluon emission at next-to-leading-logarithmic accu-racy (NLO+NLL) [54–60]. The nominal cross-section and the uncertainty are taken from an envelope of cross-section predictions using different PDF sets and factorisation and renormalisation scales, as described in Refer-ence [61]. This prescription leads to a 5% rel-ative uncertainty on the expected signal nor-malisation in the slepton search, and a 15% to 30% uncertainty for the R-hadron search, in-creasing with R-hadron mass.
6.2. Expected signal
The muon trigger efficiency is calculated us-ing the tag-and-probe technique on Z → µµ events as described in References [49, 50]. The uncertainty on the single muon trigger ef-ficiency is estimated to be 1%. The reduction in the muon trigger efficiency due to late ar-rival of particles is estimated from simulation. The effect of the difference between data and MC simulation in time alignment of hits in the muon trigger system relative to the LHC clock is estimated by shifting the hit time of the high-est β candidate in each simulated event by 4 ns. The difference in trigger efficiency when this change is applied is between 0.5% and 1.5% for the different GMSB samples, and a sys-tematic uncertainty of 1.5% is assigned. For R-hadrons the systematic uncertainty is esti-mated in the same way and found to be 2%.
The Emiss
T trigger used for the R-hadrons
relies on the emission of jets. Therefore, the trigger efficiency depends on the amount of initial and final state radiation (ISR and
FSR). To evaluate the associated uncertainty, 1 TeV gluino pair-production samples are sim-ulated in Pythia 6.4.26 using the Perugia 2011 tune [62], setting the radiation level low and high. A simple threshold curve modelling of the trigger is applied to all three samples. The largest variation from the central sample is found to be 8.5%.
The Emiss
T triggers use calorimeter energy
deposits to calculate the transverse energy, and are thus blind to muons, which therefore can be used for calibration and to study sys-tematic errors. To evaluate the trigger effi-ciency, the trigger turn-on curve is obtained by fitting the measured efficiency vs. Emiss
T
in Z → µµ events where the Z has a high pT, both in data and simulation. Simulated
events are re-weighted so the distribution of collisions per bunch-crossing match the run-ning conditions of the 2011 data. These ef-ficiency turn-on curves are then applied to the expected Emiss
T spectrum from simulated
R-hadron events. The total uncertainty is es-timated from three contributions: the relative difference between the efficiencies obtained using the fitted threshold curves from Z → µµ data and simulation and the differences in efficiency obtained from independent ±1σ variations in fit parameters relative to the un-changed turn-on curve fit for both Z → µµ data and MC simulation. The total estimated Emiss
T
trigger uncertainty, including effects of a 10% variation of the Emiss
T scale, is a 4.5% relative
error on the efficiency for the signal.
In the ID-only analysis, the effect of the of-fline Emiss
T measurement uncertainty on the
to-tal efficiency is evaluated by applying a scale factor of ± 10% and a smearing of up to 20% to the missing transverse momentum [63]. The resulting uncertainty depends on the R-hadron mass and is between 7.3% (200 GeV) and 4.5% (1500 GeV) of the central value.
between data and MC simulation for the R-hadron full-detector and MS-agnostic searches (excluding the final selection on βγ, β, momentum and mass selection) are evalu-ated using Z → µµ events. The overall relative uncertainty is found to be below 1.5%. The effect of the jet energy scale (JES) uncertainty on the requirement for signal candidates in the R-hadron full-detector and MS-agnostic searches to be separated by ∆R = 0.3 from jets with pT > 40 GeV is found to be negligible.
To verify that the signal efficiency is insen-sitive to the pile-up re-weighting, a 900 GeV gluino sample is divided into samples of high (Nvtx ≥ 8) and low (Nvtx < 8) number of
re-constructed primary vertices. The relative dif-ference in reconstruction efficiency is found to be negligible.
The systematic uncertainty due to the track reconstruction efficiency and momentum reso-lution differences between data and simulation is estimated [64] to be 0.5% on the acceptance for GMSB events. For analyses relying solely on the ID for tracking, the resulting relative uncertainty on the signal efficiency is 1.3%.
Differences in the pixel dE/dx and the sub-sequent measurement of βγ between data and simulation are considered by comparing the pixel dE/dx distribution for high-pT muons
from Z → µµ events in data and MC simula-tion. This uncertainty is estimated to be 5%. In the ID-only analysis, this effect is evalu-ated by comparing the ionisation in data and simulation for MIPs and for particles with low βγ. Scale factors are measured in the two cases and found to be consistent. The uncertainty on the signal efficiency derived by applying these scale factors varies between 0.2% and 5.8% in the studied mass range, decreasing with the particle’s mass.
The signal β resolution is estimated by smearing the measured time of hits in the MS and calorimeter according to the spread
ob-served in the time calibration. The system-atic uncertainty due to the smearing process is estimated by scaling the smearing factor up and down, so as to bracket the distribution ob-tained in data. A 4% (6%) systematic un-certainty is found in the one-candidate (two-candidate) GMSB signal region. The corre-sponding uncertainty for R-hadrons is 3.6%. The uncertainty due to the timing calibration of the calorimeter hits is further tested by com-paring a calibration obtained from jet events to that obtained from muons. This results in a 1% relative systematic uncertainty on the sig-nal yield.
An uncertainty of 3.9% [65, 66] is assigned to the integrated luminosity corresponding to this data set.
6.3. Background estimation
The assumption that the β-pdf is indepen-dent of p is tested by constructing the β-pdf separately in each η-region using a low and a high-momentum sample. This results in dif-ferences of up to 10% on the background es-timate. To quantify the variability of the β and momentum distributions within a region and its effect on the background estimation for sleptons, the detector is sub-divided into 25 η regions instead of the eight used in the analy-sis and the background estimated with this di-vision. The resulting systematic uncertainty is 6.5% for the two-candidate events and 3.1% for one-candidate events. The uncertainty on the background distribution due to the limited numbers of data events used to estimate the momentum distribution was calculated by di-viding the candidate sample randomly into two samples and estimating the background from each sub-sample separately. The resulting er-ror in the slepton search is negligible. A com-parison of the muon β distribution in inclusive muon events to that from Z → µµ decays also exhibited negligible differences. The total
un-certainty on the background estimate for the slepton search is 13% for two-candidate events and 11% for one-candidate events.
The total uncertainty in the background es-timation for the full-detector R-hadron analy-sis is estimated as follows. The βγ and β pdfs are obtained by considering sidebands (lower momenta, for R-hadrons 40–100 GeV). Simi-larly, the momentum pdf is obtained from side-bands in βγ and/or β. Several variations of the size of the sidebands (and also inclusion of the signal region) result in 8–10% uncertainty estimates for each of the two variables. To test the momentum dependence of the β pdf, the number of η bins is varied. The result-ing systematic uncertainty is 2%. To estimate the uncertainty on the background distribution coming from the limited statistics of the data samples used to estimate the momentum dis-tribution, the candidate sample is divided ran-domly into two samples and the background estimate is derived from each sub-sample sep-arately. The resulting uncertainty on the full-detector R-hadron search is 2% for low mass and 5% for high mass. The total uncertainty on the background estimate from the above tests is 15%.
For the ID-only analysis, the statistical un-certainty in the background estimate domi-nates for most of the mass range, and is up to 20%. Other effects contribute at most a few percent. These include variations from differ-ent binning choices for p, η and dE/dx in the two background samples, and a contribution from pile-up effects.
7. Results
The mass distributions observed in data to-gether with the background estimate, its sys-tematic error and examples of signal are shown in Fig. 3, for the two-candidate signal region in the slepton search (top-left), the full-detector
R-hadron search (top-right), the MS-agnostic R-hadron search (bottom-left) and the ID-only R-hadron search (bottom-right).
No indication of signal above the expected background is observed. Upper cross-section limits on new particles are set by counting the number of events passing a set of mass cuts optimised for a given mass point and model. For the ID-only analysis the full mass spec-trum of the background and the hypothetical signal is considered. Cross-section limits are obtained using the CLsprescription [67]. Mass
limits are derived by comparing the obtained cross-section limits to the lower edge of the 1σ band around the theoretically predicted cross-section for each process. A Poisson likeli-hood function is used for the R-hadron limit-setting while a likelihood combining two Pois-son functions is used for the slepton search to benefit from the separation into one-candidate and two-candidate signal regions.
The resulting production cross-section lim-its in the GMSB scenario as a function of the stau mass are presented in Fig. 4 and compared to theoretical predictions. Long-lived staus in GMSB models with N5 = 3, mmessenger =
250 TeV and sign(µ) = 1 are excluded at 95% confidence level (CL) up to a stau mass of 300 GeV for tan β = 5 − 20, and up to stau masses of 285 GeV and 268 GeV for tan β = 30 and tan β = 40, with expected limits of 305 GeV, 287 GeV and 270 GeV respectively. The lower limit on Λ is 99–110 TeV for values of tan β from 5 to 40. For Λ values around this limit, strong production of squarks and gluinos is suppressed due to their large masses. Directly produced sleptons comprise 38–64% of the GMSB cross-section, and depend only on the slepton mass. Using the same analy-sis, directly produced long-lived sleptons, or sleptons decaying to long-lived ones, are ex-cluded at 95% CL up to a ˜τ mass of 278 GeV (273 GeV expected) for models with slepton
) [GeV] 2 ,m 1 min(m 0 100 200 300 400 500 600 Candidates/ 10 GeV -4 10 -3 10 -2 10 -1 10 1 10 2 10 Data (2011, s=7 TeV) (syst) σ 1 ± Bkg estimate =10 β =90 TeV tan Λ GMSB =10 β =110 TeV tan Λ GMSB -1 Ldt=4.7 fb
∫
ATLAS [GeV] β m 200 400 600 800 1000 [GeV]γβ m 200 400 600 800 1000 = 7 TeV) s Data 2011 ( (m=500 GeV) g ~ Signal Signal region ATLAS Full Detector -1 L dt = 4.7 fb∫
[GeV] β m 0 200 400 600 800 1000 1200 1400 Candidates / 20 GeV -1 10 1 10 2 10 -1 Ldt = 4.7 fb∫
MS-agnostic Data 2011 (s = 7 TeV)
(syst) σ 1 ± Bkg estimate (m = 800 GeV) g ~ Signal ATLAS [GeV] γ β m 0 200 400 600 800 1000 1200 1400 Candidates / 20 GeV -1 10 1 10 2 10 -1 Ldt = 4.7 fb
∫
ID-only Data 2011 (s = 7 TeV)
(syst) σ 1 ± Bkg estimate (m = 500 GeV) g ~ Signal (m = 800 GeV) g ~ Signal ATLAS [GeV] γ β m 0 200 400 600 800 1000 1200 1400 Candidates / 20 GeV -1 10 1 10 2 10
Figure 3: Observed data, background estimate and expected signal in the two-candidate signal region in the slepton search (top-left), full-detector R-hadron search (top-right), MS-agnostic R-hadron search (bottom-left) and in the ID-only R-hadron search (bottom-right). For the slepton search ID-only the lower of the two masses is plotted and for the
full-detector R-hadron search there is one candidate in the mβγoverflow bin not shown in the figure. The dashed lines
GMSB sleptons R-hadrons
Source one-cand. two-cand. ID-only other
Theoretical uncertainty on signal acceptance 5 5 15 − 30 Uncertainty on signal efficiency
Signal trigger efficiency 1.8 1.8 4.5 4.5
QCD uncertainties (ISR, FSR) – – 8.5 8.5
Signal pre-selection efficiency – – – 1.5
Momentum resolution 0.5 0.5 1.3 1.3
Pixel dE/dx calibration – – 5.8 − 0.2 5
Combined β timing calibration 4 6 – –
Calorimeter β timing calibration – – – 1.0
MS β timing calibration – – – 3.6
Offline Emiss
T scale – – 7.3 − 4.5 –
Total uncertainty on signal efficiency 4.4 6.3 13.4 − 10.6 11.6
Luminosity 3.9 3.9 3.9 3.9
Experimental uncertainty on background estimate 11 13 3 − 20 15
Table 1: Summary of systematic uncertainties (given in percent). Ranges indicate a mass dependence for the given uncertainty (low mass–high mass).
mass splittings smaller than 50 GeV.
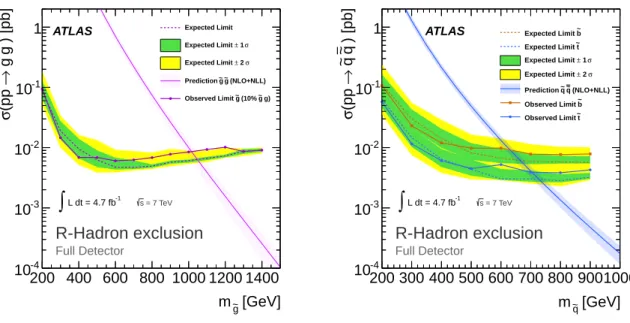
The resulting limits on R-hadrons are shown in Figs. 5 and 6 compared to the theoret-ical cross-sections. Gluino R-hadrons in a generic interaction model are excluded up to a mass of 985 GeV. Stop R-hadrons are ex-cluded up to a mass of 683 GeV, and sbot-tom R-hadrons are excluded up to a mass of 612 GeV. The according expected limits are 1015 GeV, 707 GeV and 645 GeV respectively. The MS-agnostic search yields a lower mass limit of 989 GeV for gluinos, 657 GeV for stops and 618 GeV for sbottoms, with expected limits of 988 GeV, 647 GeV and 615 GeV re-spectively. The MS-agnostic limits are inde-pendent of the fraction of R-hadrons that arrive charged in the MS.
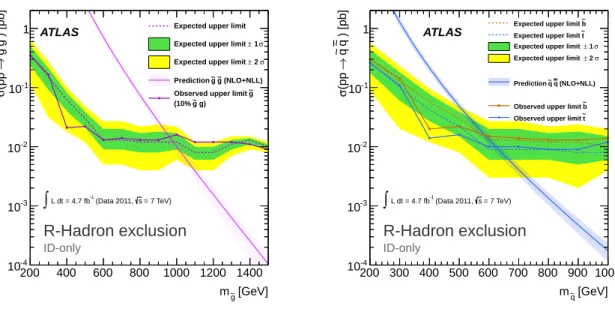
The limits from the ID-only search are shown in Fig. 7 compared to the theoretical cross-sections. Gluino R-hadrons with m < 940 GeV, stop R-hadrons with m < 604 GeV
and sbottom R-hadrons with m < 576 GeV are excluded at 95% CL, with expected limits of 952 GeV, 620 GeV and 571 GeV respectively. The ID-only search has similar sensitivity also to R-hadrons with lifetimes as short as a few ns.
8. Conclusion
Searches for long-lived massive particles were performed using data from pp collisions at √s = 7 TeV collected by the ATLAS de-tector in 2011, corresponding to an integrated luminosity of 4.7 fb−1. Several different
sig-natures are considered. The data are found to match the Standard Model background ex-pectation in all signal regions. The exclusion limits placed for various models impose new constraints on non-SM cross-sections. Long-lived ˜τ’s in the GMSB model considered, for tan β = 5 − 20, are excluded at 95% CL for masses up to 300 GeV, while directly produced
[GeV] τ∼ m 200 250 300 350 400 [pb] σ -3 10 -2 10 95% C.L. limits s CL GMSB production: NLL + NLO Observed Limit σ 1 ± Expected Limit σ 2 ± Expected Limit ATLAS =5000 grav =10, C β >0, tan µ =250 TeV, messenger =3, m 5 GMSB: N =7TeV) s (Data 2011 -1 Ldt=4.7 fb
∫
[TeV] Λ 50 60 70 80 90 100 110 120 130 140 β tan 5 10 15 20 25 30 3540GMSB: N5=3, mmessenger=250 TeV, µ>0, Cgrav=5000
(200 GeV)
τ∼ (250 GeV)τ∼ (300 GeV)τ∼ τ∼(350 GeV) τ∼(400 GeV)
ATLAS Excluded -1 Ldt=4.7 fb
∫
=7TeV s Data 2011, 95% C.L. limits s CL ) theory SUSY σ 1 ± Observed Limit ( ) exp σ 1 ± Expected Limit ( [GeV] τ∼ m 200 250 300 350 400 [pb] σ -3 10 -2 10 95% C.L. limits s CLDirect slepton production: NLO Observed Limit σ 1 ± Expected Limit σ 2 ± Expected Limit ATLAS ) τ∼ decay to µ∼ and e ~ Direct Slepton Production (
=7TeV) s (Data 2011 -1 Ldt=4.7 fb
∫
Figure 4: Cross-section limits as a function of the ˜τ mass in GMSB models (top-left), limits on Λ and tan β in GMSB models (top-right) and the cross-section limits as a function of mass on directly produced sleptons (bottom). The top-left and bottom plots show observed and expected limits with ±1σ and ±2σ uncertainty bands, as well as the theoretical prediction for the cross-section is shown with a 1σ band. In the top-right plot, the observed and expected limits are shown, with the 1σ theoretical uncertainty and the 1σ band, respectively.
[GeV] g ~ m 200 400 600 800 1000 1200 1400 ) [pb] g~ g~ → (pp σ -4 10 -3 10 -2 10 -1 10 1 Expected Limit σ 1 ± Expected Limit σ 2 ± Expected Limit (NLO+NLL) g ~ g ~ Prediction g) g ~ (10% g ~ Observed Limit R-Hadron exclusion Full Detector = 7 TeV s -1 L dt = 4.7 fb
∫
ATLAS [GeV] q ~ m 200 300 400 500 600 700 800 9001000 ) [pb] q~ q~ → (pp σ -4 10 -3 10 -2 10 -1 10 1 Expected Limit b~ t ~ Expected Limit σ 1 ± Expected Limit σ 2 ± Expected Limit (NLO+NLL) q ~ q ~ Prediction b ~ Observed Limit t ~ Observed Limit R-Hadron exclusion Full Detector = 7 TeV s -1 L dt = 4.7 fb∫
ATLASFigure 5: Cross-section upper limits at 95% CL for gluino (left) and squark (right) R-hadrons in the full-detector search are shown. Both the expected limit with ±1σ and ±2σ uncertainty bands and the observed upper limit are given. In addition the theoretical prediction for the production cross-section calculated at NLO+NLL and its uncertainty are drawn. [GeV] g ~ m 200 400 600 800 1000 1200 1400 ) [pb] g~ g~ → (pp σ -4 10 -3 10 -2 10 -1 10 1 Expected Limit σ 1 ± Expected Limit σ 2 ± Expected Limit (NLO+NLL) g ~ g ~ Prediction g) g ~ (10% g ~ Observed Limit R-Hadron exclusion MS-agnostic = 7 TeV s -1 L dt = 4.7 fb
∫
ATLAS [GeV] q ~ m 200 300 400 500 600 700 800 9001000 ) [pb] q~ q~ → (pp σ -4 10 -3 10 -2 10 -1 10 1 Expected Limit b~ t ~ Expected Limit σ 1 ± Expected Limit σ 2 ± Expected Limit (NLO+NLL) q ~ q ~ Prediction b ~ Observed Limit t ~ Observed Limit R-Hadron exclusion MS-agnostic = 7 TeV s -1 L dt = 4.7 fb∫
ATLASFigure 6: Cross-section upper limits at 95% CL for gluino (left) and squark (right) R-hadrons in the MS-agnostic search, which is independent of the fraction of R-hadrons that are charged in the MS. Both the expected limit with ±1σ and ±2σ uncertainty bands and the observed upper limit are given. In addition the theoretical prediction for the production cross-section calculated at NLO+NLL and its uncertainty are drawn.
[GeV] g ~ m 200 400 600 800 1000 1200 1400 ) [pb] g ~ g ~ → (pp σ -4 10 -3 10 -2 10 -1 10
1 Expected upper limit
σ
1
±
Expected upper limit
σ
2
±
Expected upper limit (NLO+NLL) g ~ g ~ Prediction g) g ~ (10% g ~ Observed upper limit
R-Hadron exclusion ID-only = 7 TeV) s (Data 2011, -1 L dt = 4.7 fb ∫ ATLAS [GeV] q ~ m 200 300 400 500 600 700 800 900 1000 ) [pb] q ~ q ~ → (pp σ -4 10 -3 10 -2 10 -1 10 1 b ~ Expected upper limit
t ~ Expected upper limit
σ
1
±
Expected upper limit
σ
2
±
Expected upper limit
(NLO+NLL) q ~ q ~ Prediction b ~ Observed upper limit
t ~ Observed upper limit
R-Hadron exclusion ID-only = 7 TeV) s (Data 2011, -1 L dt = 4.7 fb ∫ ATLAS
Figure 7: Cross-section upper limits at 95% CL for gluino (left) and squark (right) R-hadrons in the ID-only search. Both the expected limit with ±1σ and ±2σ uncertainty bands and the observed upper limit are given. In addition the theoretical prediction for the production cross-section calculated at NLO+NLL and its uncertainty are drawn.
long-lived sleptons, or sleptons decaying to long-lived ones, are excluded at 95% CL up to a ˜τ mass of 278 GeV for models with slepton mass splittings smaller than 50 GeV.
Long-lived R-hadrons containing a gluino (stop, sbottom) are excluded for masses up to 985 GeV (683 GeV, 612 GeV) at 95% CL, for a generic interaction model. Limits obtained independently of the fraction of R-hadrons that arrive charged in the MS ex-clude masses up to 989 GeV (657 GeV, 618 GeV). Furthermore, using only the in-ner detector, R-hadrons are excluded up to 940 GeV (604 GeV, 576 GeV).
These results substantially extend previous ATLAS limits [32, 33], and are complemen-tary to the searches for SUSY particles which decay promptly.
9. Acknowledgements
We thank CERN for the very successful op-eration of the LHC, as well as the support staff
from our institutions without whom ATLAS could not be operated efficiently.
We acknowledge the support of ANPCyT, Argentina; YerPhI, Armenia; ARC, Australia; BMWF and FWF, Austria; ANAS, Azerbai-jan; SSTC, Belarus; CNPq and FAPESP, Brazil; NSERC, NRC and CFI, Canada; CERN; CONICYT, Chile; CAS, MOST and NSFC, China; COLCIENCIAS, Colombia; MSMT CR, MPO CR and VSC CR, Czech Republic; DNRF, DNSRC and Lundbeck Foundation, Denmark; EPLANET, ERC and NSRF, European Union; IN2P3-CNRS, CEA-DSM/IRFU, France; GNSF, Georgia; BMBF, DFG, HGF, MPG and AvH Foundation, Ger-many; GSRT and NSRF, Greece; ISF, MIN-ERVA, GIF, DIP and Benoziyo Center, Israel; INFN, Italy; MEXT and JSPS, Japan; CNRST, Morocco; FOM and NWO, Netherlands; BRF and RCN, Norway; MNiSW, Poland; GRICES and FCT, Portugal; MERYS (MECTS), Roma-nia; MES of Russia and ROSATOM, Russian Federation; JINR; MSTD, Serbia; MSSR,
Slo-vakia; ARRS and MVZT, Slovenia; DST/NRF, South Africa; MICINN, Spain; SRC and Wal-lenberg Foundation, Sweden; SER, SNSF and Cantons of Bern and Geneva, Switzerland; NSC, Taiwan; TAEK, Turkey; STFC, the Royal Society and Leverhulme Trust, United Kingdom; DOE and NSF, United States of America.
The crucial computing support from all WLCG partners is acknowledged gratefully, in particular from CERN and the ATLAS Tier-1 facilities at TRIUMF (Canada), NDGF (Den-mark, Norway, Sweden), CC-IN2P3 (France), KIT/GridKA (Germany), INFN-CNAF (Italy), NL-T1 (Netherlands), PIC (Spain), ASGC (Taiwan), RAL (UK) and BNL (USA) and in the Tier-2 facilities worldwide.
References
[1] H. Miyazawa, Baryon Number Changing Cur-rents, Prog. Theor. Phys. 36 (6) (1966) 1266– 1276.
[2] P. Ramond, Dual Theory for Free Fermions, Phys. Rev. D3 (1971) 2415–2418.
[3] Y. A. Gol’fand, E. P. Likhtman, Extension of the Algebra of Poincare Group Generators and Viola-tion of p Invariance, JETP Lett. 13 (1971) 323– 326, [Pisma Zh.Eksp.Teor.Fiz.13:452-455,1971]. [4] A. Neveu, J. H. Schwarz, Factorizable dual model
of pions, Nucl. Phys. B31 (1971) 86–112. [5] A. Neveu, J. H. Schwarz, Quark Model of Dual
Pions, Phys. Rev. D4 (1971) 1109–1111.
[6] J. Gervais, B. Sakita, Field theory interpretation of supergauges in dual models, Nucl. Phys. B34 (1971) 632–639.
[7] D. V. Volkov, V. P. Akulov, Is the Neutrino a Gold-stone Particle?, Phys. Lett. B46 (1973) 109–110. [8] J. Wess, B. Zumino, A Lagrangian Model
In-variant Under Supergauge Transformations, Phys. Lett. B49 (1974) 52.
[9] J. Wess, B. Zumino, Supergauge Transformations in Four-Dimensions, Nucl. Phys. B70 (1974) 39– 50.
[10] M. Dine, W. Fischler, A Phenomenological Model of Particle Physics Based on Supersymmetry, Phys. Lett. B110 (1982) 227.
[11] L. Alvarez-Gaume, M. Claudson, M. B. Wise, Low-Energy Supersymmetry, Nucl. Phys. B207 (1982) 96.
[12] C. R. Nappi, B. A. Ovrut, Supersymmetric Exten-sion of the SU(3) x SU(2) x U(1) Model, Phys. Lett. B113 (1982) 175.
[13] M. Dine, A. E. Nelson, Dynamical supersym-metry breaking at low-energies, Phys. Rev. D48 (1993) 1277–1287.
[14] M. Dine, A. E. Nelson, Y. Shirman, Low-energy dynamical supersymmetry breaking simplified, Phys. Rev. D51 (1995) 1362–1370.
[15] M. Dine, A. E. Nelson, Y. Nir, Y. Shirman, New tools for low-energy dynamical supersymmetry breaking, Phys. Rev. D53 (1996) 2658–2669. [16] C. F. Kolda, Gauge-mediated supersymmetry
breaking: Introduction, review and update, Nucl. Phys. Proc. Suppl. 62 (1998) 266–275.
[17] ALEPH Collaboration, R. Barate, et al., Search for pair production of longlived heavy charged
parti-cles in e+e−annihilation, Phys. Lett. B405 (1997)
379–388.
[18] DELPHI Collaboration, P. Abreu, et al., Search for
heavy stable and longlived particles in e+e−
colli-sions at √s = 189 GeV, Phys. Lett. B478 (2000) 65–72.
[19] L3 Collaboration, P. Achard, et al., Search for
heavy neutral and charged leptons in e+e−
anni-hilation at LEP, Phys. Lett. B517 (2001) 75–85. [20] OPAL Collaboration, G. Abbiendi, et al., Search
for stable and longlived massive charged particles
in e+e−collisions at √s = 130 GeV to 209 GeV,
Phys. Lett. B572 (2003) 8–20.
[21] H1 Collaboration, A. Aktas, et al., Measurement of anti-deuteron photoproduction and a search for heavy stable charged particles at HERA, Eur. Phys. J. C36 (2004) 413–423.
[22] CDF Collaboration, F. Abe, et al., Search for Heavy Stable Particles at the Fermilab Collider, Phys. Rev. Lett. 63 (1989) 1447.
[23] CDF Collaboration, F. Abe, et al., Limits on the production of massive stable charged particles, Phys. Rev. D46 (1992) 1889–1894.
[24] CDF Collaboration, D. Acosta, et al., Search for long-lived charged massive particles in ¯pp colli-sions at √s = 1.8 TeV, Phys. Rev. Lett. 90 (2003) 131801.
[25] D0 Collaboration, V. M. Abazov, et al., Search for Stopped Gluinos from pp Collisions at √s = 1.96 TeV, Phys. Rev. Lett. 99 (2007) 131801. [26] D0 Collaboration, V. Abazov, et al., Search for
Long-Lived Charged Massive Particles with the D0 Detector, Phys. Rev. Lett. 102 (2009) 161802. [27] CDF Collaboration, T. Aaltonen, et al., Search for Long-Lived Massive Charged Particles in 1.96 TeV ¯pp Collisions, Phys. Rev. Lett. 103 (2009) 021802.
[28] D0 Collaboration, V. M. Abazov, et al., Search for Charged Massive Long-Lived Particles, Phys. Rev. Lett. 108 (2012) 121802.
[29] CMS Collaboration, Search for Stopped Gluinos in pp collisions at √s = 7 TeV, Phys. Rev. Lett. 106 (2011) 011801.
[30] CMS Collaboration, Search for Heavy Stable Charged Particles in pp collisions at √s = 7 TeV, JHEP 1103 (2011) 024.
[31] ATLAS Collaboration, Search for Massive Long-lived Highly Ionising Particles with the ATLAS Detector at the LHC, Phys. Lett. B698 (2011) 353–370.
[32] ATLAS Collaboration, Search for stable hadronis-ing squarks and gluinos with the ATLAS experi-ment at the LHC, Phys. Lett. B701 (2011) 1–19. [33] ATLAS Collaboration, Search for Heavy
Long-Lived Charged Particles with the ATLAS detector in pp collisions at √s = 7 TeV, Phys. Lett. B703 (2011) 428–446.
[34] ATLAS Collaboration, Search for decays of stopped, long-lived particles from 7 TeV pp colli-sions with the ATLAS detector, Eur. Phys. J. C72 (2012) 1965.
[35] CMS Collaboration, Search for heavy long-lived charged particles in pp collisions at √s = 7 TeV, CMS-EXO-11-022, CERN-PH-EP-2012-093 . [36] G. Engelhard, J. L. Feng, I. Galon, D. Sanford,
F. Yu, SPICE: Simulation Package for Including Flavor in Collider Events, Comput. Phys. Com-mun. 181 (2010) 213–226.
[37] G. Corcella, et al., HERWIG 6.5: an event genera-tor for Hadron Emission Reactions With Interfer-ing Gluons (includInterfer-ing supersymmetric processes), JHEP 01 (2001) 010.
[38] T. Sjostrand, S. Mrenna, P. Skands, PYTHIA 6.4 Physics and Manual, JHEP 05 (2006) 026. [39] The source code for the dedicated R-hadron
hadronisation routines can be downloaded from: http://home.thep.lu.se/~torbjorn/
pythiaaux/recent.html.
[40] A. C. Kraan, Interactions of heavy stable hadronizing particles, Eur. Phys. J. C37 (2004) 91–104.
[41] G. Farrar, R. Mackeprang, D. Milstead, J. Roberts,
Limit on the mass of a long-lived or stable gluino, JHEP 1102 (2011) 018.
[42] GEANT4 Collaboration, S. Agostinelli, et al., GEANT4: A simulation toolkit, Nucl. Instrum. Meth. A506 (2003) 250–303.
[43] http://r-hadrons.web.cern.ch/ r-hadrons/.
[44] R. Mackeprang, D. Milstead, An Updated Description of Heavy-Hadron Interactions in GEANT-4, Eur.Phys.J. C66 (2010) 493–501. [45] C. Alexa, S. Constantinescu, S. Dita, Geant4
hadronic physics validation with ATLAS tile calorimeter test-beam data, AIP Conf. Proc. 867 (2006) 463–470.
[46] ATLAS Collaboration, The ATLAS Experiment at the CERN Large Hadron Collider, JINST 3 (2008) S08003.
[47] ATLAS Collaboration, dE/dx measurement in the ATLAS Pixel Detector and its use for particle identification, ATLAS-CONF-2011-016 .
[48] ATLAS Collaboration, Expected Performance of the ATLAS Experiment - Detector, Trigger and Physics, CERN-OPEN-2008-020 .
[49] ATLAS Collaboration, Performance of the AT-LAS muon trigger in 2011, ATAT-LAS-CONF-2012- ATLAS-CONF-2012-099 .
[50] ATLAS Collaboration, Performance of the AT-LAS Trigger System in 2010, Eur.Phys.J. C72 (2012) 1849.
[51] D. Casadei, et al., The implementation of the
ATLAS missing ET triggers for the initial LHC
operation, Tech. Rep. ATL-DAQ-PUB-2011-001, CERN, Geneva, 2011.
[52] G. Cacciari, G. P. Salam, G. Soyez, The anti-ktjet
clustering algorithm, JHEP 04 (2008) 063. [53] H. Bichsel, Straggling in thin silicon detectors,
Rev. Mod. Phys. 60 (1988) 663–699.
[54] W. Beenakker, R. Hopker, M. Spira, P. M. Zerwas, Squark and gluino production at hadron colliders, Nucl. Phys. B492 (1997) 51–103.
[55] W. Beenakker, M. Kramer, T. Plehn, M. Spira, P. M. Zerwas, Stop production at hadron colliders, Nucl. Phys. B515 (1998) 3–14.
[56] A. Kulesza, L. Motyka, Threshold resummation for squark-antisquark and gluino-pair production at the LHC, Phys. Rev. Lett. 102 (2009) 111802. [57] A. Kulesza, L. Motyka, Soft gluon resummation
for the production of gluino-gluino and squark-antisquark pairs at the LHC, Phys. Rev. D80 (2009) 095004.
A. Kulesza, E. Laenen, et al., Soft-gluon resum-mation for squark and gluino hadroproduction, JHEP 0912 (2009) 041.
[59] W. Beenakker, S. Brensing, M. Kramer, A. Kulesza, E. Laenen, I. Niessen, Super-symmetric top and bottom squark production at hadron colliders, JHEP 1008 (2010) 098.
[60] W. Beenakker, S. Brensing, M. Kramer, A. Kulesza, E. Laenen, et al., Squark and gluino hadroproduction, Int. J. Mod. Phys. A26 (2011) 2637–2664.
[61] M. Kramer, A. Kulesza, R. van der Leeuw, M. Mangano, S. Padhi, et al., Supersymmetry pro-duction cross sections in pp collisions at √s = 7 TeV, CERN-PH-TH-2012-163 .
[62] P. Z. Skands, Tuning Monte Carlo Generators: The Perugia Tunes, Phys. Rev. D82 (2010) 074018.
[63] ATLAS Collaboration, Jet energy measurement with the ATLAS detector in proton-proton colli-sions at sqrt(s) = 7 TeV .
[64] ATLAS Collaboration, Muon reconstruction ef-ficiency in reprocessed 2010 LHC proton-proton collision data recorded with the ATLAS detector, ATLAS-CONF-2011-063 .
[65] ATLAS Collaboration, Luminosity Determination in pp Collisions at √s = 7 TeV using the ATLAS Detector in 2011, ATLAS-CONF-2011-116 . [66] ATLAS Collaboration, Luminosity Determination
in pp Collisions at √s = 7 TeV using the ATLAS Detector at the LHC, Eur. Phys. J. C 71 (2011) 1630.
[67] A. L. Read, Presentation of search results: the CLs technique, J. Phys. G 28 (2002) 2693.
Appendix A. Auxiliary material
Appendix consists of Figs. A.8–A.18 and Tables A.2–A.9.
q p (GeV) -2.5 -2 -1.5 -1 -0.5 0 0.5 1 1.5 2 2.5 ) 2 cm -1 dE/dx (MeV g 0 1 2 3 4 5 6 7 8 9 10 1 10 2 10 3 10 4 10 5 10 ATLAS Data 2010 p + K + π p -K π
-Figure A.8: Greyscale-printing version of Fig. 1(left): Distribution of dE/dx versus charge times momentum for
minimum bias collisions in a data sample from 2010. With tracks reconstructed for pT>100 MeV this sample is more
suitable for the calibration of the Bethe-Bloch function than 2011 data in which tracks had a cutoff of pT =400 MeV.
The distribution of the most probable value for pions (solid), kaons (dashed) and protons (dotted) are superimposed. The band due to deuterons is clearly visible.
Truth β 0.2 0.3 0.4 0.5 0.6 0.7 0.8 0.9 1 E ff ic ie n c y 0.1 0.2 0.3 0.4 0.5 0.6 0.7 0.8 0.9 1 ATLAS Simulation β
Trigger efficiency as a function of
Truth β 0.3 0.4 0.5 0.6 0.7 0.8 0.9 1 Candidates 0 5000 10000 15000 20000 25000 30000 35000 ATLAS Simulation in GMSB Events β in event β Highest β Candidate
Figure A.9: Left: Muon trigger efficiency in simulated GMSB events as a function of the highest β candidate in the event. Right: Distribution of β for candidates with the highest β (black) and for all candidates in the events (red). Low-β candidates are found in triggered events because there is a high-β slepton or muon in the event that could trigger. (For interpretation of the references to colour in this figure legend, the reader is referred to the web version of this Letter.)
40 GeV × Background Events / 40 0 20 40 60 80 100 120 140 [GeV] β m 200 400 600 800 1000 [GeV] γβ m 200 400 600 800 1000 = 7 TeV) s Data 2011 ( Background Estimate (m=300 GeV) g ~ Signal Signal region ATLAS Full Detector -1 L dt = 4.7 fb
∫
40 GeV× Background Events / 40 0 10 20 30 40 50 60 70 80 90 [GeV] β m 200 400 600 800 1000 [GeV] γβ m 200 400 600 800 1000 = 7 TeV) s Data 2011 ( Background Estimate (m=700 GeV) g ~ Signal Signal region ATLAS Full Detector -1 L dt = 4.7 fb∫
40 GeV × Background Events / 40 0 20 40 60 80 100 [GeV] β m 200 400 600 800 1000 [GeV]γβ m 200 400 600 800 1000 = 7 TeV) s Data 2011 ( Background Estimate (m=900 GeV) g ~ Signal Signal region ATLAS Full Detector -1 L dt = 4.7 fb∫
40 GeV× Background Events / 40 0 5 10 15 20 25 30 35 40 45 [GeV] β m 200 400 600 800 10001200140016001800 [GeV]γβ m 200 400 600 800 1000 1200 1400 1600 1800 = 7 TeV) s Data 2011 ( Background Estimate (m=1000 GeV) g ~ Signal Signal region ATLAS Full Detector -1 L dt = 4.7 fb∫
Figure A.10: Examples of the mβγ vs. mβ distributions for gluino R-hadrons with masses of 300, 700, 900 and
1000 GeV, with the full-detector search. The figures show data, background and signal after β, βγ and p cuts. The dashed grey line highlights the counting window for each specific hypothesis, and is defined by requiring 90% of the