EUROPEAN ORGANISATION FOR NUCLEAR RESEARCH (CERN)
JHEP 07 (2018) 089
DOI:10.1007/JHEP07(2018)089
CERN-EP-2018-031 19th July 2018
Search for pair production of up-type vector-like
quarks and for four-top-quark events in final states
with multiple
b-jets with the ATLAS detector
The ATLAS Collaboration
A search for pair production of up-type vector-like quarks (T ) with a significant branching ratio into a top quark and either a Standard Model Higgs boson or a Z boson is presented. The same analysis is also used to search for four-top-quark production in several new physics scenarios. The search is based on a dataset of pp collisions at
√
s= 13 TeV recorded in 2015 and 2016
with the ATLAS detector at the CERN Large Hadron Collider and corresponds to an integrated
luminosity of 36.1 fb−1. Data are analysed in the lepton+jets final state, characterised
by an isolated electron or muon with high transverse momentum, large missing transverse
momentum and multiple jets, as well as the jets+ETmiss final state, characterised by multiple
jets and large missing transverse momentum. The search exploits the high multiplicity of jets identified as originating from b-quarks, and the presence of boosted, hadronically decaying top quarks and Higgs bosons reconstructed as large-radius jets, characteristic of signal events. No significant excess above the Standard Model expectation is observed, and 95% CL upper limits are set on the production cross sections for the different signal processes considered. These cross-section limits are used to derive lower limits on the mass of a vector-like T quark under several branching ratio hypotheses assuming contributions from T → W b, Zt, Ht decays. The 95% CL observed lower limits on the T quark mass range between 0.99 TeV and 1.43 TeV for all possible values of the branching ratios into the three decay modes considered, significantly extending the reach beyond that of previous searches. Additionally, upper limits on anomalous four-top-quark production are set in the context of an effective field theory model, as well as in an universal extra dimensions model.
© 2018 CERN for the benefit of the ATLAS Collaboration.
Reproduction of this article or parts of it is allowed as specified in the CC-BY-4.0 license.
1 Introduction
The discovery of a new particle consistent with the Standard Model (SM) Higgs boson by the ATLAS [1]
and CMS [2] experiments at the Large Hadron Collider (LHC) represents a milestone in high-energy
physics. A comprehensive programme of measurements of the Higgs boson properties to unravel its nature is underway at the LHC, so far yielding results compatible with the SM predictions. This makes it more urgent than ever before to provide an explanation for why the electroweak mass scale (and the Higgs boson mass along with it) is so small compared to the Planck scale, a situation known as the hierarchy
problem. Naturalness arguments [3] require that quadratic divergences that arise from radiative corrections
to the Higgs boson mass are cancelled out by some new mechanism in order to avoid fine-tuning. To that effect, several explanations have been proposed in theories beyond the SM (BSM).
One such solution involves the existence of a new strongly interacting sector, in which the Higgs boson
would be a pseudo–Nambu–Goldstone boson [4] of a spontaneously broken global symmetry. One
particular realisation of this scenario, referred to as Composite Higgs [5, 6], addresses many open
questions in the SM, such as the stability of the Higgs boson mass against quantum corrections, and the hierarchy in the mass spectrum of the SM particles, which would be explained by partial compositeness. In this scenario, the top quark would be a mostly composite particle, while all other SM fermions would be mostly elementary. A key prediction is the existence of new fermionic resonances referred to as vector-like quarks, which are also common in many other BSM scenarios. Vector-like quarks are defined as colour-triplet spin-1/2 fermions whose left- and right-handed chiral components have the same transformation
properties under the weak-isospin SU(2) gauge group [7,8]. Depending on the model, vector-like quarks
are classified as SU(2) singlets, doublets or triplets of flavours T , B, X or Y , in which the first two have the same charge as the SM top and bottom quarks while the vector-like Y and X quarks have charge −4/3e and 5/3e. In addition, in these models, vector-like quarks are expected to couple preferentially
to third-generation quarks [7,9] and can have flavour-changing neutral-current decays in addition to the
charged-current decays characteristic of chiral quarks. As a result, an up-type T quark can decay not only into a W boson and a b-quark, but also into a Z or Higgs boson and a top quark (T → W b, Zt, and Ht). Similarly, a down-type B quark can decay into a Z or Higgs boson and a b quark, in addition to decaying into a W boson and a top quark (B → W t, Z b and Hb). Vector-like Y quarks decay exclusively into W b and vector-like X quarks decay exclusively into Wt. To be consistent with the results from precision electroweak measurements a small mass-splitting between vector-like quarks belonging to the same SU(2)
multiplet is required, but no requirement is placed on which member of the multiplet is heavier [10]. At
the LHC, vector-like quarks with masses below ∼1 TeV would be predominantly produced in pairs via the strong interaction. For higher masses, single production, mediated by the electroweak interaction, may dominate depending on the coupling strength of the interaction between the vector-like quark and the SM quarks.
Another prediction of the Composite Higgs paradigm, as well as other BSM scenarios, such as Randall– Sundrum extra dimensions, is the existence of new heavy vector resonances, which would predominantly
L4t = |C4t|
Λ2 (¯tRγ µt
R)(¯tRγµtR),
where tR is the right-handed top quark spinor, γµ are the Dirac matrices, C4t is the coupling constant,
and Λ is the energy scale above which the effects of direct production of new vector particles must be considered. Anomalous four-top-quark production also arises in Universal Extra Dimensions (UED) models, which involve new heavy particles. For instance, in an UED model with two extra dimensions
that are compactified using the geometry of the real projective plane (2UED/RPP) [18], the momenta of
particles are discretised along the directions of the extra dimensions. A tier of Kaluza–Klein (KK) towers is labelled by two integers, k and `, referred to as “tier (k, `)”. Within a given tier, the squared masses of
the particles are given at leading order by m2 = k2/R42+ `2/R52, where πR4and πR5 are the sizes of the
two extra dimensions. The model is parameterised by R4 and R5 or, alternatively, by mKK = 1/R4 and
ξ = R4/R5. Four-top-quark production can arise from tier (1,1), where particles from this tier have to be
pair produced because of symmetries of the model. Then they chain-decay into the lightest particle of this
tier, the heavy photon A(1,1), by emitting SM particles. The branching ratios of A(1,1) into SM particles
are not predicted by the model, although the decay into t ¯t is expected to be dominant [19].
This paper presents a search for T ¯T production with at least one T quark decaying into Ht with H → b ¯b, or
into Zt with Z → ν ¯ν, as well as for anomalous four-top-quark production within an EFT model and within
the 2UED/RPP model (see Figure1). Recent searches for T ¯T production have been performed by the
ATLAS [20,21] and CMS [22,23] collaborations using up to 36.1 fb−1of pp collisions at
√
s = 13 TeV.
The most restrictive 95% CL lower limits on the T quark mass obtained are 1.35 TeV and 1.16 TeV, corresponding to branching ratio assumptions of B(T → W b) = 1 and B(T → Zt) = 1, respectively. Previous searches for anomalous t ¯tt ¯t production have been performed by the ATLAS Collaboration using
the full Run-1 dataset [24,25], where 95% CL limits of |C4t|/Λ2 < 6.6 TeV−2and mK K > 1.1 TeV were
obtained in the case of the EFT and the 2UED/RPP models, respectively. A recent search by the CMS
Collaboration [26] using 35.9 fb−1of pp collisions at
√
s = 13 TeV has set an upper limit of 41.7 fb on
the SM t ¯tt ¯t production cross section, about 4.5 times the SM prediction, thus placing some constraints on anomalous production with kinematics like in the SM.
This search uses 36.1 fb−1of data at
√
s = 13 TeV recorded in 2015 and 2016 by the ATLAS Collaboration,
and it closely follows the strategy developed in Run 1 [25], although it incorporates new ingredients, such
as the identification of boosted objects, to substantially enhance sensitivity for heavy resonances. Data are analysed in the lepton+jets final state, characterised by an isolated electron or muon with high transverse momentum, large missing transverse momentum and multiple jets and, for the first time in searches for
vector-like quarks, also in the jets+ETmiss final state, characterised by multiple jets and large missing
T ¯ T W −, H, Z ¯b, ¯t, ¯t t H g g (a) g g t t ¯t ¯t ¯t t (b) u g g(1,1) u(1,1) L g(1,1) ¯c c(1,1)L c Z(1,1) µ+ µ−(1,1) A(1,1) µ µ− W+(1,1) d τ+ ν(1,1) τ A(1,1) µ ντ t ¯t t ¯t (c)
Figure 1: Representative leading-order Feynman diagrams for the signals probed by this search: (a) T ¯T production, and (b) four-top-quark production via an effective four-top-quark interaction in an effective field theory model, and (c) four-top-quark production via cascade decays from Kaluza–Klein excitations in a universal extra dimensions model with two extra dimensions compactified using the geometry of the real projective plane.
2 ATLAS detector
The ATLAS detector [27] at the LHC covers almost the entire solid angle around the collision point,1
and consists of an inner tracking detector surrounded by a thin superconducting solenoid producing a 2 T axial magnetic field, electromagnetic and hadronic calorimeters, and a muon spectrometer incor-porating three large toroid magnet assemblies. The inner detector consists of a high-granularity silicon
pixel detector, including the insertable B-layer [28], installed in 2014, and a silicon microstrip tracker,
together providing a precise reconstruction of tracks of charged particles in the pseudorapidity range
|η| < 2.5, complemented by a transition radiation tracker providing tracking and electron identification
information for |η| < 2.0. The calorimeter system covers the pseudorapidity range |η| < 4.9. Within the region |η| < 3.2, electromagnetic (EM) calorimetry is provided by barrel and endcap high-granularity lead/liquid-argon (LAr) electromagnetic calorimeters, with an additional thin LAr presampler covering
|η| < 1.8, to correct for energy loss in material upstream of the calorimeters. Hadronic calorimetry is
provided by a steel/scintillator-tile calorimeter, segmented into three barrel structures within |η| < 1.7, and two copper/LAr hadronic endcap calorimeters. The solid angle coverage is completed with forward copper/LAr and tungsten/LAr calorimeter modules optimised for electromagnetic and hadronic measure-ments, respectively. The muon spectrometer measures the trajectories of muons with |η| < 2.7 using multiple layers of high-precision tracking chambers located in a toroidal field of approximately 0.5 T and 1 T in the central and endcap regions of ATLAS, respectively. The muon spectrometer is also
instru-mented with separate trigger chambers covering |η| < 2.4. A two-level trigger system [29], consisting
of a hardware-based Level-1 trigger followed by a software-based High-Level Trigger (HLT), is used to reduce the event rate to a maximum of around 1 kHz for offline storage.
3 Object reconstruction
Interaction vertices from the proton–proton collisions are reconstructed from at least two tracks with
transverse momentum (pT) larger than 400 MeV that are consistent with originating from the beam
collision region in the x–y plane. If more than one primary vertex candidate is found, the candidate whose
associated tracks form the largest sum of squared pT[30] is selected as the hard-scatter primary vertex.
Electron candidates [31,32] are reconstructed from energy clusters in the EM calorimeter that are matched
to reconstructed tracks in the inner detector and have pT > 30 GeV and |ηcluster| < 2.47; candidates
in the transition region between the EM barrel and endcap calorimeter (1.37 < |ηcluster| < 1.52) are
excluded. They are also required to satisfy the “tight” likelihood-based identification criteria [31] based
on calorimeter, tracking and combined variables that provide separation between electrons and jets. Muon
candidates [33] are reconstructed by matching track segments in different layers of the muon spectrometer
to tracks found in the inner detector. The resulting muon candidates are refitted using the complete track
information from both detector systems and are required to have pT > 30 GeV and |η| < 2.5. Electron
(muon) candidates are matched to the primary vertex by requiring that the significance of their transverse
impact parameter, d0, satisfies |d0/σ(d0)| < 5(3), where σ(d0) is the measured uncertainty in d0, and by
requiring that their longitudinal impact parameter, z0, satisfies |z0sin θ | < 0.5 mm. To further reduce the
background from non-prompt leptons, photon conversions and hadrons, lepton candidates are also required
to be isolated. A lepton isolation criterion is defined by calculating the quantity IR = Í ptrkT , where the
sum includes all tracks (excluding the lepton candidate itself) within the cone defined by ∆R < Rcutabout
the direction of the lepton. The value of Rcut is the smaller of rmin and 10 GeV/p`T, where rmin is set
to 0.2 (0.3) for electron (muon) candidates, and p`T is the lepton pT. All lepton candidates must satisfy
IR/p`T < 0.06.
Candidate jets are reconstructed with the anti-kt algorithm [34–36] with a radius parameter R = 0.4
(referred to as “small-R jets”), using topological clusters [37] built from energy deposits in the calorimeters
calibrated to the electromagnetic scale. The reconstructed jets are then calibrated to the particle level by the application of a jet energy scale derived from simulation and in situ corrections based on
√
s = 13 TeV
data [38]. Calibrated jets are required to have pT > 25 GeV and |η| < 2.5. Quality criteria are imposed
to reject events that contain any jets arising from non-collision sources or detector noise [39]. To reduce
the contamination due to jets originating from pile-up interactions, an additional requirement on the Jet
Vertex Tagger (JVT) [40] output is made for jets with pT < 60 GeV and |η| < 2.4.
Jets containing b-hadrons are identified (b-tagged) via an algorithm [41,42] that uses multivariate
tech-niques to combine information about the impact parameters of displaced tracks and the topological properties of secondary and tertiary decay vertices reconstructed within the jet. For each jet, a value for the multivariate b-tagging discriminant is calculated. In this analysis, a jet is considered b-tagged if this value is above the threshold corresponding to an average 77% efficiency to tag a b-quark jet, with
a light-jet2rejection factor of ∼134 and a charm-jet rejection factor of ∼6.2, as determined for jets with
pT> 20 GeV and |η| < 2.5 in simulated t¯t events.
Overlaps between candidate objects are removed sequentially. Firstly, electron candidates that lie within
∆R = 0.01 of a muon candidate are removed to suppress contributions from muon bremsstrahlung.
Overlaps between electron and jet candidates are resolved next, and finally, overlaps between remaining jet candidates and muon candidates are removed. Clusters from identified electrons are not excluded during jet reconstruction. In order to avoid double-counting of electrons as jets, the closest jet whose axis
is within ∆R = 0.2 of an electron is discarded. If the electron is within ∆R = 0.4 of the axis of any jet after this initial removal, the jet is retained and the electron is removed. The overlap removal procedure between the remaining jet candidates and muon candidates is designed to remove those muons that are likely to have arisen in the decay chain of hadrons and to retain the overlapping jet instead. Jets and muons
may also appear in close proximity when the jet results from high-pT muon bremsstrahlung, and in such
cases the jet should be removed and the muon retained. Such jets are characterised by having very few
matching inner-detector tracks. Selected muons that satisfy ∆R(µ, jet) < 0.04 + 10 GeV/pµT are rejected
if the jet has at least three tracks originating from the primary vertex; otherwise the jet is removed and the muon is kept.
The candidate small-R jets surviving the overlap removal procedure discussed above are used as inputs for
further jet reclustering [43] using the anti-kt algorithm with a radius parameter R = 1.0. In this way it is
possible to evaluate the uncertainty in the mass of the large-R jets that arises from the uncertainties in the energy scale and resolution of its constituent small-R jets. In order to suppress contributions from pile-up
and soft radiation, the reclustered large-R (RCLR) jets are trimmed [44] by removing all small-R (sub)jets
within a RCLR jet that have pT below 5% of the pTof the reclustered jet. Due to the pile-up suppression
and pT > 25 GeV requirements made on the small-R jets, the average fraction of small-R jets removed
by the trimming requirement is less than 1%. The resulting RCLR jets are required to have |η| < 2.0
and are used to identify high-pT hadronically decaying top quark or Higgs boson candidates by making
requirements on their transverse momentum, mass, and number of constituents. Hadronically decaying
top quark candidates are reconstructed as RCLR jets with pT > 300 GeV, mass larger than 140 GeV, and
at least two subjets. Higgs boson candidates are reconstructed as RCLR jets with pT > 200 GeV, a mass
between 105 and 140 GeV, and a pT-dependent requirement on the number of subjets (exactly two for
pT< 500 GeV, and one or two for pT > 500 GeV). In the following, these are referred to as “top-tagged”
and “Higgs-tagged” jets, respectively, while the term “jet” without further qualifiers is used to refer to small-R jets.
The missing transverse momentum ®pTmiss (with magnitude ETmiss) is defined as the negative vector sum
of the pT of all selected and calibrated objects in the event, including a term to account for energy from
soft particles in the event which are not associated with any of the selected objects. This soft term is calculated from inner-detector tracks matched to the selected primary vertex to make it more resilient to
contamination from pile-up interactions [45,46].
4 Data sample and event preselection
This search is based on a dataset of pp collisions at √
s = 13 TeV with 25 ns bunch spacing collected by
the ATLAS experiment in 2015 and 2016, corresponding to an integrated luminosity of 36.1 fb−1. Only
events recorded with a single-electron trigger, a single-muon trigger, or a ETmisstrigger under stable beam
Preselection requirements
Requirement 1-lepton channel 0-lepton channel
Trigger Single-lepton trigger ETmisstrigger
Leptons =1 isolated e or µ =0 isolated e or µ
Jets ≥5 jets ≥6 jets
b-tagging ≥2 b-tagged jets ≥2 b-tagged jets
Emiss T E miss T > 20 GeV E miss T > 200 GeV
Other ETmiss-related ETmiss+ mWT > 60 GeV ∆φ4jmin> 0.4
Table 1: Summary of preselection requirements for the 1-lepton and 0-lepton channels. Here mWT is the transverse mass of the lepton and the ETmissvector, and ∆φ4jminis the minimum azimuthal separation between the ETmissvector and each of the four highest-pTjets.
an ETmiss threshold of 70 GeV in the HLT in 2015 and a run-period-dependent ETmiss threshold varying
between 90 GeV and 110 GeV in 2016.
Events satisfying the trigger selection are required to have at least one primary vertex candidate. They are then classified into the “1-lepton” or “0-lepton” channels depending on the multiplicity of selected leptons. Events in the 1-lepton channel are required to satisfy a single-lepton trigger and to have exactly one selected electron or muon that matches, with ∆R < 0.15, the lepton reconstructed by the trigger. In the following, 1-lepton events satisfying either the electron or muon selections are combined and treated
as a single analysis channel. Events in the 0-lepton channel are required to satisfy the ETmiss trigger and
to have no selected leptons. In addition, events in the 1-lepton (0-lepton) channel are required to have ≥5 (≥6) small-R jets. In the following, all selected small-R jets are considered, including those used to build large-R jets. For both channels, backgrounds that do not include b-quark jets are suppressed by requiring at least two b-tagged jets.
Additional requirements are made to suppress the background from multijet production. In the case of
the 1-lepton channel, requirements are made on ETmissas well as on the transverse mass of the lepton and
Emiss T system (m W T ):3 E miss T > 20 GeV and E miss T + m W
T > 60 GeV. In the case of the 0-lepton channel, the
requirements are ETmiss > 200 GeV (for which the ETmisstrigger is fully efficient) and ∆φ4jmin> 0.4, where
∆φ4j
minis the minimum azimuthal separation between ®p
miss
T and each of the four highest-pTjets. The latter
requirement in the 0-lepton channel is very effective in suppressing multijet events, where the large ETmiss
results from the mismeasurement of a high-pTjet or the presence of neutrinos emitted close to a jet axis.
The above requirements are referred to as the “preselection” and are summarised in Table1.
5 Signal and background modelling
Signal and most background processes were modelled using Monte Carlo (MC) simulations. In the
simulation, the top quark and SM Higgs boson masses were set to 172.5 GeV and 125 GeV, respectively. 3mW
T = q
2p`TETmiss(1 − cos ∆φ), where p`Tis the transverse momentum (energy) of the muon (electron) and ∆φ is the azimuthal
All simulated samples, except those produced with the Sherpa [47] event generator, utilised EvtGen
v1.2.0 [48] to model the decays of heavy-flavour hadrons. To model the effects of pile-up, events from
minimum-bias interactions were generated using the Pythia 8.186 [49] event generator and overlaid onto
the simulated hard-scatter events according to the luminosity profile of the recorded data. The generated
events were processed through a simulation [50] of the ATLAS detector geometry and response using
Geant4 [51]. A faster simulation, where the full Geant4 simulation of the calorimeter response is
replaced by a detailed parameterisation of the shower shapes [52], was adopted for some of the samples
used to estimate systematic uncertainties. Simulated events are processed through the same reconstruction software as the data, and corrections are applied so that the object identification efficiencies, energy scales and energy resolutions match those determined from data control samples.
5.1 Signal modelling
Samples of simulated T ¯T events were generated with the leading-order (LO) generator4 Protos 2.2 [8,
53] using the NNPDF2.3 LO [54] parton distribution function (PDF) set and passed to Pythia 8.186 [49]
for parton showering and fragmentation. The A14 [55] set of optimised parameters for the underlying
event (UE) description using the NNPDF2.3 LO PDF set, referred to as the “A14 UE tune”, was used. The samples were generated assuming singlet couplings and for heavy-quark masses between 350 GeV and 1.5 TeV in steps of 50 GeV. Additional samples were produced at three mass points (700 GeV, 950 GeV and 1.2 TeV) assuming doublet couplings in order to confirm that, at fixed branching fraction, kinematic differences arising from the different chirality of singlet and doublet couplings have negligible impact on this search. The vector-like quarks were forced to decay with a branching ratio of 1/3 into each of the three modes (W, Z, H). These samples were reweighted using generator-level information to allow results to be interpreted for arbitrary sets of branching ratios that are consistent with the three decay modes summing to unity. The generated samples were normalised to the theoretical cross sections
computed using Top++ v2.0 [56] at next-to-next-to-leading order (NNLO) in quantum chromodynamics
(QCD), including resummation of next-to-next-to-leading logarithmic (NNLL) soft gluon terms [57–61],
and using the MSTW 2008 NNLO [62,63] set of PDFs. The predicted pair-production cross section at
√
s= 13 TeV ranges from 24 pb for a vector-like quark mass of 350 GeV to 2.0 fb for a mass of 1.5 TeV,
with an uncertainty that increases from 8% to 18% over this mass range. The theoretical uncertainties result from variations of the factorisation and renormalisation scales, as well as from uncertainties in the
PDF and αS. The latter two represent the largest contribution to the overall theoretical uncertainty in the
cross section and were calculated using the PDF4LHC prescription [64] with the MSTW 2008 68% CL
NNLO, CT10 NNLO [65,66] and NNPDF2.3 5f FFN [54] PDF sets.
Samples of simulated four-top-quark events produced via an EFT and within the 2UED/RPP model
were generated at LO with the Madgraph5_aMC@NLO [67] generator (referred to in the following
as MG5_aMC; the versions used are 2.2.3 and 1.5.14 for EFT and 2UED/RPP, respectively) and the NNPDF2.3 LO PDF set, interfaced to Pythia 8 (the versions used are 8.205 and 8.186 for EFT and
generator was used to decay the pair-produced excitations from tier (1,1) generated by Madgraph5. The
corresponding predicted cross section ranges from 343 fb for mKK = 1 TeV to 1.1 fb for mKK = 1.8 TeV.
5.2 Background modelling
After the event preselection, the main background is t ¯t production, often in association with jets, denoted by t ¯t+jets in the following. Small contributions arise from single-top-quark, W/Z+jets, multijet and diboson (WW, W Z, Z Z ) production, as well as from the associated production of a vector boson V (V = W, Z ) or a Higgs boson and a t ¯t pair (t ¯tV and t ¯tH). All backgrounds are estimated using samples of simulated events and initially normalised to their theoretical cross sections, with the exception of the multijet background, which is estimated using data-driven methods. The background prediction is further improved during the statistical analysis by performing a likelihood fit to data using multiple signal-depleted search regions, as
discussed in Section6.
The nominal sample used to model the t ¯t background was generated with the NLO generator
Powheg-Box v2 [69–72] using the CT10 PDF set [65]. The Powheg-Box model parameter hdamp, which controls
matrix element to parton shower matching and effectively regulates the high-pTradiation, was set to the
top quark mass, a setting that was found to describe the t ¯t system’s pT at
√
s = 7 TeV [73]. The nominal
t ¯t sample was interfaced to Pythia 6.428 [74] with the CTEQ6L PDF set and the Perugia 2012 (P2012)
UE tune [75]. Alternative t ¯t simulation samples used to derive systematic uncertainties are described in
Section7.3.
All t ¯t samples were generated inclusively, but events are categorised depending on the flavour content of
additional particle jets not originating from the decay of the t ¯t system (see Ref. [76] for details). Events
labelled as either t ¯t+≥1b or t ¯t+≥1c are generically referred in the following as t ¯t+HF events, where HF stands for “heavy flavour”. A finer categorisation of t ¯t+≥1b events is considered for the purpose of applying further corrections and assigning systematic uncertainties associated with the modelling of
heavy-flavour production in different topologies [76]. The remaining events are labelled as t
¯t+light-jets events, including those with no additional ¯t+light-jets. In previous studies, better agreement between data
and prediction was observed, particularly for the top quark pT distribution, when comparing to NNLO
calculations [77]. These small improvements to the modelling are incorporated by reweighting all t ¯t
samples to match their top quark pT distribution to that predicted at NNLO accuracy in QCD [78, 79].
This correction is not applied to t ¯t+≥1b events, which instead are reweighted to an NLO prediction in the
four-flavour (4F) scheme of t ¯t+≥1b including parton showering [80], based on Sherpa+OpenLoops [47,
81] (referred to as SherpaOL in the following) using the CT10 PDF set. This reweighting is performed
separately for each of the t ¯t+≥1b categories in such a way that their inter-normalisation and the shape of the relevant kinematic distributions are at NLO accuracy, while preserving the nominal t ¯t+≥1b cross section in Powheg-Box+Pythia. The corrections described in this paragraph are applied to the nominal as well as the alternative t ¯t samples.
Samples of single-top-quark events corresponding to the t-channel production mechanism were generated
with the Powheg-Box v1 [82] generator that uses the 4F scheme for the NLO matrix element calculations
and the fixed 4F CT10f4 [65] PDF set. Samples corresponding to the W t- and s-channel production
mechanisms were generated with Powheg-Box v2 using the CT10 PDF set. Overlaps between the t ¯t and
Wt final states are avoided by using the “diagram removal” scheme [83]. The parton shower, hadronisation
with the P2012 UE tune. The single-top-quark samples were normalised to the approximate NNLO
theoretical cross sections [84–86].
Samples of W /Z +jets events were generated with the Sherpa 2.2 [47] generator. The matrix element was
calculated for up to two partons at NLO and up to four partons at LO using Comix [87] and OpenLoops [81].
The matrix element calculation was merged with the Sherpa parton shower [88] using the ME+PS@NLO
prescription [89]. The PDF set used for the matrix-element calculation is NNPDF3.0NNLO [90] with
a dedicated parton shower tuning developed for Sherpa. Separate samples were generated for different W /Z+jets categories using filters for a b-jet (W/Z+ ≥1b+jets), a c-jet and no b-jet (W/Z+ ≥1c+jets), and with a veto on b- and c-jets (W /Z +light-jets), which were combined into the inclusive W /Z +jets samples. Both the W +jets and Z +jets samples were normalised to their respective inclusive NNLO theoretical cross
sections in QCD calculated with FEWZ [91].
Samples of WW /W Z /Z Z +jets events were generated with Sherpa 2.1.1 using the CT10 PDF set and include processes containing up to four electroweak vertices. The matrix element includes zero additional partons at NLO and up to three partons at LO using the same procedure as for the W /Z +jets samples. The final states simulated require one of the bosons to decay leptonically and the other hadronically. All diboson samples were normalised to their NLO theoretical cross sections provided by Sherpa.
Samples of t ¯tV and t ¯tH events were generated with MG5_aMC 2.3.2, using NLO matrix elements and the
NNPDF3.0NLO [90] PDF set. Showering was performed using Pythia 8.210 and the A14 UE tune. The
t ¯tV samples were normalised to the NLO cross section computed with MG5_aMC. The t ¯tH sample was
normalised using the NLO cross section [92–96] and the Higgs boson decay branching ratios calculated
using Hdecay [97].
The production of four-top-quark events in the SM was simulated by samples generated at LO using MG5_aMC 2.2.2 and the NNPDF2.3 LO PDF set, interfaced to Pythia 8.186 in combination with the
A14 UE tune. The sample was normalised to a cross section of 9.2 fb, computed at NLO [67].
The background from multijet production (“multijet background” in the following) in the 1-lepton channel contributes to the selected data sample via several production and misreconstruction mechanisms. In the electron channel, it consists of non-prompt electrons (from semileptonic b- or c-hadron decays) as
well as misidentified photons (e.g. from a conversion of a photon into an e+e− pair) or jets with a high
fraction of their energy deposited in the EM calorimeter. In the muon channel, the multijet background is predominantly from non-prompt muons. The multijet background normalisation and shape are estimated
directly from data by using the “matrix method” technique [98], which exploits differences in lepton
identification and isolation properties between prompt leptons and leptons that are either non-prompt or
result from the misidentification of photons or jets. Further details can be found in Ref. [25]. The main
type of multijet background that contributes to the 0-lepton channel are events in which the energy of a
high-pTjet is mismeasured, consequently leading to a large missing transverse momentum in the final state.
Most of this background is suppressed by selecting events satisfying ∆φ4jmin> 0.4. The remaining multijet
background in each search region is estimated from a control region defined with the same selection as the
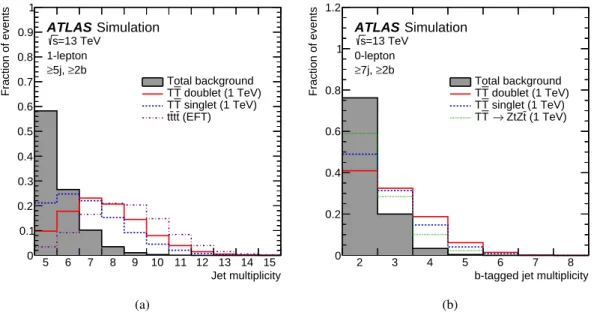
Jet multiplicity 5 6 7 8 9 10 11 12 13 14 15 Fraction of events 0 0.1 0.2 0.3 0.4 0.5 0.6 0.7 0.8 0.9 1 2b ≥ 5j, ≥ 1-lepton =13 TeVs Simulation ATLAS Total background doublet (1 TeV) T T singlet (1 TeV) T T (EFT) t t t t (a)
b-tagged jet multiplicity
2 3 4 5 6 7 8 Fraction of events 0 0.2 0.4 0.6 0.8 1 1.2 2b ≥ 7j, ≥ 0-lepton =13 TeVs Simulation ATLAS Total background doublet (1 TeV) T T singlet (1 TeV) T T (1 TeV) t ZtZ → T T (b)
Figure 2: Comparison of the distribution of (a) the jet multiplicity, and (b) the b-tagged jet multiplicity, between the total background (shaded histogram) and several signal scenarios considered in this search. The selection used in (a) corresponds to events in the 1-lepton channel satisfying the preselection requirements, whereas the selection used in (b) corresponds to events in the 0-lepton channel satisfying the preselection requirements and ≥7 jets. The signals shown correspond to: T ¯T production in the weak-isospin doublet and singlet scenarios, and in the B(T → Zt) = 1 case, assuming mT = 1 TeV; and t¯tt¯t production within an EFT model.
6 Search strategy
The searches discussed in this paper primarily target T ¯T production where at least one of the T quarks
decays into a Higgs boson and a top quark resulting in the following processes: T ¯T → HtHt, Ht Zt
and HtW b.5 For the dominant H → b ¯b decay mode, the final-state signatures in both the 1-lepton and
0-lepton searches are characterised by high jet and b-tagged jet multiplicities, which provide a powerful experimental handle to suppress the background. The presence of high-momentum Z bosons decaying
into ν ¯ν or W bosons decaying leptonically, either to an electron or muon that is not reconstructed or
to a hadronically decaying τ-lepton that is identified as a jet, yields high ETmiss, which is exploited by
the 0-lepton search. Both searches have some sensitivity to T ¯T → Zt Zt and ZtW b, with Z → b ¯b.
Possible contributions from pair production of the B or X quarks that would be included, along with the T quark, in a weak-isospin doublet are ignored. Such particles are expected to decay primarily through
X, B → Wt [8], and thus not lead to high b-tagged jet multiplicity, which is the primary focus of these
searches. High jet and b-tagged jet multiplicities are also characteristic of t ¯tt ¯t events (both within the SM and in BSM scenarios); this search is sensitive to these events. The four-top-quark production scenarios
considered here do not feature large ETmiss, so only the 1-lepton search is used to probe them. No dedicated
re-optimisation for t ¯tt ¯t events was performed.
In Figure 2(a) the jet multiplicity distribution in the 1-lepton channel after preselection (described in
Section4) is compared between the total background and several signal scenarios, chosen to illustrate
5In the following, Ht Zt is used to denote both Ht Z ¯t and its charge conjugate, H ¯tZt. Similar notation is used for other processes,
Higgs-tagged jet multiplicity 0 1 2 3 4 5 Fraction of events 0 0.2 0.4 0.6 0.8 1 1.2 1.4 2b ≥ 6j, ≥ 1-lepton =13 TeVs Simulation ATLAS Total background doublet (1 TeV) T T singlet (1 TeV) T T (EFT) t t t t (a)
Top-tagged jet multiplicity
0 1 2 3 4 5 Fraction of events 0 0.2 0.4 0.6 0.8 1 1.2 2b ≥ 7j, ≥ 0-lepton =13 TeVs Simulation ATLAS Total background doublet (1 TeV) T T singlet (1 TeV) T T (1 TeV) t ZtZ → T T (b)
Figure 3: Comparison of the distribution of (a) the Higgs-tagged jet multiplicity and (b) the top-tagged jet multiplicity, between the total background (shaded histogram) and several signal scenarios considered in this search. The selection used in (a) corresponds to events in the 1-lepton channel satisfying the preselection requirements and ≥6 jets, whereas the selection used in (b) corresponds to events in the 0-lepton channel satisfying the preselection requirements and ≥7 jets. The signals shown correspond to: T ¯T production in the weak-isospin doublet and singlet scenarios, and in the B(T → Zt) = 1 case, assuming mT = 1 TeV; and t¯tt¯t production within an EFT model.
differences among various types of signals the search is sensitive to. A similar comparison for the b-tagged
jet multiplicity distribution is shown in Figure2(b) for events in the 0-lepton channel after preselection
plus the requirement of ≥7 jets.
Compared to Run 1, the larger centre-of-mass energy in Run 2 provides sensitivity to higher-mass signals, which decay into boosted heavy SM particles (particularly Higgs bosons and top quarks). These potentially
give rise to a high multiplicity of large-R jets that capture their decay products (see Section3). While
t ¯t+jets events in the 1-lepton and 0-lepton channels are expected to typically contain one top-tagged jet, the signal events of interest are characterised by higher Higgs-tagged jet and top-tagged jet multiplicities,
as illustrated in Figures3(a) and 3(b). The small fraction (about 5%) of background events with ≥2
top-tagged jets or ≥1 Higgs-tagged jets results from the misidentification of at least one large-R jet where initial- or final-state radiation was responsible for a large fraction of the constituents.
In order to optimise the sensitivity of the searches, the selected events are categorised into different regions depending on the jet multiplicity (5 and ≥6 jets in the 1-lepton channel; 6 and ≥7 jets in the 0-lepton channel), b-tagged jet multiplicity (3 and ≥4 in the 1-lepton channel; 2, 3 and ≥4 in the 0-lepton channel)
[GeV]
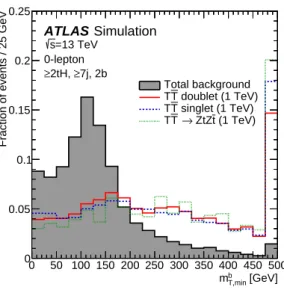
b T,min
m
0 50 100 150 200 250 300 350 400 450 500
Fraction of events / 25 GeV
0 0.05 0.1 0.15 0.2 0.25 7j, 2b ≥ 2tH, ≥ 0-lepton =13 TeVs Simulation ATLAS Total background doublet (1 TeV) T T singlet (1 TeV) T T (1 TeV) t ZtZ → T T
Figure 4: Comparison of the distribution of the minimum transverse mass of ETmiss and any of the three (or two, in events with exactly two b-tagged jets) leading b-tagged jets in the event (mT, minb ), between the total background (shaded histogram) and several signal scenarios considered in this search. The selection used corresponds to events in the (≥2tH, ≥7j, 2b) region of the 0-lepton channel. The signals shown correspond to T ¯T production in the weak-isospin doublet and singlet scenarios, and in the B(T → Zt) = 1 case, assuming mT = 1 TeV. The last bin in
the figure contains the overflow.
variable is bounded from above by the top quark mass for semileptonic t ¯t background events, while the
signal can have higher values of mbT, mindue to the presence of high-pT neutrinos from T → Zt, Z → νν
or T → W b, W → `ν decays. Although the requirements of a minimum top/Higgs-tagged jet multiplicity
reduces the value of mbT, minbecause of the resulting stronger collimation of the top quark decay products,
this variable still provides useful discrimination between signal and t ¯t background, as shown in Figure4.
While the 1-lepton channel only considers regions with exactly 3 or ≥4 b-tagged jets, the 0-lepton channel
also includes regions with exactly two b-jets and mbT, min > 160 GeV, to gain sensitivity to T ¯T → ZtZt
decays with at least one Z → ν ¯ν decay.
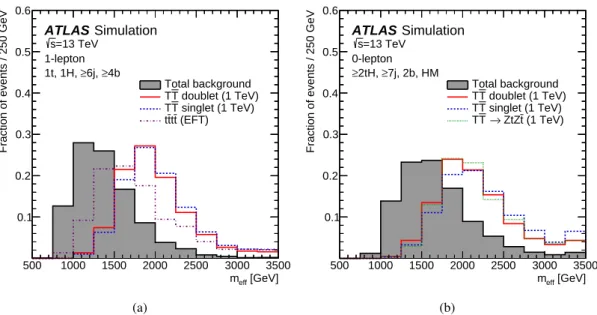
To further improve the separation between the T ¯T signal and background, the distinct kinematic features
of the signal are exploited. In particular, the large T quark mass results in leptons and jets with large
energy in the final state and the effective mass (meff), defined as the scalar sum of the transverse momenta
of the lepton, the selected jets and the missing transverse momentum, provides a powerful discriminating
variable between signal and background. The meff distribution peaks at approximately 2mT for signal
events and at lower values for the t ¯t+jets background. For the same reasons, the various t ¯tt ¯t signals from
BSM scenarios also populate high values of meff. An additional selection requirement of meff > 1 TeV
is made in order to minimise the effect of possible mismodelling of the meff distribution at low values
originating from small backgrounds with large systematic uncertainties, such as multijet production. Such
a requirement is applied for regions with Nt+ NH ≤ 1 in the 1-lepton channel, and for all regions in the
0-lepton channel. Since the T ¯T signal is characterised by having at least one top/Higgs-tagged jet and
large values of meff, this minimum requirement on meffdoes not decrease the signal efficiency. In Figure5,
the meff distribution is compared between signal and background for events in signal-rich regions of the
1-lepton and 0-lepton channels. The kinematic requirements in these regions result in a significantly
harder meff spectrum for the background than in regions without top/Higgs-tagged jets, but this variable
[GeV]
eff
m
500 1000 1500 2000 2500 3000 3500
Fraction of events / 250 GeV
0.1 0.2 0.3 0.4 0.5 0.6 4b ≥ 6j, ≥ 1t, 1H, 1-lepton =13 TeVs Simulation ATLAS Total background doublet (1 TeV) T T singlet (1 TeV) T T (EFT) t t t t (a) [GeV] eff m 500 1000 1500 2000 2500 3000 3500
Fraction of events / 250 GeV
0.1 0.2 0.3 0.4 0.5 0.6 7j, 2b, HM ≥ 2tH, ≥ 0-lepton =13 TeVs Simulation ATLAS Total background doublet (1 TeV) T T singlet (1 TeV) T T (1 TeV) t ZtZ → T T (b)
Figure 5: Comparison of the distribution of the effective mass (meff), between the total background (shaded histogram)
and several signal scenarios considered in this search. The selection used in (a) corresponds to events in the (1t, 1H, ≥6j, ≥4b) region of the 1-lepton channel, whereas the selection used in (b) corresponds to events in the (≥2tH, ≥7j, 2b, HM) region of the 0-lepton channel. The signals shown correspond to: T ¯T production in the weak-isospin doublet and singlet scenarios, and in the B(T → Zt) = 1 case, assuming mT = 1 TeV; and t¯tt¯t production within an
EFT model. The last bin in each distribution contains the overflow.
final discriminating variable in all regions considered in this search.
The regions with ≥6 jets (≥7 jets) are used to perform the search in the 1-lepton (0-lepton) channel (referred to as “search regions”), whereas the regions with exactly 5 jets (6 jets) are used to validate the background modelling in different regimes of event kinematics and heavy-flavour content (referred to as “validation regions”). A total of 12 search regions and 10 validation regions are considered in the 1-lepton channel, whereas 22 search regions and 16 validation regions are considered in the 0-lepton channel,
defined in Tables 2and3 respectively. In each channel, there are fewer validation regions than signal
regions since some validation regions are merged to ensure a minimum of about 10 expected events. The level of possible signal contamination in the validation regions that have high event yields, and are therefore the regions that are most useful to validate the background prediction, depends on the signal scenario considered but is typically well below 10% for a 1 TeV T quark.
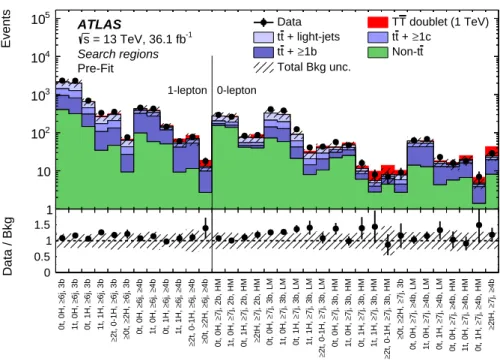
The overall rate and composition of the t ¯t+jets background strongly depends on the jet and b-tagged jet
multiplicities, as illustrated in Figure6. The t ¯t+light-jets background is dominant in events with exactly
two b-tagged jets, which typically correspond to the two b-quarks from the top quark decays. It also contributes significantly to events with exactly three b-tagged jets, in which typically a charm quark from
6j, 3b ≥ 0t, 0H, 6j, 3b ≥ 1t, 0H, 6j, 3b ≥ 0t, 1H, 6j, 3b ≥ 1t, 1H, 6j, 3b ≥ 2t, 0-1H, ≥ 6j, 3b ≥ 2H, ≥ 0t, ≥ 4b ≥ 6j, ≥ 0t, 0H, 4b ≥ 6j, ≥ 1t, 0H, 4b ≥ 6j, ≥ 0t, 1H, 4b ≥ 6j, ≥ 1t, 1H, 4b ≥ 6j, ≥ 2t, 0-1H, ≥ 4b ≥ 6j, ≥ 2H, ≥ 0t, ≥ 7j, 2b, HM ≥ 0t, 0H, 7j, 2b, HM ≥ 1t, 0H, 7j, 2b, HM ≥ 0t, 1H, 7j, 2b, HM ≥ 2tH, ≥ 7j, 3b, LM ≥ 0t, 0H, 7j, 3b, LM ≥ 1t, 0H, 7j, 3b, LM ≥ 0t, 1H, 7j, 3b, LM ≥ 1t, 1H, 7j, 3b, LM ≥ 2t, 0-1H, ≥ 7j, 3b, HM ≥ 0t, 0H, 7j, 3b, HM ≥ 1t, 0H, 7j, 3b, HM ≥ 0t, 1H, 7j, 3b, HM ≥ 1t, 1H, 7j, 3b, HM ≥ 2t, 0-1H, ≥ 7j, 3b ≥ 2H, ≥ 0t, ≥ 4b, LM ≥ 7j, ≥ 0t, 0H, 4b, LM ≥ 7j, ≥ 1t, 0H, 4b, LM ≥ 7j, ≥ 0t, 1H, 4b, HM ≥ 7j, ≥ 0t, 0H, 4b, HM ≥ 7j, ≥ 1t, 0H, 4b, HM ≥ 7j, ≥ 0t, 1H, 4b ≥ 7j, ≥ 2tH, ≥ Data / Bkg 0 0.5 1 1.5 2 Events 1 10 2 10 3 10 4 10 5 10 ATLAS -1 = 13 TeV, 36.1 fb s Search regions Pre-Fit
Data TT doublet (1 TeV)
+ light-jets t t tt + ≥1c 1b ≥ + t t Non-tt Total Bkg unc. 1-lepton 0-lepton
Figure 6: Comparison between the data and the background prediction for the yields in the search regions considered in the 1-lepton and 0-lepton channels, before the fit to data (“Pre-fit”). The small contributions from t ¯tV , t ¯tH, single-top, W /Z +jets, diboson, and multijet backgrounds are combined into a single background source referred to as “Non-t ¯t ”. The expected T ¯T signal (solid red) corresponding to mT = 1 TeV in the T doublet scenario is
also shown, added on top of the background prediction. The bottom panel displays the ratio of data to the SM background (“Bkg”) prediction. The hashed area represents the total uncertainty of the background, excluding the normalisation uncertainty of the t ¯t+ ≥ 1b background, which is determined via a likelihood fit to data.
signal-to-background ratio, and therefore drive the sensitivity of the search. The remaining search regions have significantly lower signal-to-background ratios, but are useful for checking and correcting the t ¯t+jets
background prediction and constraining the related systematic uncertainties (see Section 7) through a
likelihood fit to data (see Section8). A summary of the signal-to-background ratio in the different search
regions is displayed in Figure7for the T quark signal with various decay configurations. A similar fitting
strategy was followed in the Run-1 search in the 1-lepton channel [25].
A summary of the observed and expected yields before the fit to data in five of the most sensitive search
regions in the 1-lepton and 0-lepton channels can be found in Tables4and5, respectively. The search
regions shown in Table4for the 1-lepton channel are a selection of some of the regions with the highest
S/√B ratio (where S and B are the expected signal and background yields, respectively) across several
signal benchmark scenarios considered (T ¯T in the B(T → Ht) = 1, T doublet, and T singlet scenarios,
in all cases assuming mT = 1 TeV, and t¯tt¯t within an EFT and the 2UED/RPP models). Similarly, the
search regions shown in Table5 for the 0-lepton channel are a superset of the regions with the highest
S/√B ratio for different T ¯T signal benchmark scenarios (T doublet, T singlet and B(T → Zt) = 1, also
1-lepton channel Search regions (≥6 jets)
Nt NH b-tag multiplicity meff Channel name
0 0 3 >1 TeV 0t, 0H, ≥6j, 3b 0 0 ≥4 >1 TeV 0t, 0H, ≥6j, ≥4b 1 0 3 >1 TeV 1t, 0H, ≥6j, 3b 1 0 ≥4 >1 TeV 1t, 0H, ≥6j, ≥4b 0 1 3 >1 TeV 0t, 1H, ≥6j, 3b 0 1 ≥4 >1 TeV 0t, 1H, ≥6j, ≥4b 1 1 3 – 1t, 1H, ≥6j, 3b 1 1 ≥4 – 1t, 1H, ≥6j, ≥4b ≥2 0 or 1 3 – ≥2t, 0–1H, ≥6j, 3b ≥2 0 or 1 ≥4 – ≥2t, 0–1H, ≥6j, ≥4b ≥0 ≥2 3 – ≥0t, ≥2H, ≥6j, 3b ≥0 ≥2 ≥4 – ≥0t, ≥2H, ≥6j, ≥4b
Validation regions (5 jets)
Nt NH b-tag multiplicity meff Channel name
0 0 3 >1 TeV 0t, 0H, 5j, 3b 0 0 ≥4 >1 TeV 0t, 0H, 5j, ≥4b 1 0 3 >1 TeV 1t, 0H, 5j, 3b 1 0 ≥4 >1 TeV 1t, 0H, 5j, ≥4b 0 1 3 >1 TeV 0t, 1H, 5j, 3b 0 1 ≥4 >1 TeV 0t, 1H, 5j, ≥4b 1 1 3 – 1t, 1H, 5j, 3b ≥2 0 or 1 3 – ≥2t, 0–1H, 5j, 3b ≥0 ≥2 3 – ≥0t, ≥2H, 5j, 3b Nt+ NH≥ 2 ≥4 – ≥2tH, 5j, ≥4b
0-lepton channel Search regions (≥7 jets)
Nt NH b-tag multiplicity mb
T, min meff Channel name
0 0 2 >160 GeV >1 TeV 0t, 0H, ≥7j, 2b, HM 0 0 3 <160 GeV >1 TeV 0t, 0H, ≥7j, 3b, LM 0 0 3 >160 GeV >1 TeV 0t, 0H, ≥7j, 3b, HM 0 0 ≥4 <160 GeV >1 TeV 0t, 0H, ≥7j, ≥4b, LM 0 0 ≥4 >160 GeV >1 TeV 0t, 0H, ≥7j, ≥4b, HM 1 0 2 >160 GeV >1 TeV 1t, 0H, ≥7j, 2b, HM 1 0 3 <160 GeV >1 TeV 1t, 0H, ≥7j, 3b, LM 1 0 3 >160 GeV >1 TeV 1t, 0H, ≥7j, 3b, HM 1 0 ≥4 <160 GeV >1 TeV 1t, 0H, ≥7j, ≥4b, LM 1 0 ≥4 >160 GeV >1 TeV 1t, 0H, ≥7j, ≥4b, HM 0 1 2 >160 GeV >1 TeV 0t, 1H, ≥7j, 2b, HM 0 1 3 <160 GeV >1 TeV 0t, 1H, ≥7j, 3b, LM 0 1 3 >160 GeV >1 TeV 0t, 1H, ≥7j, 3b, HM 0 1 ≥4 <160 GeV >1 TeV 0t, 1H, ≥7j, ≥4b, LM 0 1 ≥4 >160 GeV >1 TeV 0t, 1H, ≥7j, ≥4b, HM 1 1 3 <160 GeV >1 TeV 1t, 1H, ≥7j, 3b, LM 1 1 3 >160 GeV >1 TeV 1t, 1H, ≥7j, 3b, HM ≥2 0 or 1 3 <160 GeV >1 TeV ≥2t, 0–1H, ≥7j, 3b, LM ≥2 0 or 1 3 >160 GeV >1 TeV ≥2t, 0–1H, ≥7j, 3b, HM ≥0 ≥2 3 – >1 TeV ≥0t, ≥2H, ≥7j, 3b Nt+ NH≥ 2 2 >160 GeV >1 TeV ≥2tH, ≥7j, 2b, HM Nt+ NH≥ 2 ≥4 – >1 TeV ≥2tH, ≥7j, ≥4b
Validation regions (6 jets)
Nt NH b-tag multiplicity mb
T, min meff Channel name
0 0 2 >160 GeV >1 TeV 0t, 0H, 6j, 2b, HM 0 0 3 <160 GeV >1 TeV 0t, 0H, 6j, 3b, LM 0 0 3 >160 GeV >1 TeV 0t, 0H, 6j, 3b, HM 0 0 ≥4 <160 GeV >1 TeV 0t, 0H, 6j, ≥4b, LM 0 0 ≥4 >160 GeV >1 TeV 0t, 0H, 6j, ≥4b, HM 1 0 2 >160 GeV >1 TeV 1t, 0H, 6j, 2b, HM 1 0 3 <160 GeV >1 TeV 1t, 0H, 6j, 3b, LM 1 0 3 >160 GeV >1 TeV 1t, 0H, 6j, 3b, HM 1 0 ≥4 – >1 TeV 1t, 0H, 6j, ≥4b 0 1 2 >160 GeV >1 TeV 0t, 1H, 6j, 2b, HM 0 1 3 <160 GeV >1 TeV 0t, 1H, 6j, 3b, LM 0 1 3 >160 GeV >1 TeV 0t, 1H, 6j, 3b, HM 0 1 ≥4 – >1 TeV 0t, 1H, 6j, ≥4b Nt+ NH≥ 2 2 >160 GeV >1 TeV ≥2tH, 6j, 2b, HM Nt+ NH≥ 2 3 – >1 TeV ≥2tH, 6j, 3b Nt+ NH≥ 2 ≥4 – >1 TeV ≥2tH, 6j, ≥4b
B S/ 0 1 2 3 4 5 doublet (1 TeV) T T (1 TeV) t ZtZ → T T -1 = 13 TeV, 36.1 fb s Simulation ATLAS 1-lepton 0-lepton 6j, 3b ≥ 0t, 0H, 6j, 3b ≥ 1t, 0H, 6j, 3b ≥ 0t, 1H, 6j, 3b ≥ 1t, 1H, 6j, 3b ≥ 2t, 0-1H, ≥ 6j, 3b ≥ 2H, ≥ 0t, ≥ 4b ≥ 6j, ≥ 0t, 0H, 4b ≥ 6j, ≥ 1t, 0H, 4b ≥ 6j, ≥ 0t, 1H, 4b ≥ 6j, ≥ 1t, 1H, 4b ≥ 6j, ≥ 2t, 0-1H, ≥ 4b ≥ 6j, ≥ 2H, ≥ 0t, ≥ 7j, 2b,HM ≥ 0t, 0H, 7j, 2b,HM ≥ 1t, 0H, 7j, 2b,HM ≥ 0t, 1H, 7j, 2b,HM ≥ 2tH, ≥ 7j, 3b,LM ≥ 0t, 0H, 7j, 3b,LM ≥ 1t, 0H, 7j, 3b,LM ≥ 0t, 1H, 7j, 3b,LM ≥ 1t, 1H, 7j, 3b,LM ≥ 2t, 0-1H, ≥ 7j, 3b,HM ≥ 0t, 0H, 7j, 3b,HM ≥ 1t, 0H, 7j, 3b,HM ≥ 0t, 1H, 7j, 3b,HM ≥ 1t, 1H, 7j, 3b,HM ≥ 2t, 0-1H, ≥ 7j, 3b ≥ 2H, ≥ 0t, ≥ 4b,LM ≥ 7j, ≥ 0t, 0H, 4b,LM ≥ 7j, ≥ 1t, 0H, 4b,LM ≥ 7j, ≥ 0t, 1H, 4b,HM ≥ 7j, ≥ 0t, 0H, 4b,HM ≥ 7j, ≥ 1t, 0H, 4b,HM ≥ 7j, ≥ 0t, 1H, 4b ≥ 7j, ≥ 2tH, ≥ S/B 4 − 10 3 − 10 2 − 10 1 − 10 1 10 2 10 0
Figure 7: Signal-to-background ratio expressed as S/ √
B (resp. S/B) in the top (resp. bottom) panel for each of the search regions. B and S stand for the total numbers of expected background and signal events in each region, respectively. For a 1 TeV T quark mass hypothesis, two branching ratio configurations are displayed: the doublet model (red filled area) and B(T → Zt) = 1 (blue filled area).
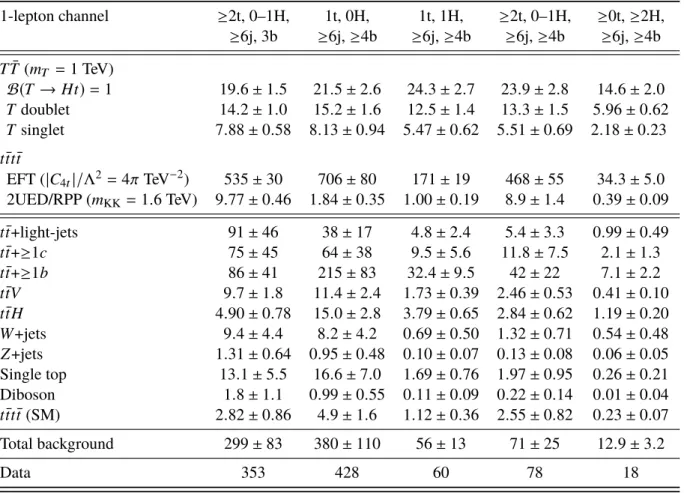
1-lepton channel ≥2t, 0–1H, 1t, 0H, 1t, 1H, ≥2t, 0–1H, ≥0t, ≥2H, ≥6j, 3b ≥6j, ≥4b ≥6j, ≥4b ≥6j, ≥4b ≥6j, ≥4b T ¯T (mT = 1 TeV) B(T → Ht)= 1 19.6 ± 1.5 21.5 ± 2.6 24.3 ± 2.7 23.9 ± 2.8 14.6 ± 2.0 T doublet 14.2 ± 1.0 15.2 ± 1.6 12.5 ± 1.4 13.3 ± 1.5 5.96 ± 0.62 T singlet 7.88 ± 0.58 8.13 ± 0.94 5.47 ± 0.62 5.51 ± 0.69 2.18 ± 0.23 t ¯tt ¯t EFT (|C4t|/Λ2 = 4π TeV−2) 535 ± 30 706 ± 80 171 ± 19 468 ± 55 34.3 ± 5.0 2UED/RPP (mKK = 1.6 TeV) 9.77 ± 0.46 1.84 ± 0.35 1.00 ± 0.19 8.9 ± 1.4 0.39 ± 0.09 t ¯t+light-jets 91 ± 46 38 ± 17 4.8 ± 2.4 5.4 ± 3.3 0.99 ± 0.49 t ¯t+≥1c 75 ± 45 64 ± 38 9.5 ± 5.6 11.8 ± 7.5 2.1 ± 1.3 t ¯t+≥1b 86 ± 41 215 ± 83 32.4 ± 9.5 42 ± 22 7.1 ± 2.2 t ¯tV 9.7 ± 1.8 11.4 ± 2.4 1.73 ± 0.39 2.46 ± 0.53 0.41 ± 0.10 t ¯tH 4.90 ± 0.78 15.0 ± 2.8 3.79 ± 0.65 2.84 ± 0.62 1.19 ± 0.20 W +jets 9.4 ± 4.4 8.2 ± 4.2 0.69 ± 0.50 1.32 ± 0.71 0.54 ± 0.48 Z+jets 1.31 ± 0.64 0.95 ± 0.48 0.10 ± 0.07 0.13 ± 0.08 0.06 ± 0.05 Single top 13.1 ± 5.5 16.6 ± 7.0 1.69 ± 0.76 1.97 ± 0.95 0.26 ± 0.21 Diboson 1.8 ± 1.1 0.99 ± 0.55 0.11 ± 0.09 0.22 ± 0.14 0.01 ± 0.04 t ¯tt ¯t (SM) 2.82 ± 0.86 4.9 ± 1.6 1.12 ± 0.36 2.55 ± 0.82 0.23 ± 0.07 Total background 299 ± 83 380 ± 110 56 ± 13 71 ± 25 12.9 ± 3.2 Data 353 428 60 78 18
Table 4: Predicted and observed yields in the 1-lepton channel in five of the most sensitive search regions (depending on the signal scenario) considered. The multijet background is estimated to be negligible in these regions and thus not shown. The background prediction is shown before the fit to data. Also shown are the signal predictions for different benchmark scenarios considered. The quoted uncertainties are the sum in quadrature of statistical and systematic uncertainties in the yields, excluding the normalisation uncertainty of the t ¯t+ ≥ 1b background, which is determined via a likelihood fit to data.
0-lepton channel ≥2tH, 1t, 1H, ≥2t, 0–1H, 1t, 0H, ≥2tH, ≥7j, 2b, HM ≥7j, 3b, HM ≥7j, 3b, HM ≥7j, ≥4b, HM ≥7j, ≥4b T ¯T (mT = 1 TeV) B(T → Zt)= 1 22.3 ± 2.3 2.60 ± 0.57 6.02 ± 0.61 4.72 ± 0.66 6.94 ± 0.98 T doublet 16.0 ± 1.1 4.22 ± 0.34 5.92 ± 0.49 5.32 ± 0.61 18.7 ± 2.0 T singlet 8.52 ± 0.61 1.81 ± 0.16 2.63 ± 0.22 2.32 ± 0.29 6.91 ± 0.80 t ¯t+light-jets 17.8 ± 9.8 0.72 ± 0.40 0.80 ± 0.53 1.30 ± 0.72 1.71 ± 0.98 t ¯t+≥1c 9.7 ± 6.4 0.92 ± 0.65 0.95 ± 0.71 2.4 ± 1.6 3.2 ± 2.0 t ¯t+≥1b 6.3 ± 4.2 1.17 ± 0.59 1.78 ± 0.74 9.4 ± 3.2 11.4 ± 4.1 t ¯tV 5.5 ± 1.0 0.49 ± 0.12 0.88 ± 0.19 1.19 ± 0.27 1.01 ± 0.24 t ¯tH 0.61 ± 0.12 0.17 ± 0.05 0.13 ± 0.04 0.85 ± 0.17 1.08 ± 0.25 W +jets 9.6 ± 4.1 0.52 ± 0.27 0.80 ± 0.37 0.81 ± 0.40 0.56 ± 0.28 Z+jets 8.6 ± 4.5 0.59 ± 0.28 0.8 ± 2.1 0.80 ± 0.40 0.63 ± 0.42 Single top 8.3 ± 4.4 0.69 ± 0.43 0.97 ± 0.59 1.8 ± 1.0 1.10 ± 0.61 Diboson 2.9 ± 1.9 0.11 ± 0.20 0.55 ± 0.66 0.24 ± 0.25 0.14 ± 0.15 t ¯tt ¯t (SM) 0.22 ± 0.07 0.06 ± 0.02 0.12 ± 0.04 0.31 ± 0.10 0.77 ± 0.25 Multijet 3.9 ± 3.9 0.13 ± 0.17 0.20 ± 0.24 0.64 ± 0.68 2.8 ± 2.8 Total background 73 ± 19 5.6 ± 1.4 8.0 ± 3.7 19.7 ± 5.0 24.4 ± 6.3 Data 87 8 7 18 29
Table 5: Predicted and observed yields in the 0-lepton channel in five of the most sensitive search regions (depending on the signal scenario) considered. The background prediction is shown before the fit to data. Also shown are the signal predictions for different benchmark scenarios considered. The quoted uncertainties are the sum in quadrature of statistical and systematic uncertainties in the yields, excluding the normalisation uncertainty of the t ¯t+ ≥ 1b background, which is determined via a likelihood fit to data.
7 Systematic uncertainties
Several sources of systematic uncertainty are considered that affect the normalisation of signal and
background and/or the shape of their meffdistributions. Each source of systematic uncertainty is considered
to be uncorrelated with the other sources. Correlations for a given systematic uncertainty are maintained across processes and channels, unless explicitly stated otherwise.
The leading sources of systematic uncertainty vary depending on the analysis region considered. For example, the total systematic uncertainty of the background normalisation in the highest-sensitivity search region in the 1-lepton channel (≥0t, ≥2H, ≥6j, ≥4b) is 25%, with the largest contributions originating from uncertainties in t ¯t+HF modelling and flavour tagging efficiencies (b, c, and light). The above uncertainty does not include the uncertainty in the t ¯t+ ≥ 1b normalisation, which is allowed to vary freely in the fit to data. However, as discussed previously, the joint fit to data across the 34 search regions considered in total in the 1-lepton and 0-lepton channels allows the overall background uncertainty to be reduced significantly, e.g., in the case of the search region specified above, down to 10% (including the uncertainty in the t ¯t+ ≥ 1b normalisation). Such a reduction results from the significant constraints that the data places on some systematic uncertainties, as well as the correlations among systematic uncertainties built into the likelihood model.
The following sections describe the systematic uncertainties considered in this analysis.
7.1 Luminosity
The uncertainty in the integrated luminosity is 2.1%, affecting the overall normalisation of all processes
estimated from the simulation. It is derived, following a methodology similar to that detailed in Ref. [99],
from a calibration of the luminosity scale using x–y beam-separation scans performed in August 2015 and May 2016.
7.2 Reconstructed objects
Uncertainties associated with leptons arise from the trigger, reconstruction, identification, and isolation efficiencies, as well as the lepton momentum scale and resolution. These are measured in data using
Z → `+`−and J/ψ → `+`−events [31,33]. The combined effect of all these uncertainties results in an
overall normalisation uncertainty in signal and background of approximately 1%.
Uncertainties associated with jets arise from the jet energy scale and resolution, and the efficiency to pass the JVT requirement. The largest contribution results from the jet energy scale, whose uncertainty
dependence on jet pT and η, jet flavour, and pile-up treatment is split into 21 uncorrelated components
that are treated independently in the analysis [38].
The leading uncertainties associated with reconstructed objects in this analysis originate from the mod-elling of the b-, c-, and light-jet-tagging efficiencies in the simulation, which is corrected to match the
efficiencies measured in data control samples [41]. Uncertainties in these corrections include a total
of six independent sources affecting b-jets and four independent sources affecting c-jets. Each of these
uncertainties has a different dependence on jet pT. Seventeen sources of uncertainty affecting light jets
are considered, which depend on jet pT and η. The sources of systematic uncertainty listed above are
the extrapolation of these corrections to jets with pT beyond the kinematic reach of the data calibration
samples used (pT > 300 GeV for b- and c-jets, and pT > 750 GeV for light-jets); it is taken to be correlated
among the three jet flavours. This uncertainty is evaluated in the simulation by comparing the tagging efficiencies while varying e.g. the fraction of tracks with shared hits in the silicon detectors or the fraction
of fake tracks resulting from random combinations of hits, both of which typically increase at high pT
due to growing track multiplicity and density of hits within the jet. Finally, an uncertainty related to the application of c-jet scale factors to τ-jets is considered, but has a negligible impact in this analysis. The combined effect of these uncertainties results in an uncertainty in the t ¯t background normalisation ranging from 4% to 12% depending on the analysis region. The corresponding uncertainty range for signal is
2–12%, assuming T ¯T production in the weak-isospin doublet scenario and mT = 1 TeV.
7.3 Background modelling
A number of sources of systematic uncertainty affecting the modelling of t ¯t+jets are considered. An
uncertainty of 6% is assigned to the inclusive t ¯t production cross section [56], including contributions
from varying the factorisation and renormalisation scales, and from uncertainties in the PDF, αS, and the
top quark mass, all added in quadrature. Since several search regions have a sufficiently large number of events of t ¯t+≥1b background, its normalisation is completely determined by the data during the fit procedure. In the case of the t ¯t+≥1c normalisation, since the fit to the data is unable to precisely determine it and the analysis has very limited sensitivity to its uncertainty, a normalisation uncertainty of 50% is assumed.
Alternative t ¯t samples were generated using Powheg-Box interfaced to Herwig++ 2.7.1 [100] and
MG5_aMC 2.2.1 interfaced to Herwig++2.7.1 in order to estimate systematic uncertainties related to
the modelling of this background. The effects of initial- and final-state radiation (ISR/FSR) are explored
using two alternative Powheg-Box+Pythia samples, one with hdampset to 2mt, the renormalisation and
factorisation scales set to half the nominal value and using the P2012 radHi UE tune, giving more radiation
(referred to as “radHi”), and one with the P2012 radLo UE tune, hdamp= mt and the renormalisation and
factorisation scales set to twice the nominal value, giving less radiation (referred to as “radLow”) [101].
Uncertainties affecting the modelling of t ¯t+≥1b production include shape uncertainties (including inter-category migration effects) associated with the NLO prediction from SherpaOL, which is used for reweighting the nominal Powheg-Box+Pythia 6 t ¯t+≥1b prediction. These uncertainties include different
scale variations, a different shower-recoil model scheme, and two alternative PDF sets (see Ref. [102] for
details), and are significantly smaller than those estimated by comparing different event generators. An uncertainty due to the choice of generator is assessed by comparing the t ¯t+≥1b predictions obtained after reweighting Powheg-Box+Pythia 6 to the NLO calculation from SherpaOL and to an equivalent NLO calculation from MG5_aMC+Pythia 8, which differs in the procedure used to match the NLO matrix
element calculation and the parton shower (see Section 1.6.8 of Ref. [103]). The uncertainty from the
requirements) is fixed to the nominal prediction, i.e. effectively only migrations across categories and distortions to the shape of the kinematic distributions are considered.
In the following, uncertainties affecting all t ¯t+jets processes are discussed. Uncertainties associated with the modelling of ISR/FSR are obtained from the comparison of the Powheg-Box+Pythia 6 “radHi” and
“radLow” samples (see Section5.2) with the nominal Powheg-Box+Pythia 6 sample. An uncertainty
associated with the choice of NLO generator is derived by comparing two t ¯t samples, one generated with
Powheg-Box+Herwig++and another generated with MG5_aMC+Herwig++, and propagating the resulting
fractional difference to the nominal Powheg-Box+Pythia 6 prediction. An uncertainty due to the choice of parton shower and hadronisation model is derived by comparing events produced by Powheg-Box
interfaced to Pythia 6 or Herwig++. Finally, the uncertainty in the modelling of the top quark’s pT,
affecting only the t ¯t+light-jets and t ¯t+≥1c processes, is evaluated by taking the full difference between applying and not applying the reweighting to match the NNLO prediction. The above uncertainties are taken as uncorrelated between the t ¯t+light-jets, t ¯t+≥1c and t ¯t+≥1b processes. In the case of t ¯t+≥1b, in all instances the various HF categories and the corresponding partonic kinematics for the alternative MC samples are reweighted to match the NLO prediction of SherpaOL so that only effects other than distortions to the inter-normalisation of the various t ¯t+≥1b topologies and their parton-level kinematics are propagated. In the case of t ¯t+light-jets and t ¯t+≥1c the full effect of these uncertainties is propagated. Similarly to the treatment of the NLO corrections and uncertainties associated with t ¯t+≥1b discussed above, in the case of the additional uncertainties derived by comparing alternative t ¯t samples, the overall normalisation of the t ¯t+≥1c and t ¯t+≥1b background at the particle level is fixed to the nominal prediction. In this way, only migrations across categories and distortions to the shape of the kinematic distributions are considered. In order to maintain the inclusive t ¯t cross section, the t ¯t+light-jets background is adjusted accordingly.
Uncertainties affecting the modelling of the single-top-quark background include a +5%/−4% uncertainty in the total cross section estimated as a weighted average of the theoretical uncertainties in t-, W t- and
s-channel production [84–86]. Additional uncertainties associated with the modelling of ISR/FSR are
assessed by comparing the nominal samples with alternative samples where generator parameters were varied (i.e. “radHi” and “radLow”). For the t- and W t-channel processes, an uncertainty due to the choice of parton shower and hadronisation model is derived by comparing events produced by Powheg-Box
interfaced to Pythia 6 or Herwig++. These uncertainties are treated as fully correlated among single-top
production processes, but uncorrelated with the corresponding uncertainty in the t ¯t+jets background. The sum in quadrature of the above uncertainties on the single top normalisation at the preselection level is 20% in the 1-lepton channel and 20%(25%) in LM(HM) regions of the 0-lepton channel, respectively. An additional systematic uncertainty on W t-channel production concerning the separation between t ¯t
and W t at NLO [104] is assessed by comparing the nominal sample, which uses the so-called “diagram
subtraction” scheme, with an alternative sample using the “diagram removal” scheme. This uncertainty, which is taken to be single-sided, has a strong shape dependence and affects the W t normalisation by about −50% in the 1-lepton channel and LM regions of the 0-lepton channel, and by about −75% in HM regions of the 0-lepton channel. Due to the small size of the simulated samples, and hence limited statistical precision, these uncertainties cannot be reliably estimated in each analysis region and so their estimates at the preselection level are used instead. They are treated as uncorrelated across regions with different top-tagged jet and Higgs-tagged jet multiplicities and between the 1-lepton and 0-lepton channels. Uncertainties affecting the normalisation of the V +jets background are estimated for the sum of W +jets
and Z +jets, and separately for V +light-jets, V +≥1c+jets, and V +≥1b+jets subprocesses. The total
prediction in the different analysis regions considered, but requiring exactly 0 b-tagged jets. Agreement between data and predicted background in these modified regions, which are dominated by V +light-jets, is found to be within approximately 30%. This bound is taken to be the normalisation uncertainty, correlated across all V +jets subprocesses. Since Sherpa 2.2 has been found to underestimate V +heavy-flavour by
about a factor of 1.3 [105], additional 30% normalisation uncertainties are assumed for V +≥1c+jets and
V +≥1b+jets subprocesses, considered uncorrelated between them. These uncertainties are treated as uncorrelated across regions with different top-/Higgs-tagged jet multiplicities and between the 1-lepton and 0-lepton channels.
Uncertainties in the diboson background normalisation include 5% from the NLO theory cross
sec-tions [106], as well as an additional 24% normalisation uncertainty added in quadrature for each additional
inclusive jet-multiplicity bin, based on a comparison among different algorithms for merging LO matrix
elements and parton showers [107]. Therefore, normalisation uncertainties of 5% ⊕
√
3 × 24% = 42% and 5% ⊕
√
4 × 24% = 48% are assigned for events with exactly 5 jets and ≥6 jets, respectively (this assumes that two jets come from the W /Z decay, as in WW /W Z → `ν j j). Recent comparisons between data and Sherpa 2.1.1 for W Z (→ `ν``)+ ≥4 jets show agreement within the experimental uncertainty of
approximately 40% [108], which further justifies the above uncertainty. This uncertainty is taken to be
uncorrelated across regions with different top-/Higgs-tagged jet multiplicities and between the 1-lepton and 0-lepton channels
Uncertainties in the t ¯tV and t ¯tH cross sections are 15% and +10%/−13%, respectively, from the
un-certainties in their respective NLO theoretical cross sections [109–111]. Finally, an uncertainty of 30%
is estimated for the NLO prediction of the SM t ¯tt ¯t cross section [67]. Since no additional modelling
uncertainties are taken into account for these backgrounds, and the 1-lepton and 0-lepton channels cover different kinematic phase spaces, the above uncertainties in the t ¯tV , t ¯tH, and SM t ¯tt ¯t cross sections are taken to be uncorrelated between the two channels.
Uncertainties in the data-driven multijet background estimate receive contributions from the limited sample size in data, particularly at high jet and b-tag multiplicities, as well as from the uncertainty in the misidentified-lepton rate, measured in different control regions (e.g. selected with a requirement on either
the maximum ETmissor mWT ). Based on the comparisons between data and total prediction in multijet-rich
selections, the normalisation uncertainties assumed for this background are 50% (100%) for electrons with |ηcluster| ≤ 1 (|ηcluster| > 1), and 50% for muons, taken to be uncorrelated across regions with different
top-/Higgs-tagged jet multiplicities and between events containing electrons and events containing muons. In the case of the 0-lepton channel, the normalisation uncertainty assigned to the multijet background is 100%. No explicit shape uncertainty is assigned since the large statistical uncertainties associated with the multijet background prediction, which are uncorrelated between bins in the final discriminant distribution, are assumed to effectively cover possible shape uncertainties.