The Impact of Immediate and Delayed
Monetary Promotions of Private Label
Brands on Purchase Intention
Exploring the Role of Customer Perceived Value
Catarina Isabel Arsénio Neves
152116124
Dissertation written under the supervision of
Prof. Paulo Romeiro
Dissertation submitted in partial fulfilment of requirements for the
MSc in Management with Specialization in Strategic Marketing,
at Universidade Católica Portuguesa
August 2018
ABSTRACT Title
The Impact of Immediate and Delayed Monetary Promotions of Private Label Brands on Purchase Intention - Exploring the Role of Customer Perceived Value
Author
Catarina Isabel Arsénio Neves
More and more customers are choosing to buy private label brands instead of national brands, and Portugal is a good example with a market share of store brands around 33% in recent years. Aligned with this phenomenon, customers are also buying a lot of their grocery products with some type of promotion. This forces brands to develop a very dynamic promotional plan, and the days when national brands were the only ones doing promotions are long gone. Nowadays store brands invest a lot as well in offering price discounts. As such, the purpose of this dissertation is to understand the impact of these monetary promotions performed by private label brands on purchase intention, differentiating between two discount levels and two gratification timings, and exploring the role of customer perceived value. In order to study this interaction, a pretest was conducted to more accurately define the stimuli, followed by a survey with five different promotional scenarios, including a control group with no promotion, for two product categories – shampoo and milk. The results from the survey indicate that monetary promotions of private label brands do not impact customers’ purchase intention. Relatively to the type of discount it is clear that a high immediate discount is preferred over all the others, but only under an immediate scenario do customers favour a high over a low discount. Retailers should rather invest in improving their brands’ perceived value, which does strongly impact customers’ purchase intention positively.
Keywords
Sales Promotions; Private Label Brands; Immediate and Delayed Price Discounts; Purchase Intention; Perceived Value
SUMÁRIO Título
O Impacto de Promoções Monetárias Imediatas e na Próxima Compra de Marcas Próprias na Intenção de Compra – Explorar o Papel da Perceção de Valor do Cliente
Autora
Catarina Isabel Arsénio Neves
Cada vez mais os clientes estão a comprar marcas próprias em vez de marcas de fabricante, e Portugal é um bom exemplo, com uma quota de mercado de cerca de 33% em anos recentes. Em linha com este fenómeno, os clientes também estão a adquirir muitos produtos com algum tipo de promoção. Isto obriga as marcas a desenvolverem um plano promocional bastante dinâmico, e os dias em que as marcas de fabricante eram as únicas a fazerem promoções já lá vão. Atualmente, as marcas próprias também investem muito em descontos no preço. Assim sendo, o objetivo desta dissertação é compreender o impacto destas promoções monetárias de marcas próprias na intenção de compra, diferenciando entre dois níveis de desconto e dois tempos de gratificação, e explorar o papel da perceção de valor do cliente.
Para estudar esta interação, foi feito um pré-teste para definir os estímulos de forma mais precisa, seguido de um questionário com cinco cenários promocionais diferentes, incluindo um grupo de controlo sem qualquer promoção, para duas categorias de produto – champô e leite. Os resultados indicam que promoções monetárias de marcas próprias não têm impacto na intenção de compra do cliente. Relativamente ao tipo de desconto, um desconto elevado imediato é preferível em relação a todos os outros, mas apenas num cenário imediato é que os clientes preferem um desconto alto em vez de um baixo. Os retalhistas devem investir na melhoria da perceção de valor das suas marcas, o que influencia positivamente a intenção de compra dos clientes.
Palavras-chave
Promoções; Marcas Próprias; Descontos Imediatos e na Próxima Compra; Intenção de Compra; Perceção de Valor
ACKNOWLEDGEMENTS
This is a very important moment in my life! The present dissertation marks the end of my academic journey and opens the door to my future professional life, and I surely wanted to make the most out of it. As such, choosing a topic that was interesting and relevant to me was a priority. On the one hand, I am one of those people who loves a good promotion and apparently I am not alone, since in Portugal there is nowadays a strong promotional activity performed by the majority of the brands in the market, which consumers seem to take advantage of in order to save money. For some time now that I am intrigued with this phenomenon, and doing a research that included this theme would allow me to explore it further and hopefully reach some unexpected insights. On the other hand, I had this dream of starting my career as a management trainee for the Jerónimo Martins group, and for that reason I wanted to study a topic related to their core operations so that I could get a deeper understanding of their business and draw some significant managerial recommendations. That is why exploring the world of private label brands seemed like a perfect choice.
In order to make this all possible there are some essential “stakeholders” who helped me throughout the process and that deserve a huge thank you. First and foremost, my family is my rock who is always there for me to support me, motivate me and push me to be a better version of myself every day. They were crucial to get me where I am today academically and also become the person I aspire to be. Naturally their support was priceless during this period when I had to write my dissertation, especially the one of my sister, who bravely reviewed my entire project, and my mum and dad. Additionally, there are 617 people to whom I have to deeply appreciate for the time they took to fill out my thesis survey, particularly some friends and family that not only fill it out but also shared it with others, like my dad and cousin for example that almost every day for 17 days asked me “How many answers do you have so far? Let me send it to a few more people!”. Moreover, the help and guidance in every step of the process of my supervisor Paulo Romeiro was key to the completion of this dissertation, and I am extremely grateful for his advices and availability. Last but not least, I also appreciated a lot the time Professor Isabel Moreira took to clarify me some doubts about my SPSS analysis that constitutes an important part of my dissertation.
P.S. I am starting my trainee program at Jerónimo Martins in September 2018 – dreams do come true if you work and fight hard to achieve them!
TABLE OF CONTENTS
ABSTRACT ... II SUMÁRIO ... III ACKNOWLEDGEMENTS ... III TABLE OF CONTENTS ... V TABLE OF FIGURES ... VII TABLE OF TABLES ... VIII TABLE OF APPENDICES ... IX GLOSSARY ... X CHAPTER 1: INTRODUCTION ... 1 1.1BACKGROUND ... 1 1.2PROBLEM STATEMENT ... 2 1.3RELEVANCE ... 3 1.4RESEARCH METHODS ... 3 1.5DISSERTATION OUTLINE ... 4
CHAPTER 2: LITERATURE REVIEW AND CONCEPTUAL FRAMEWORK ... 5
2.1PRIVATE LABEL BRANDS ... 5
2.2PROMOTIONS ... 7
2.2.1 Immediate versus Delayed Gratification ... 8
2.2.2 Discount Level ... 9
2.2.3 Interaction between Gratification Timing and Discount Level ... 10
2.3CUSTOMER PERCEIVED VALUE ... 10
2.4PURCHASE INTENTION ... 12 2.5CONCEPTUAL FRAMEWORK ... 13 CHAPTER 3: METHODOLOGY ... 14 1.1 RESEARCH APPROACH ... 14 3.2SECONDARY DATA ... 15 3.3 PRIMARY DATA ... 15 3.3.1 Pretest ... 15 3.3.2 Main Survey ... 17
CHAPTER 4: RESULTS ... 21
4.1SAMPLE CHARACTERIZATION... 21
4.2CONSTRUCTS RELIABILITY ... 22
4.3PRETEST RESULTS CHECK ... 23
4.4RESULTS FROM THE HYPOTHESES TESTING ... 24
4.4.1 The Impact of Monetary Promotions of PLB on PI ... 25
4.4.2 The Influence of CPV for the Customers ... 27
4.4.3 Mediation and Moderation Analysis ... 28
4.4.4 Hypotheses Testing Overview... 29
4.5ADDITIONAL ANALYSIS:CLUSTERS ... 29
CHAPTER 5: CONCLUSIONS AND LIMITATIONS ... 31
5.1MAIN FINDINGS AND CONCLUSIONS ... 31
5.2ACADEMIC AND MANAGERIAL IMPLICATIONS ... 33
5.3LIMITATIONS AND FURTHER RESEARCH ... 34
REFERENCE LIST ... I APPENDICES ... VII
TABLE OF FIGURES
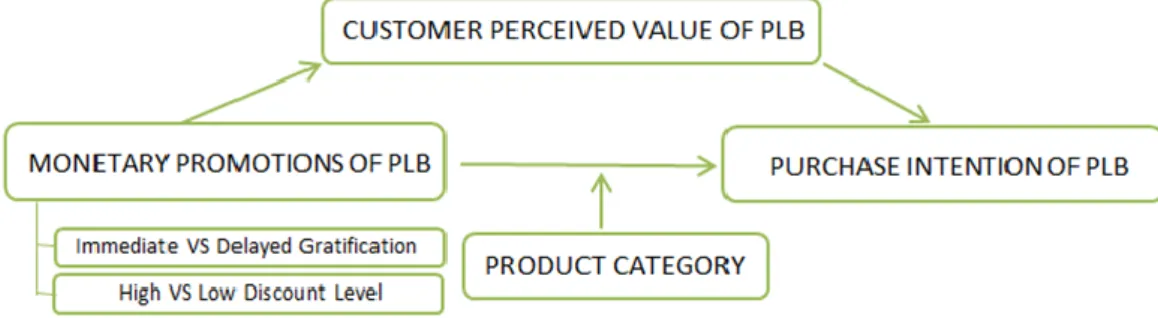
Figure 1: Conceptual Framework………13
Figure 2: Survey Design……….….18
Figure 3: Statistical Diagram PROCESS Model 5………...………..…...20
TABLE OF TABLES
Table 1: Measurement Model……….19
Table 2: Cronbach’s Alpha……….22
Table 3: Purchase Intention Means……….……24
Table 4: Customer Perceived Value Means...…...24
Table 5: Independent-Samples t-Test for Shampoo and Milk Purchase Intention………...25
TABLE OF APPENDICES
Appendix 1: Pretest……….VII Appendix 2: Pretest Answers……….…VIII Appendix 3: Online Survey – English Version ………...IX Appendix 4: Online Survey – Portuguese Version………XIV Appendix 5: Sample Characterization Graphics……….XX Appendix 6: H1 Independent-Samples t-Tests……….………XXI Appendix 7: H1A Independent-Samples t-Tests……….…XXII Appendix 8: H1B Independent-Samples t-Tests………XXIII Appendix 9: H1C Independent-Samples t-Test……….XXIV Appendix 10: H2 Independent-Samples t-Tests………XXIV Appendix 11: H3 Pearson Correlation Test………XXV Appendix 12: H4 and H5 - PROCESS Model 5 Output…. ………XXV Appendix 13: Cluster Analysis Results……….XXVI
GLOSSARY
PLB: Private Label Brands NB: National Brands
CPG: Consumer Packaged Goods PI: Purchase Intention
CPV: Customer Perceived Value RQ: Research Question
CHAPTER 1: INTRODUCTION 1.1 Background
A “global phenomenon” was a term used in the past to describe private label brands, being nowadays an essential piece of the food retailing industry strategy worldwide (Chimhundu, 2011). PLB, or store brands as they are also known, are brands of the retailer or wholesaler ownership that are sold exclusively in their stores (Hyman et al., 2010; Wu et al., 2011). Regarding strategic advantages from the distributors stand point of having PLB, there are many that should be outlined such as the rise of bargaining power over manufacturers of national brands (Batra and Sinha, 2000), the increase in store loyalty (Ailawadi et al., 2008), the higher margins achieved (Ailawadi and Harlam, 2004; Lamey et al., 2012) or the differentiation opportunity (Quelch and Harding, 1996; Wu et al., 2011). Simultaneously, PLB have been growing in popularity among consumers due to its lower prices versus NB, given that on average PLB are 30% cheaper than their direct national competitors (Kakkos et al., 2015). However, what seems to be even more important than the price for consumers is the high quality of the store brands, which is a determinant factor of their success (Hoch and Banerji, 1993). And this success has been growing over the last decade. According to Kumar and Steenkamp (2007), at that time PLB yearly sales revenue in the world was reaching the 1 trillion US dollars mark and there was a growing trend (Wu et al., 2011), with PLB of consumer packaged goods existing in more than 90% of the categories (Cuneo et al., 2015). Considering the European market only, market shares averaged 30% in 2011 (Braak et al., 2013), although there were substantial differences in shares and growth rates across product categories (Hoch and Banerji, 1993; Batra and Sinha, 2000).
That being said, PLB have become a serious challenge for NB to cope with (Lamey et al., 2012; Chimhundu, 2011). In order to do so, and re-attract those consumers who have started to move towards PLB, manufacturers of NB have engaged in deeper promotional activity to bring their prices closer to the ones of store brands (Manzur et al., 2011; Garretson et al., 2002). By doing promotions, more specifically short-term price discounts, NB tend to see a temporary and significant positive effect on sales (Blattberg et al., 1995).
In Portugal, the market share of PLB in CPG in the year of 2014 was 32.9%, one of the highest alongside countries like Switzerland (44.5%), Spain (42.0%), Great Britain (41.4%) and Germany (34.5%) (Olbrich et al., 2016). Regarding promotions, consumer behaviour has
changed in the last few years, with many consumers waiting for promotions to buy certain products, while average price discounts rise with time (Montez, 2016). For example, in the first trimester of 2016 the average price discount was of 33.7% (Montez, 2016), +4.6pp than in the same period of 2014. In 90% of the promotions, the price discount was immediate (Montez, 2016). As this battle between PLB and NB intensifies, the distributors start to invest more in promotions of their PLB, which also helps to attract customers to their stores since they are exclusive deals of each retailer that cannot be found elsewhere (Lombert, 2018). This phenomenon is quite popular in Portugal nowadays, with the major retailers Pingo Doce and Continente strongly investing in price cuts of their PLB, usually between 10 and 40%, in many product categories, as it can be noticed in their weekly promotional leaflets.
With this in mind, the purpose of this thesis is to better understand the impact of PLB monetary promotions, differentiating them in terms of timing of gratification and discount level, on customers’ purchase intention, within two distinct product categories and testing for a possible mediation of customers’ perceived value.
1.2 Problem Statement
This dissertation aims to investigate what is the impact of different types of monetary promotions of PLB, at the specific cases of the shampoo and the milk categories, on the levels of PI of those products. Simultaneously, it also proposes to analyse whether or not CPV of the studied products mediates the previous relationship. In what concerns the type of promotions studied, this research will focus on immediate versus delayed monetary promotions, in which the gratification will be given either immediately at the moment of purchase or only at the next visit to the store, respectively. For the first situation an immediate price discount will be applied, whereas a price discount that is saved in the retailer’s loyalty card to use only in the next purchase represents the second condition. In both cases the promotion will be announced in advance and at the same point in time, only the redemption of the gratification will differ. Additionally, two different discount levels will be considered, in order to assess if PI and CPV significantly vary depending on whether customers are offered a low or a high discount. Not only this, but the interaction between immediate and delayed gratification and the discount levels will be evaluated in the hope that some interesting results would come out of this relation. All of these effects will also be weighed against a condition where no discount is applied.
RQ1 - What is the impact of monetary promotions of private label brands on purchase intention for the given product categories?
RQ1A - What is the impact of immediate versus delayed monetary promotions on purchase intention?
RQ1B - What is the impact of low versus high discount levels on purchase intention? RQ2 - What is the role of customer perceived value in the relationship between monetary promotions of private label brands and purchase intention?
1.3 Relevance
Academically speaking, although there is already plenty of research conducted on the PLB topic, that research is mainly focused on trends and success factors of this type of brands in the CPG industry. Simultaneously, for decades a lot of journals have published articles from many authors related to sales promotions, reporting the effects of monetary and non-monetary promotions on PI and brand equity, for example. However, almost all of them focus on promotions in general or associated with NB. One can notice the gap in the literature regarding specific research of promotions in the context of PLB, which is a current phenomenon that people are faced with every day and that deserves academic attention. Complementarily, the differentiation between immediate and delayed gratification has been widely studied in science and psychology journals but not as much on the marketing field associated with its impact on PI and CPV. As such, this thesis will contribute to academic research in the area of sales promotions of PLB.
From a managerial perspective, with more and more people buying PLB in Portugal and retailers increasingly investing in price discounts of their own brands, it is relevant to understand if this investment translates into a significant positive impact in terms of consumers’ PI, which ultimately represents the impact on sales. At the same time, it is also valuable for distributors to understand what type of promotion is better in order to maximize PI of consumers, according to the product category, while controlling for its effects on CPV of their brands. Overall, this research aims to help retailers and wholesalers make better informed business decisions in what concerns their PLB’s promotional activity.
1.4 Research Methods
With the intention of exploring this topic and giving a thorough answer to each one of the research questions, on a first step a careful review of the existing literature was performed, mainly from academic papers of relevant marketing journals, on the topics of PLB,
promotions, CPV and PI. The secondary data obtained with this analysis was crucial to acquire in-depth knowledge regarding the concepts that were studied and served as a basis for the development of hypotheses. In turn, those were tested using methods of primary data collection. At this second stage, a pretest was conducted as a way to obtain relevant information to use later at the main questionnaire. This was followed by an online survey, in which five different promotional scenarios were created – no promotion, immediate and low promotion, immediate and high promotion, delayed and low promotion, and delayed and high promotion. One of these five scenarios was randomly assigned to a respondent, for each of the two product categories, and they had to mention their level of agreement with a series of statements aiming at measuring their CPV and PI. The participants that were not shown any promotion represent the control group, against which the other scenarios are going to be compared in order to test some of the hypotheses. This research method allowed for a generalization of the results, based on the quantification of the data.
1.5 Dissertation Outline
After this first introductory section, this dissertation is divided into four other main chapters. The next chapter comprises the literature review on the theoretical concepts covered, as well as the formulation of the hypotheses. Afterwards, the methodology used to find the answers for the research questions is presented, including the research approach used, and a detailed description of all the methods applied. Later on, the disclosure of the results takes place in the fourth section, where the hypotheses are either validated or not. Finally, a fifth chapter goes through the most important conclusions of this study, the main limitations encountered, and some indications for further research.
CHAPTER 2: LITERATURE REVIEW AND CONCEPTUAL FRAMEWORK
In this section of the dissertation, a review of the previous literature concerning the main topics and theoretical concepts addressed in the introductory section is performed. It covers ideas and theories presented in relevant academic journals that serve as a foundation for the specific research problem this thesis proposes to explore, as well as the development of adequate hypotheses. As such, it starts with an overview of the PLB industry and its importance in today’s retailing environment. Afterwards, it focuses on the topic of promotions, where there is a clear distinction between immediate versus delayed gratification of promotion and some emphasis on the discount level concept. Then, previous research done on CPV is analysed, followed by another sub-section dedicated to PI.
2.1 Private Label Brands
Using a definition of Raju et al. (1995), “store brands, or private labels, are brands owned, controlled, and sold exclusively by a retailer”. The concept of PLB has emerged in the beginning of the twentieth century with retailers like A&P in the United States introducing a few store brands in specific categories such as tea (Raju et al., 1995). Although they have been having success with US consumers (Hyman et al., 2010), over the past decades this specific category of brands has been performing better in terms of sales in Europe (Hoch and Banerji, 1993; Nielsen, 2014). Even though PLB’s market share in Europe is quite significant, averaging 30% in 2011 (Braak et al., 2013), there are big discrepancies between countries (Hyman et al., 2010). According to data of 2014, Switzerland ranked very high in market share of PLB (44.5%), while Italy’s market share is more moderate (17.6%), and Ukraine has one of the lowest market shares in Europe (5.0%) (Olbrich et al., 2016; Nielsen, 2014). Outside Europe, there are countries such as China that does not go beyond a 1% market share for PLB, while the United Sates reaches a value of 18% in 2014 (Nielsen, 2014). This variance between countries can be explained at the market level for example, in which different market conditions such as retailers’ concentration are to be considered, or at the consumer level, in which diverse degrees of consumer price consciousness may affect their attitude towards PLB (Hyman et al., 2010). On a different note, market shares of PLB also significantly differ across product categories in the CPG industry and across retailers as well (Hyman et al., 2010; Méndez et al., 2008; Hoch and Banerji, 1993). According to a report by Nielsen (2014), a category clearly dominated by NB is hair care, where 98% of total sales do not come from PLB. The same report also pinpoints some category characteristics that may
lead to this scenario of low PLB penetration: strong brand equity of NB, which creates a willingness to pay a price premium; high product differentiation and rate of innovation; large marketing investment in the category; strong use of promotions; as well as a long purchase cycle when compared to other CPG categories (Nielsen, 2014). On the opposite side, milk is a category where PLB have a strong position in the market, given that in developed markets it usually represents around 40% of total sales. The factors contributing to this are basically the contrary of the hair care case: low brand equity and innovation rate; weak product differentiation; quite high purchase frequency along with consumers’ sensitivity to prices (Nielsen, 2014). Many scholars have tried to understand the factors that drive PLB’ PI purchase intention. Wu et al. (2011), for example, concluded that store image has a direct effect on PLB purchase intention and that service quality indirectly affects PI, through PLB image. According to Hoch and Banerji (1993), product categories in which there are high quality levels and lower variability are expected to lead to higher market shares for PLB. Additionally, Batra and Sinha (2000) concluded that consumers will more easily buy PLB in a category in which the consequences of doing a bad purchase are lower. Overall, there is a variety of factors that may explain the performance of PLB in the marketplace, notwithstanding there is one characteristic that consumers strongly value when buying PLB: quality (Hoch and Banerji, 1993; Nielsen 2014; Bao et al., 2011). Retailers have noticed this and have been investing in improving the quality of their PLB over the years, as well as allocating more resources to the marketing activity of their brands (Méndez et al., 2008). The difference in the quality levels of PLB and NB is now narrower, and some store brands can even surpass the quality of their direct competitors (Quelch and Harding, 1996; Méndez et al., 2008; Hyman et al., 2010). Consequently, consumers have detected this shift since 71% of them, on average, consider that PLB have been improving their quality over time (Nielsen, 2014). In fact, many times they cannot tell the difference between PLB and NB, which leads several consumers to believe that PLB possess similar quality at a lower price (Hyman et al., 2010). Regarding prices, according to an analysis performed by Volpe (2011) in two supermarket chains in the US, prices of PLB are, on average, 23% lower than the ones of NB in a situation with no promotional activity from both sides. Nevertheless, this price difference drops to only 3% when NB are on promotion, triggering a response by retailers to protect their own PLB, also offering price discounts (Volpe, 2011). However, some authors such as Tellis and Zufryden (1995) or Ailawadi et al. (2001) have questioned the profitability of this type of promotional decisions, since it attracts a smaller portion of the market than NB promotions (Blattberg and Wisniewski, 1989).
2.2 Promotions
While there is already a lot of research done on the topic of promotions, more specifically promotions performed by NB, there seems to be a gap in the literature concerning the study of promotions applied to PLB. It seems relevant to address this issue in order to better understand whether there are significant differences in customers’ perceptions and intentions towards NB and PLB sales promotions.
Firstly, it is important to start with a definition of sales promotion. According to DelVecchio et al. (2006), “sales promotions are typically viewed as temporary incentives that encourage the trial of a product or service”. There is no clear direction on whether sales promotions bring more advantages or disadvantages regarding brand preference (DelVecchio et al., 2006). Some argue that doing promotions will damage the long-term value of a brand (Aaker, 1996), while others claim it can actually increase the preference for a brand in future occasions (Rothschild and Gaidis, 1981). A fact is that promotions are a significant portion of companies’ marketing budgets in various industries (Blattberg et al., 1995).
It is quite common in the literature to come across the differentiation between monetary and non-monetary promotions (Buil et al., 2011; Lowe and Barnes, 2012). Monetary promotions most commonly refer to price discounts and coupons, whereas non-monetary ones include free samples and gifts, contests and sweepstakes (Buil et al., 2011). As concluded by Chandon et al. (2000), the first type of promotions is mainly linked with utilitarian benefits, while the latter relates more to hedonic benefits. Regarding monetary promotions, the most widely used type of promotion is price discounts (Darke and Chung, 2005). It is quite unanimous in the literature that temporary price discounts lead to a substantial short-term sales increase (Blattberg et al., 1995).
H1: Monetary promotions of private label brands increase customers’ purchase intention. For the purpose of this dissertation only monetary promotions are analysed, focusing on the distinction between immediate versus delayed gratification of promotion, in which instant price discounts represent an immediate gratification and price discounts that are saved in the retailer’s loyalty card to use only in the next purchase represent a delayed gratification. Moreover, the impact of two discount levels against the no discount situation is also studied.
2.2.1 Immediate versus Delayed Gratification
The topic of immediate versus delayed gratification has been broadly researched in the science and psychology fields for many years (Green et al., 1994; McClure et al., 2004; Hariri et al. 2006). In addition, some scholars have applied this concept to the management and marketing areas as well. Dowling and Uncles (1997) and Yi and Jeon (2008), for example, use immediate versus delayed rewards as a variable in their studies of customer loyalty programs. In the topic of sales promotions, scholars like Chatterjee (2007) or Kaltcheva et al. (2013) have also addressed these concepts in the past.
Immediate promotions are characterized by offering an instant gratification or benefit to the customer, while delayed promotions gift customers with a gratification or benefit that can only be redeemed at a later point in time (Kaltcheva, 2013). Price discounts, the type of immediate promotion that is analysed, have the power to increase customers’ brand awareness as well as PI (Teng, 2009). This happens because these sales promotions will represent an economic benefit for customers, improving their savings and value perceptions, as well as positively influence their attitude towards the brand in relation to competitors; at the same time it also represents a large investment from companies that can result in reduced profitability and consumers’ reference prices (Teng, 2009). As for the delayed promotion, a price discount that is saved in the retailer’s loyalty card to use only in the next purchase was chosen as a representative, and this type of promotion stimulate immediate sales without compromising profit margins and raise future sales (Chatterjee, 2007). Even though in the present visit to the supermarket the regular price of the product is paid, since the customer is aware of the future gains, he or she will mentally incorporate that value on the current purchase, which leads to an increase in sales of the promoted brand (Kaltcheva, 2013; Chatterjee, 2007). Besides this benefit for the retailer it will also be an incentive for the customer to come back to the store in the near future to use the acquired discount; but there are also some that argue that this type of promotion allows for some customers that would have bought the product at a regular price anyway to do so at a discounted price in the next visit, lowering profit margins (Chatterjee, 2007).
As far as people’s preferences is concerned, they naturally desire to receive gratifications as soon as possible, taking into account that discounting rewards that will possibly occur in the future requires a more complex decision-making process that involves, for example, self-regulation and impulse-control (Hariri et al. 2006). According to Green et al. (1994), people
from all age groups show the delay discounting phenomenon, which is “the change in the value of a reward as a function of its temporal proximity”. In other words, there is a decrease in the value attributable to a reward as times passes or the delay increases, which is associated with risk, as an immediate gratification is much more certain than a delayed one (Green et al., 1994).
In the context of retailers’ loyalty programs, the conclusion that immediate rewards are preferred by customers over delayed rewards in a low-involvement situation was reached (Yi and Jeon, 2003), since delayed rewards would function as a weaker motivator (Dowling and Uncles, 1997).
H1A: A private label brand promotion with immediate gratification will generate a higher customer purchase intention than a promotion with a delayed gratification.
2.2.2 Discount Level
Price promotions are used by retailers to attract customers to their stores and stimulate purchases, but it also has a negative influence on consumers’ internal reference prices and perceptions of product quality, impacting consequently their value perceptions (Grewal et al., 1998). According to Gupta and Cooper (1992) and based on the adaptation-level theory and assimilation-contrast theory, customers have their own internal reference prices that they use as a reference to compare against current prices of products. And this reference prices are gradually changed downwards every time there is a price discount (Grewal et al., 1998), which in turn leads customers to perceive discounts has having less value, since savings will be evaluated as the difference between the reference price and the discounted price (Gupta and Cooper, 1992). This process that makes the perceived discount inferior than the actual discount, named discounting of discounts by Gupta and Cooper (1992), is greater for higher discount levels and lower for NB than for PLB, meaning that the same discount on a NB and a PLB has more impact on the PI of the NB. Managers must take into consideration all these effects in order to determine the optimal discount level to apply to their products (Grewal et al., 1998).
Additionally, it is important to notice that there is a threshold for price discounts, below which customers will not be influenced to buy the promoted product that Gupta and Cooper (1992) stated to be around 15 percent, although this value should be higher for PLB. They also suggest that the higher the discount, the higher the customers’ PI. This conclusion was
also verified by Alford and Biswas (2000), who found that a higher discount level significantly increases PI and value perceptions.
H1B: A higher discount level will generate a stronger customer purchase intention of the private label brand than a lower discount level.
2.2.3 Interaction between Gratification Timing and Discount Level
It has been widely researched in the past the apparent irrational behaviour that makes many people favour smaller and immediate rewards over larger but delayed ones, which will result in a less significant total reward in the long-run (Green et al., 1994; Hariri et al., 2006). This behaviour is generally associated with individuals that lack self-control and are more impulsive, being also more prone to engage in certain behaviours such as gambling or cigarette smoking, which are considered to be addictive (Hariri et al., 2006). Moreover, although people act impatiently today, they plan to behave more patiently in the future, and this situation can be exemplified with the preference for $10 today instead of $11 tomorrow, but the preference for $11 in a year and one day instead of $10 in one year (McClure et al., 2004). McClure et al. (2004) shows that the difference between these inconsistent preferences is related to the use of distinct neural systems, more precisely that “short-run impatience is driven by the limbic system, which responds preferentially to immediate rewards and is less sensitive to the value of future rewards, whereas long-run patience is mediated by the lateral prefrontal cortex and associated structures, which are able to evaluate trade-offs between abstract rewards, including rewards in the more distant future”.
H1C: An immediate but lower discount will lead to a higher customer purchase intention of the private label brand than a delayed but higher discount.
2.3 Customer Perceived Value
The concept of customer perceived value has been extensively addressed in the past, being the central pillar of the research of many scholars (Grewal et al., 1998; Sweeney and Soutar, 2001; Zeithaml, 1998; Dodds et al., 1991). As defined by Zeithaml (1998), “perceived value is the consumer's overall assessment of the utility of a product based on perceptions of what is received and what is given”. However, what someone gives and gets in this trade-off is not a straight forward relationship, since different customers value different things (Zeithaml, 1998; Sweeney and Soutar, 2001). At the same time, other authors also refer to CPV as the trade-off between the perceived quality of the product and its perceived price (Chen et al., 1998;
Grewal et al., 1998; Gupta and Cooper, 1992). Considering this approach, in order to maximize CPV towards a product, a company should either enhance the respective perceived quality or decrease their perceived monetary sacrifice (Li and Green, 2011), since quality has a positive effect on perceived value and price has a negative one (Sweeney and Soutar, 2001). There are some researchers as well who state that this approach is too basic and that one could include benefits such as after-sale service together with perceived quality (Sweeney and Soutar, 2001), and time and effort, which are non-monetary sacrifices, alongside the monetary one given by the perceived price (Li and Green, 2011).
Perceived quality was defined by Zeithaml (1998) as “the consumer's judgment about the superiority or excellence of a product”. This concept is different from objective quality, which is the “actual technical superiority or excellence of the products” that can be accurately measured and verified against established standards (Zeithaml, 1998). However, it can also be argued that objective quality is not possible and that all evaluations concerning quality are in fact subjective (Zeithaml, 1998). There are intrinsic and extrinsic attributes that might be indicative of a product’s quality, in which intrinsic means the physical elements that cannot be altered without modifying the nature of the product, for example its color or texture; and extrinsic are also related to the product but not part of the product itself, like its price or brand name (Zeithaml, 1998). Quality differs from value in two ways, first quality does not involve a trade-off, while value does, and second value is a more personal and higher level concept compared to quality (Zeithaml, 1998). That being said, what does exist is a positive relationship between the quality and the value perceptions of a product (Grewal et al., 1998; Dodds et al., 1991).
Regarding price, it can be defined as what a customer has to give up in order to acquire a product, and similar to quality it can also be differentiated between objective and perceived price (Zeithaml, 1998). While the first is the actual monetary price of a product, the second is related to the price that customers themselves encode, and although many times clients do not remember the objective prices of products, they translate them into price-related codes that have a stronger meaning to them, often resulting in inaccurate internal reference prices (Zeithaml, 1998). Consumers tend to believe that prices in the marketplace are based on the interaction between supply and demand, and therefore they use price as an indicator of the level of quality of a product (Grewal et al., 1998; Dodds et al., 1991). In this line of thought, price discounts would be likely to generate a negative impact on quality perceptions (Grewal et al., 1998). However, the hypothesis that the higher the price discount, the lower the quality
perceptions was rejected in the research conducted by Grewal et al. (1998) that found out that price discounts are not significantly associated with perceived quality.
Perceived value is considered a determinant of customer satisfaction (Cronin et al., 2000), market share and customer loyalty (Li and Green, 2011). Although the constructs of perceived value and satisfaction might be mixed up sometimes, one is very different from the other in the sense that the first can occur at multiple phases of the process of purchase, even before the product is bought, while the latter is an evaluation performed only after using the product (Sweeney and Soutar, 2001). Additionally, the perceived value of a product is part of the on-going process of nurturing the relationship between a customer and a retailer or manufacturer (Sweeney and Soutar, 2001).
Relatively to the relationship between price discounts and customer value perceptions, Teng (2009) suggests that price discounts can be effective in the sense that they would improve customers’ value perceptions and savings. Similarly, Chen et al. (1998) state that by offering a price discount a retailer may reduce the perceived monetary sacrifice that a customer has to make in order to purchase a product, which in turn will boost perceived value of that product, given that it will not affect perceived quality as mentioned before. As such, price discounts that are wisely managed have the potential to impact customer perceived value without damaging the perceived quality of the product, which allows distributors to successfully provide high value (Grewal et al, 1998).
H2: Monetary promotions of private label brands increase customers’ perceived value.
2.4 Purchase Intention
Using the definition of Wu et al. (2011), purchase intention is “the possibility that consumers will plan or be willing to purchase a certain product or service in the future”. It has been used multiple times over the years as a predictor of subsequent buying behaviour, since it is considered to be the step immediately before actual purchase (Grewal et al., 1998; Kakkos et al., 2015). In fact, an increase in PI is the same as saying an increase in the possibility of making a purchase, and it is a relevant estimator of the behaviour of consumers, in the sense that having a positive PI results in a positive brand commitment, which leads customers to an effective act of purchase (Wu et al., 2011). Nevertheless, customers’ decision to buy a certain product is influenced by physiological, social or psychological needs (Kakkos et al., 2015), and PI might as well be influenced by factors such as the price, the quality and consequently
the value perceptions of the given product (Jaafar et al., 2013). Grewal et al. (1998) is one of the past researches that has positively associated purchase intention and perceived value, being perceived value the relation between price promotion and quality perceptions, or in other words the balance between what customers give up against what they receive in exchange. Teng (2009) also mentions that customers tend to buy brands with a higher value, meaning a high quality/price ratio. Similarly, Dodds et al. (1991) verified as well the positive relationship between customers’ perceived value and their willingness to buy.
H3: For private label brands, there is a positive relationship between customers’ value perceptions and their purchase intentions.
H4: Customer perceived value mediates the relationship between monetary promotions of private label brands and its purchase intention.
Finally, complementarily to previous information regarding variability in the market shares of different PLB product categories, there seems to be also some differences in the sales response to the same promotional activity across product categories. Raju (1992), for example, concluded in his research that bulky and highly competitive categories may present a lower potential for an increase in sales due to sales promotions. As such, studying the possible moderation effect of product category in the context of PLB promotions and its impact on PI might be of considerable interest.
H5: Product category moderates the relationship between monetary promotions of private label brands and its purchase intention.
2.5 Conceptual Framework
CHAPTER 3: METHODOLOGY
In this third chapter of the dissertation, the methodology used in order to answer the proposed research questions and analyse the validity of each of the formulated hypotheses is explained. It starts with an overview of the research approach, followed by a description of the methods used for collecting secondary and primary data.
1.1 Research Approach
The objective of this dissertation is to explore the effectiveness of different types of promotions of PLB in generating sales for the respective retailers and wholesalers. By performing a review of the existing literature on these topics, it was possible to better understand how this relationship might work and which other variables are possible to influence it. This process allowed developing a specific conceptual model that was then tested to assess all significant associations between the constructs.
In order to do so, first it is important to consider what type of research methods is to be used to better address the research objectives of this thesis. According to Kothari (2004), there are four main research methods: exploratory, descriptive, diagnostic and hypothesis-testing; each one being more appropriate to a specific research objective. In this case, both exploratory and hypothesis-testing research methods were used. Exploratory research has the aim of unveiling new insights about a particular phenomenon, while hypothesis-testing, as the name suggests, intends to test some hypothesis regarding a causal relation between variables (Kothari, 2004). As far as qualitative and quantitative research is concerned, both were used in this dissertation. A quantitative approach consists of collecting the data in a quantitative way so that it can later be rigorously and quantitatively analysed in a formal and rigid style, and it can be sub-categorized into inferential, simulation and experimental approaches (Kothari, 2004). For the purpose of this study only an inferential quantitative approach was applied, whose aim is to study a sample of the population to infer characteristics or relationships of the population by conducting a survey research (Kothari, 2004). Complementarily, a qualitative approach was also implemented in the form of a pretest. This approach deals with subjective evaluations of attitudes, behaviours and opinions, which results in non-quantitative conclusions or conclusions that are not exposed to a rigorous quantitative analysis (Kothari, 2004).
That being said, the exploratory qualitative research used consists of the collection of the secondary data, through a review of the literature, as well as a pretest employed in order to determine which type of immediate and delayed monetary promotions and discount levels would be better to implement in the main survey, as to avoid any type of bias of the researcher. Additionally, the quantitative hypothesis-testing research used involves an online survey that intends to investigate all proposed hypotheses, quantifying and generalizing results with the objective of thoroughly answer all research questions.
3.2 Secondary Data
Secondary data collection consists of the entire chapter 2 of the dissertation, in which a thorough literature review was performed as to gain a clear understanding of previous research findings on the topics covered in this thesis. Accordingly, data was collected mainly from relevant marketing journals and is used as a support for the development of the primary data collection methods that is described below.
3.3 Primary Data
Primary data was also collected in order to be able to give an appropriate answer to each one of the proposed research questions, and it includes both a pretest and a main survey.
3.3.1 Pretest
A pretest was conducted before implementing the main survey of this research as to define which type of promotions best represent in the respondents opinion an immediate and a delayed promotion, and which percentage levels represent a low and a high discount level for two PLB product categories. The two chosen product categories were based on the literature review findings that spotted a big discrepancy in market shares between several categories, being shampoo one of the categories with the lowest market share of PLB as opposed to milk that has one of the highest (Nielsen, 2014). That being said, both were studied so that the hypothesis of a product category moderation could be later tested. See appendix 1.
3.3.1.1 Data Collection
For the purpose of this pretest, 20 respondents from a convenience sample were asked to give their opinions regarding 8 promotions related questions, which according to Kothari (2004) is a reasonable number of respondents for a pretest. Although it is a non-probability sample,
which may produce biased results, an effort was made to make it as heterogeneous as possible, especially in terms of age. As such, participants were aged between 18 and 85 years old, with at least one respondent representing each decade in between these two values. All of them do grocery shopping at least occasionally and are familiar with the two product categories studied.
3.3.1.2 Data Analysis
After analysing the answers of all 20 respondents (see appendix 2), some conclusions can be drawn. In first place, when asked which promotion would better represent in real life an immediate promotion, the big majority (80%) chose the price discount option; while the results for a delayed promotion are not that straight forward. Half the respondents indicated that a price discount that is saved in the retailer’s loyalty card to use only in the next purchase is the best representative of a delayed promotion, being a coupon that can only be used at a specific future date the second most voted option by 30% of respondents. That being said, in order to study the differences in response between an immediate and a delayed promotion, which are independent variables in this study, a price discount and a price discount that is saved in the retailer’s loyalty card to use only in the next purchase were the selected stimuli that were used in the main study. Additionally, participants were asked three more questions for each one of the two selected product categories mentioned before. Firstly, as to make them think about the product beforehand they gave an estimate of the average price of a specific shampoo and milk of a PLB and results show that for both products the respondents reference prices are, on average, higher than actual prices. For a 250ml shampoo the average of the responses was 2,77€, while the actual price of a 250ml Cosmia shampoo for example, from Auchan, is 1,19€1. The same happened for the milk category, in which 0,92€ was the average
price of respondents for a 1l milk package, whereas the actual price for a Continente half-fat 1l milk is 0,51€2 for example. Nonetheless, although these two categories are very different
intrinsically and in terms of market share of PLB, participants attribute approximately the same discount levels for both categories in terms of what they consider to be a low and a high discount. For a shampoo of a PLB, an average percentage level that was considered a low or a “bad” discount was 9%, and the same value applies for a PLB of milk. Regarding what participants considered a high or “good” discount, the average value found for shampoo was 31%, while for milk it was 28%. Taking these pretest results into consideration, the discount
1 From www.jumbo.pt accessed on 6th April 2018 2 From www.continente.pt accessed on 6th April 2018
levels set as stimuli for the main study were 10% representing a low discount and 30% representing a high discount.
3.3.2 Main Survey
As the main source of primary data, in order to quantity results and find the appropriate answers for the research questions of this dissertation, an online survey was conducted. This survey method was selected due to its relevant advantages compared to other methods, namely the lower costs associated with it even when reaching a large sample, which is a necessary condition as to make the results more reliable, the absence of interviewer bias, and also the fact that respondents have much more time to give well thought out answers (Kothari, 2004).
The online survey consists of a questionnaire with 16 questions, including control questions, questions to verify the results obtained in the pretest, a main question to evaluate PI and CPV relative to different stimuli within two distinct product categories, as well as demographic questions. On a first stage, a pilot survey was conducted with 5 respondents with the aim of uncovering potential weaknesses of the questionnaire and correct them. Afterwards, the final survey with the necessary adjustments was distributed via social media networks and email, with a Portuguese and an English version, from April 16th to May 2nd 2018.
3.3.2.1 Data Collection
The target sample for the survey was anyone who had bought shampoo and/or milk in the last 12 months, so that their answers would be as realistic as possible. In order to guarantee that respondents would meet this criterion, two control questions, one for each product category, were asked before presenting the respective stimuli. Non-probability samples were employed to collect the data, namely convenience and snowball techniques. These techniques, although susceptible to a degree of bias, were considered to be the best options given the constraints of the researcher, allowing for convenience as the name suggests and low costs (Kothari, 2004). For each one of the 5 scenarios of each product category, which can be seen in detail in the next sub-section, the target sample size was at least 100 valid answers per each evenly and randomly assigned stimulus, the equivalent of 500 valid answers per product category. The questionnaire was closed with a total of 802 answers, from which several were not considered since they represented answers in progress and respondents that did not pass the control questions. That being said, a final database with 617 valid answers was achieved.
3.3.2.2 Survey Design
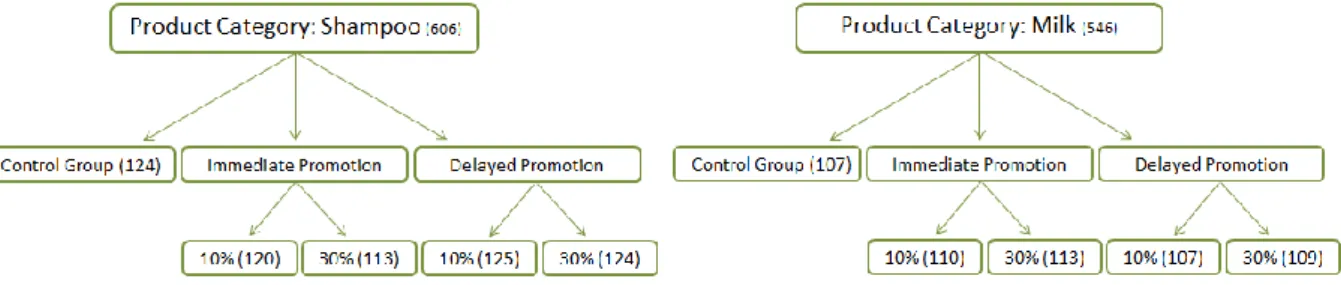
In order to study the proposed research problem five different shopping scenarios were created. There was a control group that was not shown any promotion, and then four different promotions resulting from the possible combinations of two discount levels: low represented by 10% and high represented by 30%; and two promotion types: immediate and delayed. These five different stimuli were applied individually to the shampoo and the milk product categories, in an even and random manner. Neither visual stimulus nor specific brands were used, in order to avoid any bias that the previous may suggest and be able to generalize the results as much as possible. A representation of the survey design, as well as the number of valid answers per condition in parentheses, can be found below in figure 2.
Figure 2: Survey Design
Respondents were asked whether they had bought the two above mentioned product categories in the past 12 months, and only those who answered positively would move on to the respective set of questions. That said, the majority of respondents shared their perceptions for both categories, while some answered only to one of the two, accounting for a total of 606 valid answers in the shampoo category and 546 in the milk one.
In addition, prior to responding to the block of questions that was just mentioned, participants were also requested to answer to four of the questions of the pretest that served as a basis for the definition of the type of immediate and delayed promotion, and high and low discount levels used. The final block of questions comprised only demographic questions.
The full questionnaire in English and Portuguese can be found in appendices 3 and 4, respectively.
3.3.2.3 Measurement
With the aim of measuring PI and CPV deriving from each of the five different scenarios presented above, respondents were presented with 13 different statements taken from previous
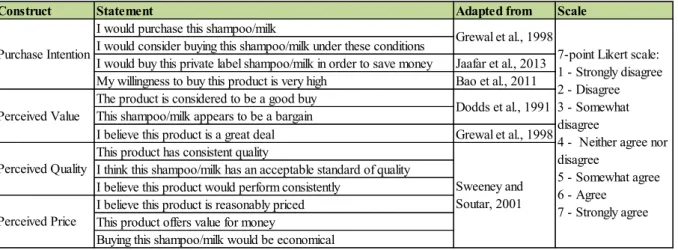
academic articles of renowned authors and asked to rate them on a 7-point Likert scale according to their level of agreement. There were four statements regarding PI that were adapted from the studies of Grewal et al. (1998), Jaafar et al. (2013) and Bao et al. (2011). In what concerns CPV the questionnaire incorporated three direct statements about perceived value adapted from Dodds et al. (1991) and Grewal et al. (1998), and also three statements on perceived quality and another three on perceived price, all adapted from Sweeney and Soutar (2001), since in the literature review section it was established that perceived value could be defined as the ration between perceived quality and perceived price. An overview of the measurement model can be found in table 1 below.
Table 1: Measurement Model
3.2.2.4 Data Analysis
Finally, in order to analyse the quantitative data collected from the online survey the computer program for statistical analysis SPSS was used. On a first stage a data validity process was undergone including the steps of cleaning the data, performing a reliability test on the constructs using Cronbach alpha, and verifying the adequacy of the stimuli used that were based on the pretest results. Simultaneously, descriptive statistics were applied with the objective of characterizing the sample of the study. Afterwards, in order to test the hypotheses presented earlier in the dissertation, a last chapter of inferential statistics was discussed. A series of independent-samples t-tests was conducted as to verify the impact of different promotion scenarios on PI and CPV, by comparing the different means estimated under each condition. Since the five different promotional scenarios were assigned randomly to the participants, the same person did not answer to more than one scenario within the same product category, and for that reason the samples are not the same, which requires an
Construct Statement Adapted from Scale
I would purchase this shampoo/milk
I would consider buying this shampoo/milk under these conditions
I would buy this private label shampoo/milk in order to save money Jaafar et al., 2013 My willingness to buy this product is very high Bao et al., 2011 The product is considered to be a good buy
This shampoo/milk appears to be a bargain
I believe this product is a great deal Grewal et al., 1998 This product has consistent quality
I think this shampoo/milk has an acceptable standard of quality I believe this product would perform consistently
I believe this product is reasonably priced This product offers value for money
Buying this shampoo/milk would be economical
Purchase Intention 7-point Likert scale:
1 - Strongly disagree 2 - Disagree 3 - Somewhat disagree 4 - Neither agree nor disagree 5 - Somewhat agree 6 - Agree 7 - Strongly agree Perceived Value Perceived Quality Perceived Price Grewal et al., 1998 Dodds et al., 1991 Sweeney and Soutar, 2001
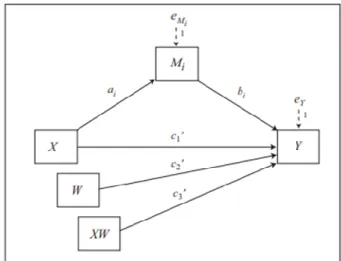
independent-samples test. Afterwards, in order to test a relationship between two metric variables, a Pearson Correlation test was used. Subsequently, to test whether the direct relationship between monetary promotions of PLB and its PI is mediated by CPV and moderated by product category, model 5 from SPSS’s tool PROCESS was ran and analysed. The statistical diagram representing this model is presented below in figure 3. Finally, an additional cluster analysis was conducted with the objective of identifying groups of consumers with distinct demographic characteristics and CPV and PI levels that could help provide more suitable managerial recommendations.
For the purpose of this analysis a confidence level of 95% was applied throughout.
CHAPTER 4: RESULTS
This fourth chapter includes the presentation of the results reached from the analysis of the primary data collected through the online survey. Firstly, it covers a simple characterization of the sample population of the research, followed by an analysis of the reliability of the constructs used in the study. Afterwards, a thorough analysis and testing of the proposed hypotheses is performed alongside the comparison with expectations from the literature.
4.1 Sample Characterization
As previously stated, the analysis was based on a total of 617 valid answers collected. By using descriptive statistics in SPSS, more specifically the frequencies tool, it was possible to characterize the sample population relative to their demographic profile. Respondents were mostly women (71.6%) and the big majority (94.3%) was Portuguese. In what concerns age groups, the sample is quite disperse, with 27.2% of people ranging between 35 and 44, 21.1% belonging to the group 18 to 24, 19.0% corresponding to the 45 to 54 year old group, and 17.7% fitting into the 25 to 34 group. Participants with 55 years old or older represented 9.9% of the sample, and the remaining 5.2% corresponds to the younger segment of respondents with less than 18 years old. Regarding the question where respondents were asked the highest degree they have achieved, the results show that almost half of them (47.3%) completed a bachelor degree, followed by 23.5% of people that finished either a master degree or an MBA, while 19.8% ended their high school education. The remaining 9.4% had either a PhD or did not finish high school. Moving on to the current occupation of participants, it can be said that the vast majority (67.6%) were employed, and another significant part (21.2%) were students. The conditions of student-worker, unemployed and retired had a way lower representativeness. Finally, respondents were also asked their gross monthly income, to which 20.9% mentioned to have no income, 19.1% selected the 1000-1499€ option, and 18.2% chose the previous range 500-999€. Additionally, the income ranges of 1500-1999€ and 2000-2999€ had some representatives as well, with 11.7% and 10.2% of the sample, respectively. 7.9% of respondents chose not to disclose this information.
In appendix 5 the graphic representation of all previous information is available for consultation.
That being said, it is also important to take into consideration that a non-probability sample was used in this research. As a result, the sample cannot be considered representative of the population.
4.2 Constructs Reliability
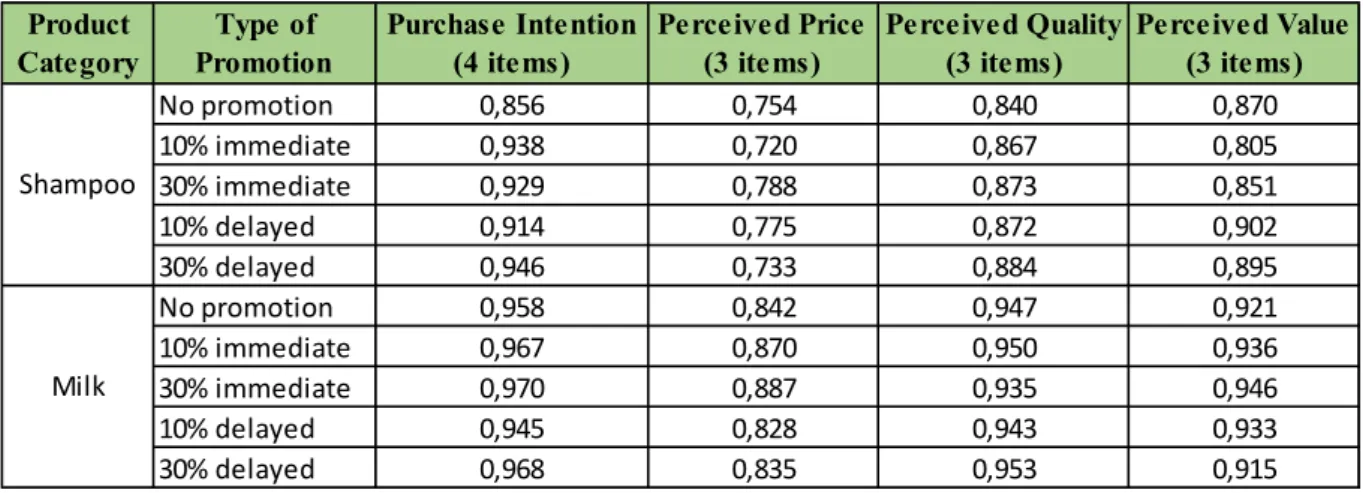
Before moving on to the analysis of the hypotheses of this research, a measure of internal consistency to evaluate the reliability of the constructs used was computed. As such, Cronbach’s Alpha for each of the 4 constructs in each of the 10 different scenarios was analysed for the given sample. In table 2 below, the full Cronbach’s Alpha results are presented.
Table 2: Cronbach’s Alpha
As it can be noted above, values for Cronbach’s Alpha range from 0.720 to 0.970. According to Gliem and Gliem (2003), coefficients higher than 0.9 are considered excellent, between 0.8 and 0.9 are thought to be good, and values ranging from 0.7 to 0.8 are only acceptable. Additionally, the authors also mention that a coefficient of at least 0.8 should be aimed. Based on this information, the constructs of PI, perceived quality and CPV are quite reliable, since the three of them have a Cronbach’s Alpha higher than 0.8 in all scenarios. However, perceived price in the shampoo category do not present coefficients high enough to reach the 0.8 threshold. After analysing these particular results it is possible to conclude that the Cronbach’s Alpha cannot be improved to an acceptable value by removing one of the items of the construct. That being said, and given the fact that perceived price was only an indirect measure in this study to reach a measure of perceived value through the relationship with perceived quality, it will be removed from the analysis. This way it is no longer necessary to use the perceived quality construct either, and the entire analysis from here on is exclusively based on the results of the perceived value construct alone, which is considered to be very reliable with coefficients close to 0.9.
No promotion 0,856 0,754 0,840 0,870 10% immediate 0,938 0,720 0,867 0,805 30% immediate 0,929 0,788 0,873 0,851 10% delayed 0,914 0,775 0,872 0,902 30% delayed 0,946 0,733 0,884 0,895 No promotion 0,958 0,842 0,947 0,921 10% immediate 0,967 0,870 0,950 0,936 30% immediate 0,970 0,887 0,935 0,946 10% delayed 0,945 0,828 0,943 0,933 30% delayed 0,968 0,835 0,953 0,915 Shampoo Perceived Value (3 items) Milk Product Category Type of Promotion Purchase Intention (4 items) Perceived Price (3 items) Perceived Quality (3 items)
To sum up, all items used to measure PI and CPV were maintained in the analysis, since both constructs are reliable. Perceived price and perceived quality were no longer addressed.
4.3 Pretest Results Check
In the main survey, the same questions of the pretest were repeated as to verify whether the same results were achieved or not, as an indication of a correct choice of the stimuli. In order to do so, frequencies and descriptives in SPSS were used to analyse the appropriate immediate and delayed promotion as well as the two layers of discount levels, respectively. It can be concluded that 87.7% of respondents said that a price discount is the promotion that best represents in real life an immediate promotion, which was the same result achieved in the pretest. As for the delayed promotion, once again the results were not very straight forward, with three of the options reaching each around 23% of the answers, namely cash back, a coupon that can only be used at a specific future date and a price discount that is saved in the retailer’s loyalty card to use only in the next purchase. The latter, which was the type of delayed promotion used in the main study, seems therefore an appropriate stimulus. Nevertheless, since two other delayed promotions had a very high percentage as well, it could have been a good option to include all three in the main survey in an evenly randomized manner, in order to reach results closer to reality. It is however also important to notice that by doing so the complexity would have increased considerably since for each product category, instead of five different scenarios, it would have had nine.
Regarding the discount levels, all respondents that answered the shampoo and/or the milk part were also asked which percentages of discount they considered to be low or “bad” and high or “good”, for each product category. Analysing the means of the two categories it can be concluded that a low discount is 12.5% for shampoo and 11.1% for milk; whereas a high discount is 38.5% for a shampoo and 32.2% for milk. It can be noted that customers are used to higher discounts in the shampoo category compared to the milk one. Abstracting from categories and combining the results, respondents consider a low discount a value around 11.9% and a high discount a value close to 35.5%. Considering that the actual stimuli used in the main survey were 10% for a low discount and 30% for a high discount, the results do not differ a lot. In fact, transforming the results into rounder numbers that are found in real life when grocery shopping, 11.9% would be a 10% discount and 35.5% would be a 35% discount. That being said, the same results were achieved for a low discount, while the high
No promotion 4,1505 1,2839 10% immediate 3,9778 1,2589 30% immediate 4,3274 1,3400 10% delayed 3,9040 1,5708 30% delayed 4,0941 1,5626 No promotion 4,7040 1,4460 10% immediate 4,3727 1,6668 30% immediate 5,0885 1,48472 10% delayed 4,3956 1,6427 30% delayed 4,6758 1,5163 Type of Promotion Mean CPV Standard Deviation Shampoo Milk Product Category No promotion 3,6552 1,4298 10% immediate 3,4917 1,5983 30% immediate 3,9358 1,6760 10% delayed 3,4880 1,6622 30% delayed 3,4073 1,8278 No promotion 4,3692 1,7888 10% immediate 4,0545 1,9935 30% immediate 4,7611 1,8512 10% delayed 4,1893 1,8063 30% delayed 4,3555 1,8485 Shampoo Milk Product Category Type of Promotion Mean PI Standard Deviation
promotion percentage was underestimated by 5ppt, but since it was based on the outcome of a pretest study its use is justified.
4.4 Results from the Hypotheses Testing
Primarily, a simple descriptive analysis was conducted in order to compute the means and standard deviations of the two constructs discussed in this research for each one of the ten different scenarios proposed. On a first stage, two new variables were created that represented PI and CPV. The first is the average of the results attributed to the four PI items, and the second is the average of the results attributed to the three CPV items, from the 1 to 7 Likert-scale. Afterwards, descriptive statistics were applied to those two new variables, for each different scenario, and the results are showed in tables 3 and 4 below.
Table 3: Purchase Intention Means Table 4: Customer Perceived Value Means By observing these results there are already a few conclusions that can be drawn. On the one hand, as it would be predictable by the information about market shares of the two product categories present in the literature review, on average, PI and CPV for PLB of milk are higher than for PLB of shampoo. An independent-samples t-test presented below can actually prove that the difference in PI between the two product categories is indeed statistically significant, representing shampoo a lower PI (Mean(M)=3.5899) than milk (M=4.3489). Interpreting the results from table 5 it can be said that for a 5% significance level the null hypothesis of equal means is rejected (t(1093)=-7.277; p=0.000), therefore confirming the above mentioned statement.