a
o
Original Article
In search of weight loss – a four-country survey on what people
were doing for losing weight at the turn of the century
À procura do peso perdido – estudo do que fazem os habitantes de quatro países
ao virar do século
Osvaldo Santos1, Guy Sermeus2, Isabel do Carmo3, Marco Anelli4, Peter Kupers2, Eduardo Martin5 1Observatório Nacional da Obesidade e do Controlo do Peso; DECO PrOTESTE (Portugal)
2Association des Consommateurs Test-Achats / Verbruikersunie Test-Aankoop (Belgium) 3Faculdade de Medicina de Lisboa (Portugal)
4ALTrOCONSUMO (Italy)
5OCU Ediciones (Organización de Consumidores y Usuarios) (Spain)
Abstract
Purpose. Overweight is one of the most prevalent public health pro-blems of developed countries, implying complex and multi-approach community and individual preventive actions. Although this is a well known and documented issue in Belgium, Italy, Portugal and Spain, little is known on individual slimming behavior, including pathogenic behavior. This study, promoted and conducted by the main consumer association of each of the four indicated countries at the turn of this century, had as main goal to collect 18-74 years old adult population-representative data regarding weight-control (i.e., maintaining weight status or slimming) behavior.
Methods. A population-based representative mail survey using a self-administered standardized questionnaire on life-styles and slim-ming behavior was conducted in three South-European countries (Italy, Portugal and Spain) and in one Central-European country (Bel-gium). The questionnaire addressed indicators of life-style, including questions about weight-control behavior.
Results. A total of 8509 adult people (between 18 and 74 years old) persons answered the questionnaire. For each person, Quetelet’s index of body mass (BMI) was calculated from self-reported weight and height. In all countries, men had significantly higher BMI means and were more affected by overweight (including obesity) than women. For the overall sample, 39% of people felt in the overweight category (10% of these with obesity). On the other hand, self-reported worry and dissatisfaction with body weight, size, shape, weight and look, as well as prevalence of weight-control behavior were more prevalent in women than in men. Trying to reduce weight without any expert advice was reported by 52,2% of overweight people and by 31,5% of obese people. Those who looked for professional help opted mainly by medical doctors and nutrition experts (prevalence of psychological interventions were marginal). In every country, diet regimen, specific slimming method/program, and other life-style changes (e.g., stop drinking alcohol, increasing physical activity) were the most prevalent ways of controlling weight. More than 25% of respondents reported to have gained back the lost weight and in 12.2% of cases, people arrived to higher values of weight than before starting the slimming attempt.
Conclusions. Collected data point out to high prevalence of wei-ght-control behavior without specialized counseling/support. These results suggests the need to implement continuous prevention progra-ms, enhancing the accessibility to overweight-related health care (in terms of information and reduction of costs and waiting-lists). Such community-level prevention programs should, ultimately, aim to pro-mote individual autonomous motivation to look for specialized help for the individual adoption of healthy weight promoting life-styles.
Keywords. Overweight; Pre-obesity; Obesity; Body-weight con-trol; Survey.
Resumo
Objectivo. O excesso de peso é dos problemas de saúde pública mais
prevalen-tes e de resolução mais complexa (quer a nível público quer a nível individual) em países desenvolvidos. Apesar de ser um problema de saúde pública bem conhecido na Bélgica, Itália, Portugal e Espanha, existe pouca informação sobre os comportamentos que as pessoas adoptam para redução ou controlo do peso, incluindo comportamentos potencialmente patogénicos. Este estudo, financiado e realizado pela principal associação de consumidores dos quatro países acima referidos, teve por objectivo recolher dados representativos das respectivas populações (adultos entre os 18 e os 74 anos) sobre comportamen-tos de controlo (ou seja, de manutenção ou de redução) do peso.
Métodos. Inquérito de base populacional com recolha de dados através de questionários autoadministrados em três países da Europa do Sul (Itália, Por-tugal e Espanha) e num país da Europa Central (Bélgica). O questionário, enviado por correio a uma amostra representativa das populações em estudo, proporcional por género, grupos etários quinquenais, e distribuição geográfica (NUTS II), incluía indicadores de estilos de vida, incluindo comportamentos de controlo do peso.
Resultados. No total, responderam ao questionário 8509 adultos entre 18 e 74 anos de idade. O índice de massa corporal (IMC) foi calculado com base no auto-relato do peso e da altura. Em todos os países, os homens asentaram um IMC significativamente mais elevado que as mulheres, e a pre-valência de excesso de peso (incluindo obesidade) era significativamente maior nos homens do que nas mulheres. Ao todo, 39% dos inquiridos apresentavam excesso de peso (10% destes com obesidade). Por outro lado, a preocupação e insatisfação com o peso, tamanho, forma, e aspecto do corpo bem como a pre-valência de comportamentos de controlo do peso eram mais prevalentes entre mulheres do que entre homens. A tentativa de controlo do peso sem consulta de profissionais de saúde foi relatada por 52,2% dos inquiridos com excesso de peso e por 31,5% das pessoas com obesidade. A maioria dos que procuraram ajuda profissional optou por especialidades médicas e da nutrição (a prevalên-cia de procura de intervenções psicológicas era marginal). Em todos os países, as formas mais prevalentes de controlo do peso passavam por programas/ métodos específicos de emagrecimento e outras mudanças de estilo de vida (por exemplo, deixar de beber álcool e aumentar a actividade física). Mais de 25% dos inquiridos indicaram ter recuperado o peso perdido após o termo da intervenção, e 12.2% relataram ter até aumentado para valores de peso corporal superiores ao que tinham antes do tratamento.
Conclusões. Os dados recolhidos neste estudo apontam para uma preva-lência elevada de tentativas de controlo de peso sem aconselhamento espe-cializado. Continua a existir pouca evidência de como intervir em contexto comunitário de forma a aumentar a efectividade no controlo da prevalência da obesidade. Mas estes resultados sugerem a necessidade da continuidade na implementação de programas de prevenção, que apostem na promoção de mais acessibilidade a cuidados de saúde na área da obesidade (em termos de informação, e de redução de custos e tempos de espera), de modo a que os grupos populacionais em maior risco de excesso de peso possam, de forma au-tonomamente motivada, procurar ajuda especializada na adopção de estilos de vida promotores de manutenção de peso corporal saudável.
Palavras Chave. Excesso de peso; Pré-obesidade; Obesidade; Controlo do peso corporal; Inquérito.
T
he quest for losing weight is well illustrated by the famous Erma Bombeck quote “I’ve been on a constant diet for the last two decades. I’ve lost a total of 789 pounds”.It is well known that even a small weight loss does have health beneficial effect. On the other hand, overweight is usually perceived as undesired by most people and there is a common psychological need to reduce weight (although difficult to main-tain, as a behavior). As a “symptomatic” answer to the high prevalence of overweight (including obesi-ty), there are hundreds of different methods for re-ducing weight. And not only people who are really overweight search for getting slimmer: this goal is also pursued by non-overweight people, sometimes within the context of fashion pressure and of aesthe-tic goals, sometimes within the context of psycholo-gical dysfunction. Already in the decade of 1980s, research pointed out that 61 to 89% of women tried,
at least once in their lives, to diet.1
But even if the social and economical impact of this “slimming-offer market” is easily recognized, very little is known about it. In Belgium, Italy, Portu-gal and Spain, it is hard to find statistical data on what people do for reducing weight. The present study, financed and conducted by four consumer associa-tions (DecoProteste, from Portugal, Test-Aankoop, from Belgium, Altroconsumo, from Italy, and Orga-nización de Consumidores y Usuarios, from Spain), aimed to contribute for this kind of knowledge for three Mediterranean countries (Italy, Portugal and Spain) and one Central Europe country (Belgium). The main goal of this research project was to gather national-based information on different dimensions regarding reported body weight and body self-image as well as regarding slimming behavior. METHODS
This is an observational sectional and cross-national randomized survey. Data collection was done from October till November of 2001. For each country (Belgium, Italy, Portugal and Spain), 20.000 questionnaires were sent to a representative adult (18 to 74 years old) sample, proportionally stratified by gender, age and geographical regions (NUTS II) using mail-out and mail-back metho-ds. Address files were bought from a commercially available mailing list. Each of the potential
respon-dents received at home (by postal mail) one ques-tionnaire, together with an introduction letter and a pre-paid return addressed envelope. The received questionnaires were anonymous and, therefore, no reminder has been sent to non-repliers.
Deviations between the sample and the general population of each country (in terms of gender, age and living area) have been taken into account. This
a posteriori control was done through direct
stan-dardization. That way, it became possible to derive representative estimates for the general population
in each country.2
SuRvEy INSTRuMENT
The survey instrument was entitled “Life-Style,
Ea-ting habits & Health” and included some previously
developed scales measuring, such as SF-36 Health
Survey,3 for measuring generic health-related
qua-lity of life, the Baecke Questionnaire of Habitual
Physical Activity,4 assessing daily physical activity
in work, leisure and occupational activities, and the
Dutch Eating Behavior Questionnaire (DEBQ)5
for assessment of restrained, emotional, and exter-nal eating behavior. The instrument also addressed beliefs regarding overweight and obesity and their effects on health, self-reported weight and height in-dicators, satisfaction with different body-related as-pects (e.g., size, shape, “fat” zones), attitudes related to weight control, motivational factors for weight reducing/control, recent slimming behavior (in-cluding reasons for doing so, chosen methods and type of experts), and satisfaction issues regarding the slimming methods. Finally, demographic items included gender, age, educational level, civil status, professional activity and zip code of living area. Each questionnaire was accompanied by a 2-me-tre tape plasticized-paper measure (for measuring waists and hips), specifically created and replicated for this survey.
Questions were assessed on comprehensibility and coherence through a previous trial survey on 100 persons. After this pilot test, an English version has been elaborated, translated and adapted to every country involved in the study.
All statistical analyses were operated on SPSS 15. Analyses were made on both international and national bases. As stated before, weighting coeffi-cients have been calculated to maximize the
repre-sentativeness of data. Gender, age and geographical distributions have been used as combined variables to standardize the sample of each country. Whene-ver statistical tests have been applied, the conside-red level of significance was a = 0.01.
RESuLTS
For statistical analysis, the age of respondents was grouped in six categories. When pooling the data from all the countries altogether, the modal interval of ages was 35 to 44 years old (Table 1). Only for Portuguese and Spanish women, the modal interval of ages was between 25 and 34 years old. Most part of respondents are married or living together with a partner, and most of them have at least the seconda-ry level of education.
Body mass index (BMI) was calculated (using
self-reported data) through Quetelet’s formula:6 BMI
= weight/height.2 The BMI cut-offs for
overwei-ght and obesity categories were the ones proposed
by the WHO:7,8 for BMI, low weight <18.5; normal
weight 18.5–24.9; overweight 25.0–29.9; obesity I 30.0–34.9; obesity II 35.0–39.9 and obesity III ≥40. For better controlling the accuracy of the answers regarding weight, respondents were asked to indica-te “How accurate would you say your answer is?”, with
three possibilities of answer (“1 = it is my exact
wei-ght”; “2 = it is a close approximation”; “3 = it is an in-dicative estimation only”). Only people who answered
options 1 or 2 were considered for analyses related with weight. As indicated in Table 2, more than 30% of respondents reported weights and heights that lo-cate them in overweight body mass index values. And around 10% (overall sample) came out as obese.
Significant differences were found between
gender and self-reported body mass values (
p-values<0.0001). For every country, men had
signi-ficant higher body mass values (for the total sam-ple, M=25.14; n=3947) than women (M=23.70; n=4783). In every country, men were more affec-ted by overweight than women (47.1% and 31.9%, respectively, for the complete sample; p<0.0001).
Significant and moderated correlation (rp=0,34; p <
0.0001) has been found between age and body mass values. This same level of correlation was found
when analyzing within each gender (rp=0,32 for
women and rp=0,35 for men). Significant
differen-ces regarding average body mass values (F<0.0001) have also been found between countries: Belgium and Italy (no significant difference found between these two countries) differ significantly from Portu-gal. Spain is the country with significant higher BMI
TaBLE 1. Characteristics of study participants by country and gender groups
Age (years) Civil status Education(1) 18 – 24 25 – 34 35 – 44 45 – 54 55 – 64 ≥ 65 Single Married/living together Divorced/living separate Widow/er Primary Secondary University Men (n=961) 16.6 21.7 18.9 18.1 14.1 10.7 36.4 49.5 10.0 4.1 4.6 53.7 41.7 Women (n=1606) 16.9 21.1 25.3 19.5 12.8 4.4 22.5 65.6 7.4 4.5 4.9 51.0 44.1 belgium (n=2591), % (n=1062), %Italy Men (n=586) 2.4 9.5 24.7 19.9 24.1 19.4 11.2 82.7 3.8 2.2 8.9 71.4 19.7 Women (n=432) 8.7 18.8 27.2 17.6 17.6 10.1 23.1 61.6 5.9 9.4 11.8 69.4 18.8 Men (n=569) 4.1 21.6 22.5 21.9 17.9 12.0 8.8 85.6 3.4 2.2 20.1 45.8 34.1 Women (n=708) 8.7 31.9 22.0 15.7 9.1 12.6 22.2 52.8 12.9 12.1 19.1 40.9 39.9 Men (n=1617) 4.9 12.8 24.8 18.9 20.6 17.9 15.1 80.2 2.8 1.8 30.1 39.0 31.0 Women (n=1794) 14.9 29.7 28.9 14.1 7.6 4.9 32.2 56.5 7.3 4.0 26.1 36.0 38.0 Portugal (n=1313) , % (n=3543) , %Spain unweighted data
1“Low level” includes: enseignement primaire (terminé ou non), enseignement secondaire inférieur professionnel, enseignement secondaire inférieur technique, enseignement
secondaire inférieur général, for Belgium; nessun titolo, lecenza elementare, licenza di scuola media inferiore (o licenza di avviamento professionale), for Italy; until 9th year of school, for Portugal; no tiengo estudios terminados, estudios primarios/EGB/2ª ESO, 4º EOS/BUP, for Spain.
“Medium level” includes: enseignement secondaire supérieur professionnel, enseignement secondaire supérieur technique, enseignement secondaire supérieur général, for Belgium; licenza di scuola media superiore, for Italy; having more than the 9th year of school and until the 12th, for Portugal; formación profesional grado medio, bachillerato (LOGSE)/COU, formación profesional grado superior, for Spain.
“High level” includes: enseignement supérieur non universitaire, enseignement universitaire (ou équivalent), for Belgium; diploma universitario, laurea, for Italy; having more than the 12th year of school, for Portugal; universitarios nivel diplomado, universitarios nivel licenciado, posgraduado o doctorado, for Spain.
TaBLE 2. Distributions of self-reported BMI and body shape by country and gender groups*
belgium Portugal Spain
unweighted data
*Only respondents who answered that their indication of weight was “accurate” or a “close approximation of the real weight” have been considered for analyses related with people’s weight. (n) Underweight (%) Normal weight (%) Pre-obesity (%) Obesity (%) Mean (BMI: kg/m2) Median (BMI: kg/m2) Std. Deviation (BMI: kg/m2) Women 1563 9,3 60,6 19,9 10,2 23,47 22,41 4,68 Men 934 3,4 58,5 28,9 9,2 24,40 24,01 3,97 All 2517 6,9 59,8 23,4 9,8 23,84 23,14 4,43 Italy Women 420 10,7 64,4 18,0 7,0 23,13 22,48 4,45 Men 561 4,5 48,6 40,2 6,7 24,84 24,77 3,69 All 1023 7,6 56,4 29,2 6,8 24,00 23,60 4,18 Women 675 5,4 61,1 24,7 8,8 23,64 22,94 4,20 Men 551 1,1 48,4 41,0 9,6 25,37 25,00 3,70 All 1250 3,2 54,6 32,9 9,3 24,51 24,16 4,04 Women 1707 5,4 58,7 25,0 10,8 24,21 23,23 5,12 Men 1533 1,2 44,7 42,4 11,7 25,81 25,34 3,91 All 3348 3,3 51,6 33,5 11,6 25,05 24,51 4,64 mean.
Participants were asked on how they felt
regard-ing their own weight (“Currently, how do you feel
regarding your own weight?”, with the following
op-tions of answer: “I weigh less than I should”, “I have a
normal weight”, “I weight slightly more than I should”,
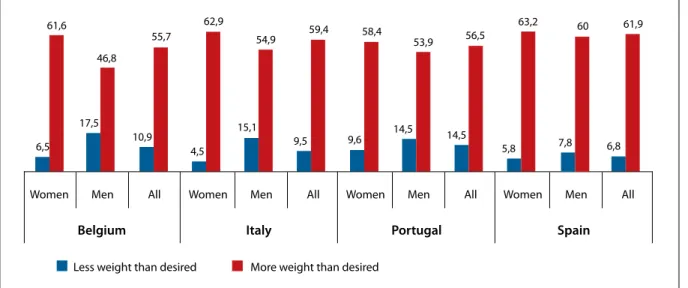
and “I weight more than I should”). In every country,
about 60% of women considered to weight more than they would want to (Figure 1). For every coun-try, significantly lower figures were found for men (p<0,0001).
Significant association was found between this individual perception of body weight and the
self-reported body mass index (χ2=5864,0; n=9099).
When considering all countries together, and based on the self-reported values for weight and height, 9,5% of underweight woman reported to feel as weighting more than they should (and 51,8% of those within the normal body mass index
cate-gory indicated to feel as weighing more than they should). Among men, 29.6% of underweight or nor-mal participants reported to feel as weighting more than they should. On the other hand, 27.1% of pre-obese/obese men and 18.4% of pre-pre-obese/obese women indicated to feel as having an adequate or less-than-adequate weight.
As can be seen in Table 3, the perceived body distribution of fatness was quite different between women and men. Women referred more frequen-tly to have overweight in the “bottom part” of the body (hips, buttocks, thighs, legs); men indicated more often their “upper part” of the body as being fatter (specially the stomach). It is also relevant that
much more men indicated “none” as an answer to
the question of which part of the body is fatter than it should be (men body self-image was not indicated as a problem for 27,6% of male in the sample). This same conclusion comes out when analyzing the
re-FIGurE 1. Perception of body weight status by country and gender (weighted data).
Women Men All Women Men All Women Men All Women Men All
belgium Italy Portugal Spain
6,5 61,6 17,5 46,8 10,9 55,7 4,5 62,9 15,1 54,9 9,5 9,6 59,4 14,5 53,9 58,4 56,5 63,2 60 61,9 14,5 5,8 7,8 6,8
ported satisfaction (on a 1 to 10 point scale) with the body in terms of “size”, “shape”, “weight” and
“overall appeal”. In fact, significant differences (
p-values<0,0001) where found when comparing
be-tween gender regarding “body self-appreciations”: men being more satisfied (total sample) with size (M= 7.07), shape (M=6.48), weight (M=6.12) and look (M=6.84) than women (6.15, 5.75, 5.50 and 6.33 respectively).
Trying to reduce weight …
In every country, a high percentage of respondents acknowledged that slimming is a difficult process (Figure 2) and a relevant percentage (16% for Bel-gium, around 14% for Italy and Spain, and 11,2% for Portugal) indicated that diets can have a delete-rious effect in weight control. Among people with overweight (including obesity), these figures are even higher (p-values < 0.0001).
As can be seen in Table 4, the percentage of res-pondents who indicated to have already tried to maintain or to reduce weight ranged between 62,7 (in Portugal) and 70,9% (in Spain). Differences
between men and women can be seen across all countries regarding weight reducing/control (p-values<0,0001).
Women tend to try to reduce/control weight more often than men do. For the overall sample, all countries altogether, 76.9% of women and 55.3% of men reported to have already tried to control their weight (p<0.0001).
In every country, the association between the prevalence of slimming behavior was significantly associated with age (p-values<0,0001). As shown in Figure 3, in Belgium and Italy, the prevalence of people who attempted to reduce or to maintain wei-ght increased with age until around 50 years old. In Spain, the highest prevalence of slimming behavior was found in the 25-34 years old category. And Por-tugal was the country with more fluctuating preva-lence across adult ages, having its mode in the 55-65 age category.
When asked about the motives for trying to duce (or to maintain) weight, most frequently
re-ported issues were “for feeling better with myself” and
“due to medical advice” (Table 5).
TaBLE 3. Dissatisfaction with body shape
belgium (n=2591), % (n=1313), % Portugal (n=3543), % Spain unweighted data None Face/cheeks Breast Arms Belly/stomach Waist Hips Buttocks Thighs Legs Other
… size of your body? … shape of your body … your weight? … the way your body looks like Women (62,6%) 10,7 5,6 11,7 11,4 52,7 22,1 42,6 46,8 46,9 18,9 2,0 Men (34,7%) 36,0 6,7 7,1 2,2 51,6 11,1 8,5 12,0 10,2 6,7 2,3 All 20,8 6,0 9,9 7,8 54,9 17,7 29,0 33,0 32,3 14,0 2,2 Italy (n=1062), % Women (42,4%) 13,6 6,0 6,9 11,8 59,3 30,3 35,7 22,0 31,7 12,3 2,2 Men (57,6%) 24,8 7,6 4,9 1,0 55,2 21,9 15,8 4,8 6,5 1,7 1,0 All 19,0 6,7 5,8 6,4 57,6 25,8 25,8 13,4 19,3 7,0 1,5 Women (55,4%) 16,7 6,3 15,4 10,3 60,5 30,0 38,6 29,5 32,9 14,2 1,8 Men (55,4%) 25,1 11,9 9,5 2,2 60,5 26,2 5,8 4,5 7,2 50,0 0,9 All 20,7 9,1 12,5 6,6 60,1 28,0 22,9 17,4 20,3 9,7 1,4 Women (52,6%) 10,8 8,0 17,2 15,9 60,4 26,4 36,3 36,0 36,1 15,8 1,0 Men (47,4%) 21,7 9,0 7,0 1,2 65,4 23,1 6,8 7,7 10,4 5,3 0,9 All 1 6,1 8,5 12,2 8,7 62,8 24,7 21,9 22,1 23,3 10,7 1,0
“Which parts of your body do you consider as ‘fat’?”
Mean (S.D.) 6.23 (2.30) 5.39 (2.47) 5.68 (2.65) 6.63 (2.19) Mean (S.D.) 6.10 (2.41) 5.86 (2.27) 5.56 (2.73) 6.28 (2.09) Mean (S.D.) 7.16 (2.20) 6.56 (2.21) 6.39 (2.58) 6.91 (2.06)
“How satisfied are you regarding… (10-point scale from 1 = ‘very unhappy’ to 10 = ‘very happy’)”
Mean (S.D.) 6.52 (2.38) 6.14 (2.27) 5.89 (2.70) 6.53 (2.10) Mean (S.D.) 7.18 (2.02) 6.24 (2.20) 6.12 (2.37) 6.96 (1.86) Mean (S.D.) 6.71 (2.20) 5.82 (2.36) 5.89 (2.51) 6.80 (2.03) Mean (S.D.) 6.27 (2.48) 5.35 (2.54) 5.44 (2.89) 6.40 (2.26) Mean (S.D.) 7.32 (2.28) 6.17 (2.31) 5.95 (2.70) 6.90 (2.12) Mean (S.D.) 6.75 (2.45) 5.74 (2.48) 5.68 (2.81) 6.62 (2.23) Mean (S.D.) 6.14 (2.33) 5.85 (2.25) 5.37 (2.60) 6.27 (2.16) Mean (S.D.) 6.87 (2.27) 6.60 (2.19) 5.92 (2.52) 6.71 (2.10) Mean (S.D.) 6.50 (2.32) 6.22 (2.26) 5.64 (2.58) 6.49 (2.15)
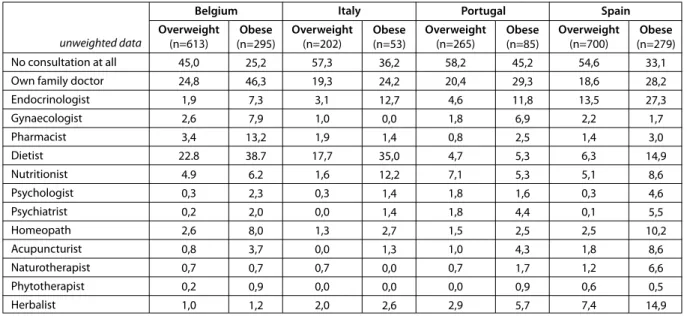
Respondents who indicated to have tried a slim-ming process were also asked to indicate the kind/ type of specialists they consulted for this purpo-se. As shown in Table 6, a relevant percentage of pre-obese and obese respondents reported trying to get slimmer without the help from any health professional. Medical doctors (mainly family phy-sicians) were the most consulted health professio-nals. Psychological interventions were searched by a marginal percentage (except by obese respondents in Portugal and Spain).
And, as can be seen in Table 7, most frequently reported types of slimming strategies – across coun-tries – were: diet regimens, life-style changes, follo-wing/taking a specific slimming product/method (Herbalife, Svensons products,...), taking meal
repla-cement products, taking medical drugs, taking her-balist products, and drinking slimming teas. Among diet regimens, most frequently reported types were: hypocaloric diets (28% for Belgium, 13,8% for Italy, 10,6% for Portugal, and 22,1% for Spain), dissocia-ted diets (12,4 for Belgium, 7,1% for Italy, 10,8% for
TaBLE 4. Trying to reduce or to control weight by country and gender groups
belgium
(n=2591), % (n=1313), % Portugal (n=3543), % Spain
unweighted data
Currently trying (for the first time) Currently trying (for the second time) Currently trying (for the “n” time)
Not trying for the moment (tried once in the past) Not trying for the moment (tried several times in the past) Never tried Women (62,6%) 15.2 13.7 26.7 8.6 13.7 22.2 Me (34,7%) 11.4 9.9 11.0 8.3 9.0 50.4 All 13.7 12.2 20.5 8.4 11.9 33.2 Italy (n=1062), % Women (42,4%) 20.4 8.0 22.9 10.6 13.4 24.6 Men (57,6%) 14.9 8.4 16.2 10.1 4.9 45.4 All 17.8 8.5 20.2 10.4 9.2 33.8 Women (55,4%) 14.3 8.0 20.5 14.3 12.6 30.3 Men (55,4%) 11.4 7.0 11.4 16.2 8.6 45.4 All 13.1 7.5 16.4 14.9 10.8 37.3 Women (52,6%) 11.5 7.8 28.9 12.7 18.3 20.9 Men (47,4%) 13.3 8.1 15.9 13.3 10.8 38.7 All 12.3 8.1 22.9 12.9 14.6 29.1
People who follow a diet aggarvate their sitiation Diets and physical exercise are a waist of time Dieting is extremely difficult People who follow a diet aggarvate their sitiation
Diets and physical exercise are a waist of time Dieting is extremely difficult People who follow a diet aggarvate their sitiation
Diets and physical exercise are a waist of time Dieting is extremely difficult People who follow a diet aggarvate their sitiation
Diets and physical exercise are a waist of time Dieting is extremely difficult
belg ium Italy Por tugal Spain 21,4 16,1 61,8 52,0 61,1 53,3 15,0 14,1 51,6 42,7 55,6 52,4 17,1 13,7 49,8 34,0 63,8 56,4 14,4 11,2 53,1 35,9 78,9 70,9
Overweight All included
TaBLE 5. Reasons for trying to reduce weight* belgium (n=1635), % (n=1313), % Portugal (n=3543), % Spain unweighted data Medical advice Advice/insistence of partner Advice/insistence of other relative For improving social life For improving professional life For a special event For a special season (e.g., summer) For feeling better with myself For other reason
Women (n=1587) 18.9 9.4 8.3 9.1 2.9 16.1 20.4 86.5 7.2 Men (n=632) 26.1 11.8 8.5 10.2 4.5 7.1 14.9 71.1 7.9 All 21,0 10,2 8,3 9,5 3,3 13,6 18,9 82,0 7,3 Italy (n=1062), % Women (n=329) 23.1 5.4 3.1 6.3 0.8 1.7 8.3 84.4 4.8 Men (n=224) 28.7 14.4 2.5 5.1 2.0 3.3 8.1 77.8 4.4 All 25,1 9,0 2,7 5,9 1,4 2,6 8,2 81,1 4,8 Women (n=394) 22.9 7.4 6.3 6.8 3.7 6.5 9.4 83.0 6.1 Men (n=278) 33.8 9.7 16.3 11.7 4.2 1.1 7.8 77.1 7.8 All 27,3 8,2 10,3 8,7 3,8 4,4 8,7 80,6 6,6 Women (n=1133) 23.6 4.6 6.9 12.6 5.0 13.5 20.5 83.2 8.3 Men (n=813) 28.6 13.0 4.1 11.0 4.4 5.1 13.3 75.0 10.8 All 26,1 8,1 5,6 11,9 5,0 10,0 17,4 79,4 9,4 * Figures are relative to the group of people who ever tried (or are currently trying) to reduce/control weight.
60,0 55,0 50,0 45,0 40,0 35,0 30,0 25,0 20,0
Less than 20 20–24 25–34 35–54 45–54 55–65 More than 65
Belgium Italy Portugal Spain
FIGurE 3. Prevalence of respondents currently reducing weight, by age categories (weighted data).
Portugal, and 9,9% for Spain), and stopping to drink alcohol (8,2% for Belgium, 5,6% for Italy, 9,0% for Portugal, and 9,1% for Spain).
From the overall sample (i.e., all countries al-together), 2327 respondents said to have already tried and stopped a slimming treatment/regimen/ method. These same people were asked about the reasons for doing so. Table 8 indicates the main re-ported reasons. As can be seen, only 15% of respon-dents stopped the process of getting slimmer after achieving their intended goal. Negligence/careless-ness and busy professional life styles were the most
frequently reported factors of slimming dropouts. For the total sample, 15,2% of people who dropped a slimming method referred to what may be consi-dered “side-effects” of the attempt (feeling too an-xious, too depressed, too irritated, ...).
Respondents were also asked about what happe-ned regarding their weight, after quitting a slimming treatment/regimen/method. Table 9 summarizes
the incidences of post-slimming-trials results for the
overall sample of people who ever tried and stopped such a slimming process. Almost 27% of people who tried and stopped a slimming method reported to
have gained the lost weight back. And 24.4% even gained more weight than before the attempt. These values express 61.2% of failure in slimming trials. DISCuSSION
Overweight (including obesity) is often referred to as a behavioral disease and a by-product of a so-called modern civilization lifestyle. Its implications regarding health are nowadays so evident that it is mandatory that a relevant percentage of people should get professional help for controlling and (if necessary) reducing weight. Not just “curative” help, but (mainly) preventive help in terms of adoption of adequate lifestyles.
Weight loss decisions are extremely complex and fragile, depending on triggers to action such as embarrassment and humiliation, health, fear, critical events and image, and some disincentives to action
have been identified9: denial, previous bad
expe-riences, previous failure and money. Considering all these variables and the fact that ill-informed slim-ming attempts may constitute a health threat, any slimming attempt should be seen as an important life-event. Due to the lack of knowledge, especially for the four countries that participated in this survey (Belgium, Italy, Portugal and Spain), there is a clear need to draw a picture of what people really do for getting slimmer. In fact, gathering such information is a first step for enabling effective preventive actions regarding this health problem.
The here reported national-based postal surveys
aimed to provide more information regarding how people from each country were dealing with body weight related issues at the turn of this century. One of the main conclusions is that, although overwei-ght prevalence differ between countries, most fre-quently reported strategies for losing weight were, at that moment, quite similar (diet regimen, life-sty-le change, following a slimming method/program, meal replacement, and use of medical drugs). This is an interesting finding since the opposite was con-cluded from another contemporaneous European
Union survey.10 In that study, it was concluded that
weight loss practices differ between EU countries. When comparing the self-reported BMI values with prevalence coming from more accurate epide-miological methodologies (with hetero-objective measurements), it could be concluded that women tended to under-report (through self-administered questionnaires) their real weight. Men answers ten-ded to be less deviant from the real national
preva-lence.11,12
Across most part of body mass categories, wo-men and wo-men differed regarding the way they per-ceive their own body: women tended to feel “fatter” than their reported weight and height indicate. In the opposite direction, men tended to feel “slim-mer” than what their reported weight and height indicated. This difference between clinical criteria on what is overweight and the individual self-appre-ciation regarding being overweight was also found when investigating the extent to which people who
TaBLE 6. Consulted specialists for getting slimmer by country and BMI category groups
belgium Portugal Spain
unweighted data
No consultation at all Own family doctor Endocrinologist Gynaecologist Pharmacist Dietist Nutritionist Psychologist Psychiatrist Homeopath Acupuncturist Naturotherapist Phytotherapist Herbalist Overweight (n=613) 45,0 24,8 1,9 2,6 3,4 22.8 4.9 0,3 0,2 2,6 0,8 0,7 0,2 1,0 Obese (n=295) 25,2 46,3 7,3 7,9 13,2 38.7 6.2 2,3 2,0 8,0 3,7 0,7 0,9 1,2 Italy Overweight (n=202) 57,3 19,3 3,1 1,0 1,9 17,7 1,6 0,3 0,0 1,3 0,0 0,7 0,0 2,0 Obese (n=53) 36,2 24,2 12,7 0,0 1,4 35,0 12,2 1,4 1,4 2,7 1,3 0,0 0,0 2,6 Overweight (n=265) 58,2 20,4 4,6 1,8 0,8 4,7 7,1 1,8 1,8 1,5 1,0 0,7 0,0 2,9 Obese (n=85) 45,2 29,3 11,8 6,9 2,5 5,3 5,3 1,6 4,4 2,5 4,3 1,7 0,9 5,7 Overweight (n=700) 54,6 18,6 13,5 2,2 1,4 6,3 5,1 0,3 0,1 2,5 1,8 1,2 0,6 7,4 Obese (n=279) 33,1 28,2 27,3 1,7 3,0 14,9 8,6 4,6 5,5 10,2 8,6 6,6 0,5 14,9
are medically defined as overweight perceive
them-selves as so13. It came out from that study that,
es-pecially for men and older women, the meaning of “overweight” differed from the medical definition (subjective appraisal of overweight was less frequent than objective appraisal).
Overall national prevalence of slimming at-tempts at the moment of participating in the survey range from 37.0% (in Portugal) to 46.5% (in Italy). These figures follow quite closely the ones found by
Crawford,14 where 20% of adults were attempting to
lose weight and 22% were trying to maintain their present weight or to avoid weight gain. Still in the Crawford study, most frequently indicated reasons for doing so were health-related ones. This is also the case in the data coming from the survey repor-ted here: 28.5% and 24.1% of women and men,
res-pectively, selected the item “medical advice” as the
main reason for controlling or losing weight. Results from this survey also suggest that wo-men reported higher levels of dissatisfaction with body weight (also found in another
contempora-neous study with Spanish people15 and higher
pre-valence of slimming attempts, although overweight
was then found as more prevalent in men than in women. This inconsistency was also found in
Den-mark,16 showing that approximately half of all adult
Danes attempted weight loss, almost twice as many women (61%) than men (32%). Also the results
from a research in the United States17 supported
these data.
Inconsistent data were found regarding weight behavior related with age. In fact, although self-re-ported overweigh and obesity were then more pre-valent within people over 50 years old, this was also the group where slimming attempts occurred less frequently.
Half of respondents who tried to get slimmer could not maintain the weight loss. This figure is not so far from what could be found in other studies. In one of those studies, 66% of lost weight was reac-quired after one year and after 2 years, only 20% of
individuals did keep a weight loss of 10 kg18. About
60 to 70% of women who achieved a weight loss of 20 pounds (9,01 Kg) or more, failed to maintain the
weight loss over a two-year period (idem). This
evi-dence points out to the need to establish follow-up programs focused on the maintenance of the
after-TaBLE 7. Top-five slimming methods by country
belgium1 (n=2315), % Diet regimen (73.9) Life-style change (39,8) Slimming method/ program (20,7) Meal replacement (12,3) Medical drug (9,4) Diet regimen (91,9) Life-style change (47,8) Slimming method/ product (25,5) Meal replacement (14,7) Medical drug (10,9) Diet regimen (89,1) Slimming method/ product (59,0) Life-style change (42,2) Medical drug (33,7) Meal replacement (24,5) Portugal1 (n=1299), % Diet regimen (49,0 Life-style change (34,6) Slimming method/ program (13,5) Medical drug (9,9) Slimming/anticelulitic cream (5,4) Diet regimen (56,1) Life-style change (42,9) Slimming method/ product (19,8) Medical drug (12,5) Slimming teas (7,3) Diet regimen (54,4) Life-style change (36,7) Slimming method/ product(22,4) Medical drug (21,8) Slimming teas (12,9) Spain1 (n=3504), % Diet regimen (64,8) Life-style change (40,3) Slimming method/ program (17,9) Meal replacement (13,9) Medical drug (10,0) Diet regimen (68,0) Life-style change (41,9) Slimming method/ product (18,5) Meal replacement (15,0) Medical drug (9,0) Diet regimen (80,0%) Life-style change (41,0) Slimming method/ product (29,8) Medical drug (21,0) Meal replacement (17,2) All people included Overweight people Obese people Italy1 (n=1062), % Diet regimen (51,8) Life-style change (32,7) Herbalist products (12,2) Slimming method/ program (8,3) Meal replacement (7,1) Diet regimen (56,8) Life-style change (37,0) Herbalist products (8,5) Meal replacement (5,9) Slimming method/ product (5,4) Diet regimen (68,1) Life-style change (33,0) Herbalist products (27,5) Slimming method/ product (18,7) Meal replacement (5,5) 1st 2nd 3rd 4th 5th 1st 2nd 3rd 4th 5th 1st 2nd 3rd 4th 5th
slimming obtained weight.
It is therefore important to promote the idea that the main goal is not to reduce weight, but rather to maintain the weight under control. Reducing (and maintaining) weight should not be seen as being an individual’s goal but rather as being a main national public health goal. More and easy-to-understand in-formation regarding the health benefits of keeping a normal weight is needed, as well as appropriate (and realistic) guidelines regarding slimming goals and
methods. As stated by Jutel (page 283)19, “weight
loss regimens may be more detrimental to health than moderate obesity, and […] pressure to be thin leads to disordered eating and unhealthy lifestyle choices”.
Pres-cribing a more nutritious diet is usually not enough to guarantee weight maintenance. Individuals need to nurture their motivations for keeping weight un-der control. They also need to increase their
nutri-tional literacy as well20. As pointed out elsewhere,
there is the possibility that slimming attempts may lead to an out-of-proportional wariness regarding
food, to depression and, paradoxically, to the higher
ingestion of food21.
Evidence-based advices for weight control and reduction should be endorsed by health professio-nals, ideally working in multi-professional teams with a common style of approach (e.g.,
motivatio-nal-based style)22. At this purpose, it is relevant to
recall the findings from a survey on attitudes and
practices among primary care physicians23. Here,
72% of respondents felt limited in treating obesity and considered themselves not well prepared to tre-at overweight ptre-atients. Although these dtre-ata came from Israel, there is no reason to believe that this scenario is substantially different in the countries here studied. This supports the idea that prevention of obesity should include continuous investment in motivation-prompting actions for the community (at different levels – individual, family, social ne-tworks, and setting-specific levels), altogether with promotion of an adequate biopsicossocial-based intervention cultures (including specific
forma-TaBLE 8. Reasons for stopping a slimming treatment/regimen/method by gender groups* unweighted data Women, % (n=1616) 15,9 10,3 7,1 6,7 5,8 5,5 4,8 4,0 3,3 3,2 2,2 2,3 1,9 7,4 Men, % (n=671) 13,8 11,9 7,1 2,7 3,5 2,3 2,4 2,0 2,0 1,4 1,0 0,8 0,9 4,1 Total, % (n=2327) 15,0 10,8 7,0 5,2 4,9 4,3 3,9 3,3 2,9 2,5 1,8 1,8 1,5 6,1 Having (already) achieved the desired weight
Negligence/carelessness
Professional life did not allow to follow properly the treatment/regimen It was not working as I was expecting initially
Abandon due a “transgression” (relapse) I was feeling too frustrated with the results I was constantly hungry/starving I was feeling (physically) too week I was constantly irritated
Due to a life event that changed my life-style I was feeling too anxious
I was feeling too depressed I was feeling too sad Due to other reason
*Only including people who tried and stopped the process of getting slimmer
TaBLE 9. What happened after quitting the slimming treatment/regimen/method, by gender groups unweighted data Women, % (n=1616) 31,1 29,0 21,5 13,5 Men, % (n=671) 35,2 31,5 21,9 9,2 Total, % (n=2327) 32,5 26,8 24,4 12,2 Gained back some weight – but still achieved to weight less than before
the treatment/regimen/method
Regained the same weight (that had before the treatment/regimen/method)
Gained weight – and now weighting more than before the treatment/regimen/method
tion and training in interpersonal and therapeutic-alliance promoting skills).
The data here presented suggest the need to im-plement continuous prevention programs, enhan-cing the accessibility to overweight-related health care (in terms of information and reduction of costs and waiting-lists). Such community-level preven-tion programs should, ultimately, aim to promote individual autonomous motivation to look for spe-cialized help for the individual adoption of healthy weight promoting behaviors and life-styles. r
references
1. Wardle J, Beales S. Control and loss of control over eating: an experi-mental investigation. 1988. Journal of Abnormal Psychology. 97: 35-40.
2. Breslow NE, Day NE. Statistical Methods in Cancer Research. Volume 1. The Analysis of Case-Control Studies. Lyon: IARC Scientific Publi-cation. nº 32. 1980.
3. Ware JE, Snow KK, Kosinsky M, Gandek B. SF-36 Health Survey: Ma-nual and Interpretation Guide. 1993. New England Medical Center. Boston, MA: The Health Institute.
4. Baecke J, Burema J, Frijters J. A short questionnaire for the measure-ment of habitual physical activity in epidemiological studies. 1982. The American Journal of Clinical Nutrition, 36, 936-42.
5. van Strien T, Frijters J, Bergers G, Defares P. The Dutch Eating Beha-vior Questionnaire (DEBQ) for Assessment of restrained, emotional, and external eating behavior. International Journal of Eating Disor-ders. 1986; 5(2): 295-315.
6. Garrow JS, Welster J. Quetelet’s index (W/H2) as a measure of fatness. Int J Obes 1985; 9: 147–53.
7. World Health Organization. Obesity: Preventing and Managing the Global Epidemic. Report of a WHO Consultation on Obesity. World Health Organization Geneva, 1997.
8. World Health Organization. Obesity: Preventing and Managing the Global Epidemic. Report of a WHO Consultation on Obesity. World Health Organization Geneva, 2000.
9. Tod AM, Lacey A. Overweight and obesity: helping clients to take ac-tion. Br J Community Nurs. 2004 Feb;9:59-66.
10. Lappalainen R, Tuomisto MT, Giachetti I, D’Amicis A, Paquet S. Re-cent body-weight changes and weight loss practices in the European Union. Public Health Nutr. 1999 Mar;2:135-41.
11. do Carmo I, dos Santos O, Camolas J, Vieira J, Carreira M, Medina L, Reis L, Myatt J, Galvão-Teles A. Overweight and obesity in Portugal: national prevalence in 2003-2005. Obes Rev. 2008 Jan;9:11-9. 12. do Carmo I, dos Santos, Camolas J, Vieira J. A Obesidade em Portugal
e no Mundo. Faculdade de Medicina de Lisboa. 2009.
13. Donath SM. Who’s overweight? Comparison of the medical definition and community views. Med J Aust. 2000 Apr 17;172:375-7. 14. Crawford D, Owen N, Broom D, Worcester M, Oliver G.
Weight-con-trol practices of adults in a rural community. Aust N Z J Public Health. 1998 Feb;22:73-9.
15. Cuadrado C, Carbajal A, Moreiras O. Body perceptions and slim-ming attitudes reported by Spanish adolescents. Eur J Clin Nutr. 2000 Mar;54 Suppl 1:S65-8.
16. Bendixen H, Madsen J, Bay-Hansen D, Boesen U, Ovesen LF, Bartels EM, Astrup A. An observational study of slimming behavior in Den-mark in 1992 and 1998. Obes Res. 2002 Sep;10:911-22.
17. Neumark-Sztainer D, Sherwood NE, French SA, Jeffery RW. Weight control behaviors among adult men and women: cause for concern? Obes Res. 1999 Mar;7:179-88.
18. Light K, Girdler SS. Cardiovascular health and disease in women. 1993. In: Niven C and Carrol D (eds). The Health Psychology of
Wo-men. London: Harwood Academic.
19. Jutel A. Does size really matter? Weight and values in public health. Perspect Biol Med. 2001 Spring;44:283-96.
20. Lewis JA, Sperry L, Carlson J. Health Counseling. Brooks/Cole Pu-blishing. California. 1993.
21. Ogden J. Psicologia da saúde. 1999. Lisboa: Climepsi Editores. 22. Miller WR, Rollnick S. Motivational interviewing: preparing people
for change (2nd ed.). New York: Guilford Press. 2002.
23. Fogelman Y, Vinker S, Lachter J, Biderman A, Itzhak B, Kitai E. Mana-ging obesity: a survey of attitudes and practices among Israeli primary care physicians. Int J Obes Relat Metab Disord. 2002 Oct;26:1393-7.
COrrESPONDêNCIA
Osvaldo Santos