Tesla, Inc.
Driving into the Future
João de Almeida
152114350
Dissertation written under the supervision of José Tudela
Martins
Dissertation submitted in partial fulfilment of requirements for the
International MSc in Management with major in Corporate Finance,
i
Abstract
This dissertation aims to value the intrinsic share price of the electric vehicles and batteries manufacturer Tesla, Inc. The objective is to recommend a buyer or seller position when compared to the current market price. To reach this value, several assumptions must be taken and different ideas and models should be considered. Analysing the current and past literature regarding equity valuation leads to conclude that there is no consensus among authors about the optimal valuation method. Therefore, the Discounted Cash Flow (DCF) model is considered the best model to value the company. The analysis is also complemented by a relative valuation, which confirms the results obtained in the DCF model.
This dissertation result is a $322,58 value per share which, when compared to the actual trading value on October 14 i.e. $196,51, leads to a buy recommendation. A comparison with a Robert W. Baird’s report that reaches the valuation of $338 per share is also conducted.
Abstrato
Esta dissertação visa valorizar o preço intrínseco das ações do fabricante de veículos e baterias elétricas Tesla, Inc. O objetivo é recomendar uma posição de comprador ou vendedor quando comparado ao preço de mercado atual. Para atingir esse valor, várias suposições devem ser tomadas e diferentes ideias e modelos devem ser considerados. Ao analisar a literatura atual e passada sobre a avaliação patrimonial leva a concluir que não há consenso entre os autores sobre o método de avaliação ótimo. Portanto, o modelo de Fluxo de Caixa Descontado (DCF) é considerado o melhor modelo para valorizar a empresa. A análise também é complementada por uma avaliação relativa, que confirma os resultados obtidos no modelo DCF.
O preço atingido nesta dissertação resulta num valor de $ 322,58 por ação que, quando comparado com o valor de negociação real em 14 de outubro, ou seja, $ 196,51, leva a uma recomendação de compra. É também realizada uma comparação com um relatório da Robert W. Baird que alcança a avaliação de $ 338.
ii
Acknowledgements
As the last step on my Master degree, this dissertation has been of utmost importance to me. It offered me a unique opportunity to deepen my knowledge about Equity Valuation, which I believe will be the key subject of my professional career.
Now I would like to thank Professor José Carlos Tudela Martins for all his guidance and support. From the enlightening directions and perspectives shared in the initial seminar up to his permanent availability and promptness in providing comments and responding questions.
It is also fair would also like to thank my colleagues for the discussions, and the useful inputs and suggestions for improvement. Finally, I want to thank my parents for making all this possible to me, and to other family members and friends, who have been always available to support and motivate me to succeed reaching such an important stage in my life.
iii
Executive Summary
Tesla, Inc. is one of the most innovative and disruptive companies in the world, focusing on the production, storage and consumption of electric energy. As a manufacturer of premium electric vehicles and the respective batteries, it has more recently made substantial progress in the field of solar panel technology and shows a potential as a leader of the industry.
The growth of automotive companies is highly correlated to certain macroeconomic factors, such as the economic development, the oil prices and, in the case of Tesla, the high cost of electric batteries. The latter represents a handicap vis-a-vis competitors and hampers the possibility of becoming a mass-market player. There are also other factors that are within the company’s control. A successful implementation of their short-term projects and objectives as well as the expansion of production, stores and infrastructures, combined with an improved product quality, allow to project an exponential, although volatile, growth for Tesla. The implementation of upcoming projects is vital to guarantee that the company will thrive in a competitive and capital-intensive industry as the Automotive one as other companies rapidly start to develop fully electric vehicles, Tesla will have to keep up with the expectations. The full capacity production of 500.000 should be accomplished by 2018, which requires the construction of the Gigafactory 2 and the subsequent reduction in the cost of the electric batteries.
Based on the estimated value of $322.58, the market price is low, which is supported by industry multiples. This estimation is higher than the current market value, indicating that most of the future profit potential is yet to be priced in by the market, leading to a Buy recommendation. -0,1 0 0,1 0,2 S&P 500 TESLA Financials E2017 E2018 E2019
Revenues Growth
Gross Profit 25% 30% 31% EBIT Margin 1% 11% 15%
Multiples Ratio Price
EV/EBITDA 9,59 76,14 Forward EV/EBITDA 7,81 213,69 DCF Equity Value (k) $ 50 354 WACC 8,50% Shares outstanding (k) 156 100 Share Price, USD $ 322,58
Recommendation: BUY Tesla, Inc.
Date: 14th October 2016 Price: $196.52
Target Price: $322.58 Robert W. Baird Price: $338 # Shares: 156,10 million
Credit Rating
Standard & Poor’s: B-
Performance
Stock Price historical
performance 2010-2016
1
Table of Contents
1. Introduction ... 4
2. Literature Review ... 5
2.1. The Cost of Capital ... 5
2.1.1. Cost of Equity ... 6
2.1.2. Cost of Debt ... 8
2.1.3. Forecasted Period ... 9
2.1.4. Terminal Value and Growth Rate ... 9
2.2. Discounted Cash Flow Models ... 11
2.2.1. Free Cash Flow to the Firm ... 11
2.2.2. Free Cash Flow to the Equity ... 12
2.2.3. Limitations of the DCF model ... 12
2.3. Relative Valuation ... 13
3. The Automotive Industry ... 15
3.1. General Overview ... 15
3.2. The Electric Vehicles Market ... 16
3.3. Government Incentives ... 16
4. Competitive Analysis ... 18
4.1. Current Competitors ... 18
4.2. New Competitors ... 19
4.3. Sustainable Competitive Advantage ... 20
5. Tesla, Inc. ... 21
5.1. Historical Share Price Development ... 22
5.2. Strategy ... 22
5.2.1. Supercharger Network ... 23
5.2.2. The Gigafactory ... 23
2
5.4. Financial Statement Analysis ... 24
6. Weighted Average Cost of Capital (WACC) ... 26
6.1. Cost of Debt ... 26
6.1.1. Effective Tax Rate ... 26
6.2. Cost of Equity ... 26
6.2.1. Risk Free Rate ... 27
6.2.2. Systematic Risk ... 27
6.2.3. Market Risk Premium ... 28
6.3. Capital Structure ... 28
7. Forecasting ... 29
7.1. Revenues ... 29
7.2. Profit Margin ... 31
7.3. Operating Expenses ... 32
7.4. Interest Expenses and Taxes ... 33
7.5. FCFF Inputs ... 33
8. Valuation ... 35
8.1. Discounted Cash Flow Valuation ... 35
8.1.1. Terminal Growth Rate ... 35
8.1.2. Valuation Result and Analysis ... 35
8.2. Relative Valuation ... 36
8.2.1. Peer Group ... 36
8.2.2. Multiples Valuation ... 36
9. Sensitivity Analysis ... 38
9.1. WACC and Growth Rate ... 38
9.2. Future Tax Rates ... 39
10. Research Report Comparison ... 40
3
12. Bibliography ... 42
13. Appendices ... 45
Appendix A: Electric Vehicles Different Segments ... 45
Appendix B: Tesla’s Product Description ... 45
Appendix C: Government Incentives for Electric Vehicles ... 47
Appendix D: Competitors ... 48
Appendix E: Supercharger Networks ... 49
Appendix F: The Gigafactory Process ... 50
Appendix G: Battery Cost Forecast ... 50
Appendix H: WACC calculations ... 51
Appendix I: Vehicles Prices ... 51
Appendix J: Historical Income Statement and Balance Sheet ... 52
Appendix K: Forecasted Income Statement ... 54
Appendix L: The DCF Model ... 55
4
1. Introduction
The concept of value is unquestionable as a relevant management technique and it is gaining a crucial relevance in this dimension. Valuation personifies the definition of the economic value of a company or an asset. The purpose of this dissertation is to assess the fairness of the current market price based on an analysis of fundamentals as well as the current and expected financial statements of the company. At the end, the present dissertation is benchmarked against an independent valuation.
The motivation behind choosing Tesla as the company to be researched lies on the belief that their appealing products and cutting-edge technology stand as main drivers for the evolution of the consumers’ minds towards sustainable and renewable energies. The future for a company like Tesla looks promising due to the growing concerns about global warming and sustainability. Their focus on electric vehicles, rather than conventional carbon-dioxide powered vehicles, and their expansion to the production of electric energy, with the development of their solar panels, is driving the company, as well as many other market players, to a completely new era. Behind all this move, there is an interesting personality, Elon Musk, who manages the company and translates his vision into Tesla’s products, not disregarding other very well-known projects like SpaceX, Solar City, PayPal and Zip2.
This study calls for deep knowledge on the different valuation models and techniques, since there is no consensus about an optimal model. Several perspectives are taken with the purpose of supporting the selection of the most effective and reliable model to evaluate this company. The company’s competitive context takes also an important part of the study since it is of utmost importance to profile competitors and understand how their stance impacts the company’s way of developing, producing and marketing the products. The analysis of the industry, the competitors as well as the identification of the key risks in terms of likelihood of materialising and potential negative impact, are the basis to sustain the assumptions made, so they may be considered meaningful and accurate when confronted with real market conditions.
In short, the following question could be raised to shortly describe the aim of the study: is the market correctly perceiving the future growth expectations for this company in the sense of yielding a fair price?
To answer this question, a final value per share is determined and compared to the target value achieved by a Robert W. Baird’s analyst. The most relevant differences regarding assumptions made, models used and results achieved are identified and discussed in detail in the following sections.
5
2. Literature Review
The value of a firm is deemed as crucial for investors and shareholders, as it represents the conceptual basis when making investment and financing decisions (Damodaran, 2006).
According to Young et al. (1999), the new methods and theories that are constantly being developed affect valuations, in the sense that the crescent number of approaches used to assess a company’s value will give poorer results. This means that the valuation of a company is not a forthright subject. Demirakos, Strong & Walker (2004) conclude that for different industry contexts one should apply different valuation methodologies. Luehrman (1997a) states that valuation and assumptions should be based on risk, timing and cash. This means that the same approach can lead to particularly different results, depending on the assumptions made, giving much more relevance to the latter than to the valuation model itself.
Damodaran (2002 & 2006) states four general approaches on how to perform an equity valuation of a company: Discounted Cash Flows model, Relative Valuation, Contingent Claim valuation and Liquidation and Accounting valuation. As Tesla is a company operating under highly unusual circumstances, the two latter models are not adequate, therefore are not part of this analysis (Petersen & Plenborg, 2012).
In the following section, the different valuation methods and their limitations will be assessed to determine which of them will be more appropriate to correctly evaluate Tesla’s equity.
2.1. The Cost of Capital
To asses a company’s value, it is necessary to evaluate the risk inherent to the cost of funds used for financing a business. This will be a representation of the rate used to discount the forecasted cash flows into present values. On the one hand, it will represent the required return by investors that finances the company through equity, and on the other hand by investors that grant debt funding.
The cost of capital will, therefore, be a weighted average (WACC) of both financing alternatives. The average of the expected returns of different investors, such as equity, debt and hybrid securities investors, weighed by its respective portion in the capital structure at market values (V) will be:
𝑊𝐴𝐶𝐶 = 𝑘𝑒 ×
𝐸
𝑉+ 𝑘𝑑 ×(1 − 𝑡𝑚)× 𝐷 𝑉
Using the target weights to combine the equity cost of capital and the cost of debt after taxes into a single number (WACC) will allow to discount the projected free cash flows to the firm into their present values. In the case of hybrid securities, Damodaran (2012) and Koller et al.
6 (2010) suggest that they are broken down into their respective straight bond (debt) component and the convertible option (equity). Regarding the capital structure, it is expected to approach its peer groups as the company grows and its straight debt becomes cheaper (Koller et al., 2010).
2.1.1. Cost of Equity
The return required by the Shareholders when investing in a company’s equity, in exchange for owning the asset and bearing the risk of ownership, is the cost of equity. Damodaran (2001) determines this cost through one of the most fundamental models in finance, the Capital Asset Pricing Model (CAPM). The CAPM suggests a linear relationship between the expected rate of return and the systematic risk of a portfolio, a combination of risky assets to minimize the risk for a given return. This way, the CAPM assumes that investors are compensated by two alternative ways, the time value of money and the risk incurred in the investment.
𝐸(𝑟𝑒) = 𝑟𝑓+ 𝛽𝑒 × [ 𝐸(𝑟𝑚) − 𝑟𝑓 ]
Where:
E(re) = Expected cost of equity
rf = Risk-free rate
βe = Systematic risk on equity
E(rm) = Expected rate of return on market portfolio
The cost of equity can also be forecasted using alternative methods and formulas. Fama and French (1992, 1993, 1996) find an alternative to forecast a larger proportion of the variance in returns than just the market’s systematic risk (CAPM). Their three-factor model describes that the expected returns can be determined based on the beta as a measure of systematic risk (CAPM’s only factor), market capitalisation (difference in returns of a small and a big diversification portfolio) and to-market ratio (difference in returns of high and low book-to-market ratio diversified portfolios).
Finally, the Arbitrage Pricing Theory (APT) developed by Ross (1976) suggests that the expected return on an asset is a linear relationship of several independent factors rather than a single factor of systematic risk.
Regarding the three alternative methods, despite the constraint of using only one factor to explain past results (Damodaran, 2002), the CAPM’s simplicity and relevance as a benchmark for asset pricing makes it the most advantageous model for this estimation.
7
2.1.1.1. Risk-free Rate
The risk-free rate characterises the return on a security that investors can expect with certainty, obtained in the market at the time of the valuation (Fernández, 2004). The expected payoff of this asset always equals the actual payoff characterizing the interest an investor would have from a riskless investment over a specified time-period. Government bonds can be considered risk-free assets, due to the low probability of bankruptcy of some of the main economies. The risk-free rate should reflect the security that an investor in Tesla’s shares would have invested in if he was risk averse. As most of Tesla’s investors are American (Nasdaq.com), the U.S. Treasury Bond will be used. Although the maturity of the risk-free asset should match the investment horizon for the expected cash flows, Bruner et al. (1998) nevertheless argue that the differences between the 30-year and the 10-year rates are not critical.
As Tesla is reporting and forecasting in USD, the 10-year U.S. Treasury Bond provides sufficient consistency for its valuation.
2.1.1.2. Beta
The equity beta is a measure of systematic risk that derives from the relationship between the return of the stock and the return on the market’s portfolio. According to Petersen & Plenborg (2012), beta captures the risk added by a single security to a broad and diversified portfolio. Consequently, market movements will have positive or negative impacts on the stocks, depending on whether the beta is greater or lower than one, respectively. This means that the stock will react to market changes in proportion to the beta. When the beta is zero, the asset is risk-free. The raw equity beta is estimated by regressing the company’s daily returns on the daily returns of a market index:
𝛽 = 𝐶𝑜𝑣 ( 𝑟𝑎 , 𝑟𝑚 ) 𝜎𝑚2 𝑟𝑎 = 𝛼 + 𝛽 𝑟𝑚 Where: ra = Stock return α = Regression constant β = Equity beta
8 While the raw beta represents an historical average, some data providers like Bloomberg use an adjustment to account for evidence that the beta tends to regress over time (DeMarzo, 2012). The risk parameters of the firm evolve alongside its life cycle, becoming closer to the average firms of the market as it matures, which according to Damodaran (2012) should be reflected in the beta and, accordingly, in the cost of equity. The formula of the adjusted beta is as follows:
𝑎𝑑𝑗𝑢𝑠𝑡𝑒𝑑 𝛽 = 2
3 ∗ 𝑟𝑎𝑤 𝛽 +
1 3
2.1.1.3 Market Risk Premium
The market risk premium represents the average additional return an investor would have from investing in risky assets rather than just investing on a risk-free asset. To calculate this premium, besides the risk-free rate a market portfolio is also needed. This portfolio is characterized by gathering the total supply of securities, weighted by the relative proportion of the total market (Berk and DeMarzo, 2014). Market indices are most commonly used as proxies, due to the constraints and impracticalities of creating a market portfolio.
When calculating the historical risk premium, experts use different period lengths. Some argue that a shorter period is better due to the unpredictability of average risk aversion, and that for certain risk levels recently acquired data better represents current required returns. Others say that a longer time frame makes it possible to reduce the standard error of the risk premium estimate, improving the estimation, as suggested by Damodaran (2012). This author also discusses the use of the arithmetic average rather than the geometric average of the risk premiums. As the projection time is extended, the geometric mean becomes more relevant. In the case of a sample period like the one projected, the geometric mean is the unbiased estimate of the mean. The geometric mean is a more appropriate measure for future predictions, especially when it involves relatively long projection periods.
2.1.2. Cost of Debt
The cost of debt is a required return to fund a company based on its operational and financial risk. It is based on the credit rating assigned to the company, and therefore calculated as the credit spread over the risk-free rate. Since the rate reflects the cost at which the company can borrow today, if an Investment-grade company has long-term option-free bonds, Koller et al. (2010) suggests that the Yield to Maturity (YTM) is a good measure for the cost of debt.
9 Meanwhile Tesla only has short-term convertible bonds outstanding and the yields are highly dependent on stock movements as debt is directly tied to the relative stock conversion. Therefore, it is not possible to use the yield to reach Tesla’s actual cost of debt. Instead, the company’s credit rating is determined to match a portfolio of long-term bonds with the same rating, extracting the average yield to maturity.
The company’s bond rating is determined by rating agencies like S&P, Moody’s and Fitch Group. They examine the most recent financial ratios presented by the company, their competitive environment, and interview the senior management. Damodaran (2014) assigns a credit spread for the ratings of different agencies. In this case, the most recent evaluation and spread should be used (Koller et al., 2010).
Finally, the cost of debt must be calculated on an after-tax basis, because there is a tax benefit that accrues from paying interest, implicating a lower after-tax cost of debt than the pre-tax cost (Damodaran, 2012). The formula is as follows:
𝑘𝑑 = 𝐶𝑜𝑠𝑡 𝑜𝑓 𝐷𝑒𝑏𝑡 × (1 − 𝑡𝑚)
Where:
kd = After-tax Cost of Debt
tm = Marginal tax rate
2.1.3. Forecasted Period
The length of the forecasted period is a rather subjective matter. The forecasting of a company’s financial statements is not straightforward and an appropriate time frame for each case should be estimated. To calculate an accurate terminal value, it is important that the forecasted period spans until the company has reached its steady state (Koller et al., 2010). It is also relevant that the period is long enough, so that demand and supply are balanced in the long run, and growth rates are not greater than the actual growth of the economy. So, to meet the existing demand, the company starts off with high growth rates until it reaches the maturity state, where the growth rate will tend to fade towards the growth of the economy.
2.1.4. Terminal Value and Growth Rate
The Terminal Value is considered the most important component of a valuation estimation, since it will always represent a large proportion of the total value, and in some cases it can be
10 greater than 100 % of the value of the stock (Damodaran, 2002). This reflects the price appreciation that results from the returns gained by holding a stock for a finite period of time. Damodaran (2012) defines three different methods to estimate the terminal value: Liquidation Value, the Stable Growth Model, and the Multiple Approach.
The first one is based on the value that other companies would be willing to pay for the company’s assets at a certain point in time:
𝐸𝑥𝑝𝑒𝑐𝑡𝑒𝑑 𝐿𝑖𝑞𝑢𝑖𝑑𝑎𝑡𝑖𝑜𝑛 𝑉𝑎𝑙𝑢𝑒
= 𝐵𝑜𝑜𝑘 𝑉𝑎𝑙𝑢𝑒 𝑜𝑓 𝐴𝑠𝑠𝑒𝑡𝑠 × (1 + 𝐼𝑛𝑓𝑙𝑎𝑡𝑖𝑜𝑛 𝑅𝑎𝑡𝑒) × 𝐴𝑣𝑒𝑟𝑎𝑔𝑒 𝐿𝑖𝑓𝑒 𝑜𝑓 𝐴𝑠𝑠𝑒𝑡𝑠
This model assumes a finite life for the firm and a liquidation at the end of that period, and it relies on accounting book values.
To calculate the terminal value of the company using the Multiple Approach, a comparison with the company’s peer group is made. It represents a hybrid valuation (relative and intrinsic), using companies with similar operations and results.
The most consistent and accurate model that Damodaran (2002) presents is the Stable Growth Model. Since firms can reinvest some of their cash flows back into new assets, they will be extending the lives thereof. The Stable Growth Model assumes that if the cash flows earned beyond the terminal year grow at a constant rate forever, the terminal value will be estimated through the following formula:
𝑇𝑒𝑟𝑚𝑖𝑛𝑎𝑙 𝑉𝑎𝑙𝑢𝑒𝑡 = 𝐶𝑎𝑠ℎ 𝐹𝑙𝑜𝑤𝑡+1
𝑘𝑡+1 − 𝑔𝑡
In this formula, it is clear to perceive the importance of the Growth Rate (gt) used to estimate
the Terminal Value. As growth increases, so does the proportion of terminal value. To apply this model, the company must be in the steady state, meaning that it will not have very big investments, leaving the capital expenditures (capex) and the depreciations at constant levels in its future life (from t+1 onwards). It is also assumed that the cost implied in the formula (WACC
or ke, and accordingly Free Cash Flow to the Firm and Equity) is greater than the stable growth
(g) estimated for the company. In the long run, companies cannot grow faster than the economy, meaning that it is unrealistic to have growth rates greater than the nominal GDP evolution.
11
2.2. Discounted Cash Flow Models
The Discounted Cash Flow (DCF) models require that the future cash flow projections are discounted to obtain the present value of a firm’s assets, at a rate that reflects the riskiness of those cash flows (Damodaran, 2006). The differences between models are in the discount factors to be used and the assumptions made to estimate future cash flows. Dividends, cash flows and accounting earnings are some of the measures used, which in a ceteris paribus environment should provide the same outcome. Nevertheless, empirical evidence has varying results, since different estimates of the expected cash flows will result in different market values. This model relies on the forecasts of the expected cash flows, meaning that two different growth stages will have to be considered, adding up to the formula of the terminal value discussed previously.
Damodaran (2002) and Luehrman (1997) argue that this model reflects the best theoretical credentials and is considered as best practise when valuing a company. In this section, the most important valuation methods within the DCF will be assessed, focusing on the more relevant ones for Tesla.
2.2.1. Free Cash Flow to the Firm
This model is meant to assess the business as a whole in order to estimate the value of the firm. The goal of this valuation is to determine the intrinsic value of an asset, based on the analysis of all features of the business. The Free Cash Flow to the Firm (FCFF) is a performance measurement considering the net amount of cash generated, after adjusting it to excess cash, which includes taxes, expenses and variations of yearly investments and working capital. The FCFF formula is as follows:
FCFF = EBIT × (1 - t) + Depreciation – CapEx – ΔNWC +/- CF non-operating activities
Breaking down the formula, even though depreciations are not a cash expense, it is a cost included in the financial statements, being considered for tax purposes. According to Damodaran (2006), the free cash flow can be achieved by discounting the cash flows created from assets, prior to debt payments and after reinvestments towards the creation of growth assets. The discount rate used in the actualization of cash flows is the WACC, which captures the costs and benefits of the capital structure, as well as the tax shield effect:
12
𝐹𝑖𝑟𝑚 𝑉𝑎𝑙𝑢𝑒 = ∑ 𝐹𝐶𝐹𝐹𝑡
(1 − 𝑊𝐴𝐶𝐶)𝑡
2.2.2. Free Cash Flow to the Equity
The firm value approach evaluates the total enterprise value, while the Free Cash Flow to the Equity (FCFE) estimates the value of the firm to equity holders (Young et al., 1999). This way, the firm value represents the portion of value that debtholders and shareholders possess, while the equity value only concerns the latter. It represents the cash available to pay all the equity holders after considering debt payments and necessary investment in fixed and working capital:
𝐹𝐶𝐹𝐸 = 𝑁𝑒𝑡 𝐼𝑛𝑐𝑜𝑚𝑒 − 𝑁𝑒𝑡 𝐶𝑎𝑝𝐸𝑥 − ∆𝑁𝑊𝐶 + 𝑁𝑒𝑤 𝐷𝑒𝑏𝑡 − 𝐷𝑒𝑏𝑡 𝑅𝑒𝑝𝑎𝑦𝑚𝑒𝑛𝑡
Alternatively, to the previous valuation method, in this case to assess the firm’s equity through the equity’s cash flows it is necessary to discount it with a cost that reflects the risks related to equity. The FCFE will be discounted back to the present value at the cost of equity, as referred previously.
𝐸𝑞𝑢𝑖𝑡𝑦 𝑉𝑎𝑙𝑢𝑒 = ∑ 𝐹𝐶𝐹𝐸𝑡 (1 − 𝑘𝑒)𝑡
Both the FCFF and the FCFE have better results depending on the environment and the type of company targeted for investment. For relatively stable capital companies, FCFE is more suitable due to its simplicity, and the FCFF is more effective when valuing leveraged companies with a negative FCFE.
2.2.3. Limitations of the DCF model
Although it is the most used and known valuation model, some limitations might represent a barrier to correctly measure the company’s value. The high dependency on future predictions is one of the main problems. Damodaran (2002) believes that the information available in the market is not enough to carry out an effective analysis and, so assumptions should be made. The failure of one of these assumptions will have an impact on the intrinsic value, moving further away from the real value. The discount rates are also referred to as a problematic, since another author (Luehrman, 1997) refers to the usage of the WACC for the computation. This discount factor is adequate for companies with constant capital structures, benefiting from the
13 simplicity of tax position and funding policy, and biasing the analysis in companies with unstable capital structures. Also related to the cost of capital, Fernandez (2013) refers some errors and misconceptions that influence the quality of the estimation. The WACC is dependent on the valuation of tax shields, which are defined by the company’s debt policy and affects the capital structure. This highly unpredictable component of the discount factor makes it more difficult to correctly estimate the true cash flow, as it will have a considerable impact on the company’s accounts.
2.3. Relative Valuation
The Relative Valuation does not rely on computing the intrinsic value of the asset, but rather depends on similar assets to determine the value. This valuation can represent an effective way to validate the assumptions made in DCF model by comparing outcomes. Furthermore, Goedhart et al. (2005) suggest the combination of the two models, since Relative Valuation is more accurate in forecasting. However, the Relative Valuation by itself does not yield the most precise estimation. There are two critical factors in the assessment of the company’s value through comparable companies: The Peer Group and the Multiples.
The Peer Group is a set of companies that have identical characteristics, and different authors propose different ways of aggregating them. Damodaran (2006) defines these characteristics as cash flows, growth potential, and risks to the company being valued. The performance characteristics that seem more important in peer definition are the return on invested capital and growth, raising the quality of the peers when these are similar. Besides these characteristics, peers should be comparable in terms of size, markets, products and customers, which stand as firm specific features.
There is a wide range of Multiples and these can be distinguished depending on whether they are used to derive the Equity or the Firm’s value. It is not a straightforward subject, as different situations and environments require different Multiples. The greatest advantage of the Firm value multiples is that they do not depend on the capital structure of the company (Goedhart et
al., 2005). As these multiples are not based on accounting values, rather on EBIT and EBITDA,
they are less prone to manipulation. Nonetheless, the equity multiples, also called earnings multiples, still have better performance than historical data, sales and book-value multiples. The enterprise multiples are less susceptible to errors or even to manipulation, such as the Enterprise-Value-to-EBITDA. This will be the most relevant ratio to consider in the analysis of Tesla, which will need to be adjusted for excess cash and non-operating assets that are valued
14 distinctly. A simpler multiple, also based on the Enterprise Value (EV), will be used with Revenues instead of the EBITDA.
Analysing the equity ratios in detail, the Price-to-Earnings (P/E) ratio is broadly used, even though it has a couple of flaws. The company can artificially increase this multiple by exchanging debt for equity. This happens when the unlevered P/E is higher than one over the cost of debt, and leverage will have an impact on the P/E. Moreover, the multiple can suffer from singular non-operational impacts, as it is based on earnings. Even so, when using forecasted earnings instead of historical ones, the estimation will be more precise. Besides the P/E, the multiple that relates the Price with the Book Value will also be used on a forward-looking basis.
Goedhart et al. (2005) concludes that there are some multiples that value companies more effectively than others, as in the case of asset value multiples, which are less biased and more precise than earnings and sales multiples. Additionally, they argue that forecasted rather than historical earnings improve the estimate of the multiples referred.
15
3. The Automotive Industry
3.1. General Overview
To conduct a proper evaluation of Tesla, Inc. it is crucial to properly analyse the environment in which they are competing and describe the main behaviours, drivers and future trends that need to be considered. These macroeconomic factors are deemed as crucial to define the performance of the global industry. Despite the consumer’s perception of the automobiles as a basic need, they are still considered as luxury goods. An illustration of past behaviour compared to the world’s economy performance is a good way to consolidate this idea.
The automotive industry has experienced an incredible growth over the past couple of years, assuming a role as one of the main drivers for industrial revolution, especially due to constant innovation seeking to satisfy the demanding customer’s needs. It is an extremely competitive and consolidated market, where the top 15 companies control most of the market. Despite having an important weight on today’s economy, it has proven to be highly dependent on the performance of the world’s economy. According to our own calculations, both these variables have a strong correlation (~0.72), which means that any shift in the global economy will strongly impact vehicle sales, as it did at the time of the 2008 crisis (big drop in sales), and the beginning of its recovery (highest sales registered in 2010).
There are four main markets that dominate global car sales – China, United States, Europe and Japan – over these past years. China has been the largest market since the economic crisis and its lead over the United States has been growing since then. China’s growth during the recession was one of the reasons for keeping the industry relatively stable, when compared to the
Source: Compi l ed by a uthor/Worl d Ba nk 90% 95% 100% 105% 110% 115% 120% 2005 2006 2007 2008 2009 2010 2011 2012 2013 2014 2015
GDP impact on Vehicle Sales
16 expectations regarding the financial crisis. Because of the crash in Europe, Tesla redirected its focus to strong European economies such as the UK, Norway, Germany, Switzerland, and the Netherlands.
The main issues to take into consideration for the automotive industry are the growth of public debt in Europe, United States and Japan, and the problem of overcapacity in China. These factors altogether mean that a wider outlook of the economy must be considered, in order to account for possible and significant impacts across the industry.
3.2. The Electric Vehicles Market
To develop a reliable forecast, it is necessary to delve deeper into the most valuable sector for Tesla’s business, the Electric Vehicles (EV). Despite being a relatively recent market, some of the companies that commercialize electric cars have successfully shaped their business models to achieve profitability. A significant factor for this development is the constantly growing pressure on manufacturers, such as regulatory standards, towards the reduction of vehicle emissions. Demand in the automotive industry has been shifting towards electricity-powered vehicles, due to these regulatory benefits and technological progress in powertrain components. Efforts have been made in this direction, as in the Electric Vehicles Initiative (EVI) which aims at achieving the number of 20 million EV on the road by 2020. Tesla manufactures and sells a different product from the traditional automotive segment, even though they compete in the same market. This sector is divided into three segments as detailed in Appendix A.
3.3. Government Incentives
As previously mentioned, governments and local authorities have a growing concern on the environmental issues and pressures put by the central institutions and organizations. In this sense, the governments began to legislate on and control some activities and behaviours that are harmful to the environment, and are especially granting benefits to ecological (green) products and services, which has a positive impact on Tesla’s sales. This section addresses the assessment of incentives and analyses, aiming to understand how changes in those regulations could impact Tesla’s performance. To promote the production of electric and environmentally-friendly vehicles, Tesla has several agreements with the California Alternative Energy and Advanced Transportation Financing Authority (CAEATFA). Tesla is exempt from paying taxes on the purchase of manufacturing equipment used in the development of the existing models (Model S, Model X, Model 3), future electric vehicles and expansion of powertrain production
17 in the state. This agreement has already saved $100 million until the end of 2016 and is estimated to double until the end of the contract. Tesla is also benefiting from tax reductions in the state of Nevada, related to the construction of the new Gigafactory 1. The conditions to receive these advantages rely on the investment of at least $3.5 billion in the factory they are developing in Nevada. Other perks are related to the production and distribution of zero-emission vehicles, which allow Tesla to obtain tradeable regulatory credits. The Environmental Protection Agency (EPA) establishes an average carbon dioxide emissions standard which manufacturers are not permitted to exceed, allowing for the sale of excess credits to other producers who will find them useful to comply with the requirements, such as the ZEV credits and the Greenhouse Gas (GHG) credits. Zhang et al. (2014) state that governments are forced to make economical efforts to convince the consumers that Electric Vehicles also have financial benefits, which is an impact the consumer will perceive immediately, contrary to the environmentally-friendly idea. Having this in mind, the U.S. Department of Energy made available income tax credits up to $7,500 for Electric and Plug-in Hybrid Vehicles buyers, which means receiving the full amount if they purchase a Tesla. The most common form of State incentives are rebates from $1,000 up to $2,500 and access to carpool lanes (Appendix C). A slight reduction in these benefits would have a strong negative impact on demand, mainly in the U.S., their biggest market with about half of their sales. Considering eventual changes in these incentives, these will have a significant impact on the company’s intrinsic value and should be measured in the valuation.
18
4. Competitive Analysis
4.1. Current Competitors
To assess and analyse Tesla’s competitive environment, it is necessary to understand what the alternatives to their vehicles are now and in the future. The alternative fuel vehicles market is highly competitive, taking a leap with the introduction of lower priced vehicles, such as the Model 3 (Annual Report 2016). Their current Models S and X compete in the premium sedan and SUV market with Audi, BMW, Mercedes and Lexus, while the upcoming Model 3 is meant to compete with medium-sized sedans from the same brands and also Honda and Toyota. The first four brands are strongly featured in January 2016’s top selling list of hybrid and plug-in hybrid vehicles. These brands might also be somehow projected by their traditional fuel engines (Appendix D), even though Volkswagen’s Chairman (June 2016) has stated that “the future belongs to electric cars”. In case competitors launch a new model, and a new fully electric vehicle, it is pertinent to consider the release of electric models in the forecasting exercise. Porsche plans to reveal their first fully electric sedan by 2020 to compete with Tesla’s Model S. Its characteristics will be extremely competitive, such as 40 miles (15%) more autonomy than Model S, and charging up to 80% of the battery in just 15 minutes. Moreover, Porsche states that the price will be “competitive”, even though it is not yet available. Lexus is specifically concentrating their production on the hybrid cars segment. It does not seem that the company will develop the fully electric vehicles, since they have applied an advertising strategy that downgrades the electric cars, underlying their charging time and range constraints. Audi’s strategy focuses on the development of a contender for Tesla’s Model X. Their ambition is to launch a battery powered sports activity vehicle by 2018, the Audi Q6 e-Tron Quattro, with an extremely competitive autonomy range – more than 310 miles – and a price comparable to Model X’s (Sheehan 2016). Another novelty expected in the market by 2020 is the fully electric Volkswagen Phaeton. At a price like Audi, it also shares the same battery technology, allowing for an improved autonomy range. Volvo also plans to launch in 2019 a competitor in the electric vehicles market, but to face Model 3. Their strategy is to have the entire Volvo fleet electrically powered by 2020 (Ingram 2015).
Competition will be fierce by 2020, due to the development of fully electric cars by other brands, able to compete with Tesla’s leading Models. Nevertheless, Tesla is settled in this segment right from the start, giving them more time to further develop their existing models and to innovate with new ones.
19 Regarding the Energy Storage products, several established companies could develop and introduce products to compete with Tesla’s individual component of energy storage systems and integrated systems. Examples of these companies are AES Energy Storage, LG Chem and Samsung. As for the Solar Energy Systems, the competition is with traditional local utility companies. In the residential solar energy installation market, the companies that compete with Tesla are Vivint Solar Inc., Sunrun Inc., Trinity Solar and Songevity, Inc. (Annual Report 2016).
4.2. New Competitors
Nowadays, in the automotive industry, the Electric Vehicles segment is the most attractive one, with high forecasted growth rates and many government incentives. These characteristics of this market make it prone to having companies willing to invest in electric vehicles and to compete with the already settled brands. The entry barriers for new players in the industry are high, since it is a market where brand strength, reputation and huge initial investment are necessary requirements to be able to thrive. The companies that are more successful when entering this segment are the experienced manufacturers of traditional fuel vehicles or other kinds of alternative powered vehicles. Nevertheless, Tesla should be aware that new competitors might bring some competitive innovations. It is the case of Apple and their ‘Project Titan’, which Elon Musk, Tesla’s CEO, refers to as an “open secret”. Regardless of Apple being very discrete about this project, it is known that they have a team of about 1.000 employees, hired from companies like Tesla, Ford and BMW, working on an “Apple-branded electric vehicle” (Leswing, 2016). Google is also entering this market, having already an electric vehicle prototype, despite focusing mainly on software to build self-driving cars. Easily overcoming the high initial investment barrier, Google is racing with Tesla for the first mover advantage of the self-driving car, which is estimated to be launched by the first half of the next decade. In general terms, the risk of having new strong competitors is low to moderate. This risk is assumed by companies already in the automotive industry, at least in the short term. Innovative companies may have an influence in consumer’s expectations and needs, having an impact in the longer term.
20
4.3. Sustainable Competitive Advantage
As previously referred, Tesla is a few years ahead of their competition, allowing for a greater flexibility in their own value chain to maintain their success with high growth rates, and therefore a competitive advantage. Tesla’s most value-creating resources can be recognised by a Porter’s Value Chain Analysis (1985), as can be seen in the following chart:
Tesla takes advantage of being one of the few companies in the business to be vertically integrated, including design, manufacturing and sales, to reduce costs and facilitate quality control. Regarding Tesla’s Inbound Logistics, all the powertrain is developed in California’s factory and the battery packs, which represent a key input, are sourced from Panasonic. Tesla has the possibility of maintaining an advantage in their Operations as construction time and technical know-how will delay competitors for a few years. Based on the analysis, the rest of the Primary activities allows Tesla to keep ahead of the competition temporarily until these are invented or even substituted by the competitors. The relationship that the Support Activities can uphold with the Primary activities adds significant value to Tesla’s value chain. Although it is difficult to measure the managerial skills effect on a company, it is noted that Tesla has been following the right strategic path and vision, which allow for performance improvement at any level. Analysing the overall value chain, Tesla’s relies on their installed capacity and know-how in product manufacturing, and their managerial skills to maintain its competitive advantage over the rest of the market.
21
5. Tesla, Inc.
This section introduces the reader to Tesla and highlights some relevant aspects of the company. Tesla, Inc., formerly known as Tesla Motors, Inc., was founded in Palo Alto, California, in 2003 by a group of engineers with the goal of demonstrating that electric cars could perform better than fuel powered ones. Their reputation relies mostly on the characteristics of their vehicles, such as the instant torque, their incredible power and the zero emissions component.
The company’s strategy began with the production of a fully electric premium sports car, the Tesla Roadster, evolving to a more affordable alternative such as the Model 3. Nowadays, the company operates in two different segments, the automotive and the energy generation and storage. Their major activity is designing, developing, manufacturing and selling electric vehicles. Based on the fully electric component of the Electric Vehicles segment, the company designs, manufactures, sells and installs fixed energy products and solar systems to all sorts of customers, or sell electricity generated by their solar energy systems. Elon Musk, one of the founders of the company, later became CEO after investing in the company. Tesla became listed on the NASDAQ stock exchange (TSLA.O) after raising USD 226 million through an IPO in June 2010 (second IPO of a US automaker since Ford Motor Co. in 1956). These proceeds were useful to fund their following investments in factories and in the production of the Model S Sedan. The manufacturing and assembly processes are carried out in their various facilities: Fremont, California; Lathrop, California; and Tilburg, Netherlands (Tesla Annual Report 2016). To achieve a mass-market in the electric vehicles sector it
is necessary to enhance the production of the lithium-ion batteries. In the automotive sector, Tesla has three different car models, the Model S Luxury Sedan, the Model X sports utility vehicle (SUV) and the lower price Model 3 Sedan designed for the mass market (expected to be available and delivered in 2018). In 2016, Tesla received the highest consumer satisfaction score among all car brands from Consumer Reports website.
Tesla is one of the few vertically integrated companies in the
world, and has established a global network of vehicle stores, service centres and supercharger stations that allows the generation, storage and consumption of their energy products (Tesla Annual Report 2016).
Tesla spotted a niche market right from the very start, showing some of the characteristics of a disruptive company. Tesla differentiates from the traditional players by concentrating on
Rank Brand Would Buy
Again 1 Tesla 91% 2 Porsche 84% 3 Audi 77% 4 Subaru 76% 5 Toyota 76% 6 Honda 75% 7 Mazda 74% 8 Chrysler 73% 9 Chevrolet 73% 10 Lexus 73%
22 electric powertrain technology, and as a new entrant, they developed this technology to be sold to a niche market. With the continuous improvement process, they achieved a more cost-efficient technology when compared to others already established in the market.
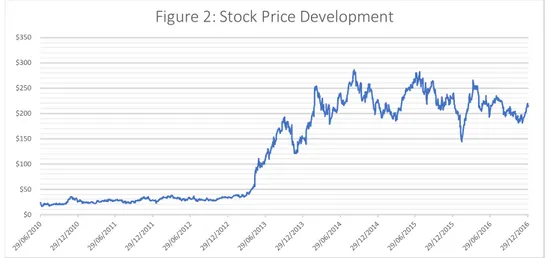
5.1. Historical Share Price Development
Since Tesla’s IPO until June 2016, the shares have been rising at a CAGR of about 44 %. The initial price of the IPO was $17, and its value now stands at $196.51, having reached its peak on September 4, 2014 with a price of $286.04. The greatest increase noted since the IPO was in 2013. This return may be explained by two reasons: good ratings achieved by the Model S quality and the supercharger grid increase; and the outstanding financial results, triggered by early loan repayments and the exceeding of expected results.
5.2. Strategy
As Tesla’s CEO, Elon Musk, states, “Tesla’s mission is to accelerate the world’s transition to sustainable energy”. Tesla positions itself as not only an automaker, but also as a technology and design company that focuses on energy innovation. This transition seems somehow contradictory, since they are especially rooted in the premium vehicles segment which is not affordable by most of the customers. Tesla expects to continue lowering manufacturing costs, due to enhanced efficiency, material cost reductions, and especially economies of scale. The greater development of the vehicles has been particularly in their battery packs, which are designed to achieve high energy density at a low cost, and therefore improving the mileage autonomy of the batteries. That is the case of the new Model 3 that is already announced to start selling in 2017. The new vehicle is targeted for the mass market with a price of $35.000, representing a step forward towards the success of their mission. In 2016, Tesla produced
Source: Compiled by author/NASDAQ
$0 $50 $100 $150 $200 $250 $300 $350
23 approximately 84.000 vehicles, an increase of 64% when compared to the previous year’s production. The improvement of both Models S and X, aligned with the introduction of a less expensive alternative, the Model 3, and the development of their retail, services, and charging infrastructures will generate incremental demand. The model 3 is the most significant driver for demand, with a mind-blowing 400.000 pre-orders since it was presented in March 2016. As a consequence, in early 2016 the company announced the anticipation to the year 2018 of their initial objective of reaching a production level of 500.000 vehicles by 2020. This production level can only be achieved by the full development of the Gigafactory, for producing the batteries and the storage products for the vehicles. Production levels from 2018 onwards can be raised with additional production capacity in Europe and Asia, possibly with the Gigafactory 2 that is already being planned.
5.2.1. Supercharger Network
Tesla has been seriously investing in the expansion of their Supercharger station network. This system is much more appealing than the alternative of charging at home for some hours, since it is free or requires a small fee, and it only takes a couple of minutes. From the closing of 2015 to 2016, Tesla expanded from 584 to 790 stations, with 4 to 14 Superchargers (Appendix E). Each of these stations is strategically located along the most travelled highways, allowing the drivers to travel with minimum stops. Nonetheless, Tesla will keep developing and expanding their Supercharger grid.
As for the destination chargers, these are in convenience and public sites, such as hotels, resorts and shopping centres. The investment in these chargers is also relevant, having now more than 7,110 wall connectors. The high rate of development of these charging alternatives changes the customer’s perception in terms of autonomy concerns, and therefore increases demand. To meet the residential customer’s charging needs, the Powerwall 2 was announced and became available in 2016, which includes an integrated inverter for residential applications.
5.2.2. The Gigafactory
The second largest building in the world with a production capacity of battery cells greater than the rest of the world is situated in Nevada and Tesla runs it. It is expected to be fully operational by 2020. For the time being, it produces the battery cells for the energy storage products and will oversee the production of the new Model 3 drive units (Appendix F). The reason for anticipating target production levels by two years, lies on the belief that this factory will drive production exponentially. It is a highly efficient manufacturing facility, allowing for Tesla to
24 benefit from scale economies and cost reductions up to 30% with the production of Model 3 (Annual Report 2016). The growing demand is taking Tesla to consider a second Gigafactory, forcing competitors to create alternatives, which for now are far from Tesla’s. As Vance (2015) refers, the other manufacturers are possibly seven years behind Tesla.
5.3. Ownership Structure
Since the IPO, Tesla has only offered common shares, and as of January 31st, 2017, there were 156.100.000 shares outstanding (Annual Report). Of these, 22% are shares held by All Insider and 5% Owners, leaving the rest of the shares in free float (Yahoo Finance). The latter comprises mostly Institutional and Mutual Fund Owners, with more than 100 million shares to trade. With such a number of shares in free float, and with a daily average of 5 million traded shares, it is believed that the shares are easily traded in the public market.
5.4. Financial Statement Analysis
The financial analysis of Tesla is based on the past six years, since 2010. As some of Tesla’s departments were created or grew very recently, the compounded growth rates are separated in two periods, one from 2010 and the other from 2014. The two departments that have a greater impact on this analysis are the “Automotive Leasing” and the “Energy Generation and Storage”, both having started their activity in 2014.
Income Statement, in thousands 2014 2015 2016
Total automotive revenue $ 3 007 012 $ 3 740 973 $ 6 350 766 100,7% 145,3%
% Sales Growth 56% 24% 70%
Total revenues $ 3 198 356 $ 4 046 025 $ 7 000 132 97,8% 147,9%
% Revenues Growth 59% 27% 73%
Total automotive cost of revenues $ (2 145 749) $ (2 823 302) $ (4 750 081) 97,5% 148,8%
% Cost Growth -45% -32% -68%
Total cost of revenues $ (2 316 685) $ (3 122 522) $ (5 400 875) 99,4% 152,7%
% of Total Cost Growth -49% -35% -73%
Gross profit $ 881 671 $ 923 503 $ 1 599 257 93,2% 134,7%
As a % of sales 28% 23% 23%
Total operating expenses $ (1 068 360) $ (1 640 132) $ (2 266 597) 52,9% 145,7% % Growth of Operating Expenses -106% -54% -38%
Income (loss) from operations (EBIT) $ (186 689) $ (716 629) $ (667 340) -28,7% -189,1%
% Growth -205% -284% 7%
Income (loss) before income taxes (EBT) $ (284 636) $ (875 624) $ (746 348) -30,1% -161,9%
% Growth of EBT -299% -208% 15%
Net Income (Loss) $ (294 040) $ (888 663) $ (773 046) -30,8% -162,1% % Growth of Net Income (Loss) -297% -202% 13%
CAGR (10-16)
CAGR (14-16)
25 Tesla has grown exponentially in the last years, since the IPO, with their revenues growing at a Compounded Annual Growth Rate (CAGR) of 97,8%. The greatest source of revenue is related to automotive sales, accounting for, on average, 86% of the revenues value. In 2016, the peak of the revenues was reached, having since 2010 a very high growth rate. The gross profit has increased by 73% from 2015, due to the significant increase in the automotive revenues (more than $2.5 billion). Despite these good results, being close to a completely vertically integrated company brings very high operating expenses with it. As Tesla have their own stores and have been developing alternative selling platforms, their Selling, general and administrative expenses represent almost the total amount of the Gross profit (~90% in 2016). Research and development is also important in the automotive, battery packs and solar energy segments, in order to keep up with the development of new technologies by their competitors. Consequently, Tesla’s operating expenses are consuming more than the gross profit of the exercise. These high operating costs have a negative impact on the EBIT, and consequently on the Net income. A negative trend can be seen in Net income since 2010. However, in 2013 and 2016 recorded the greatest increases in the value of absolute revenues in a greater proportion than the other revenue and operating costs.
The negative Net income has a significant impact on the Return on Equity (ROE). If it is a Net loss, the return will also be negative and will destroy value to the shareholders. The Profit margin has been negative since 2010 and it represents the main driver for the negative ROE.
Analysing the Balance Sheet, one can conclude that Tesla’s assets are mainly non-current. The net Property and the net Solar Energy Systems represent more than half of the total assets, with a value of almost $6 billion each. As Tesla is still in a steep growth stage, all the Balance Sheet accounts grew by a CAGR greater than 100%, the total shareholder’s equity having increased the most from 2015. As shown in the figure below, leverage increased significantly, especially in regard to the equity, with the debt being equivalent to 283% of the equity.
CAGR Var Balance Sheet, in thousands 2010 2011 2012 2013 2014 2015 2016 (10-16) (15-16)
Total Assets $ 386,082 $ 713,448 $ 1,114,190 $ 2,416,930 $ 5,830,667 $ 8,067,939 $ 22,664,076 197.14% 180.92% Total Liabilities $ 179,034 $ 489,403 $ 989,490 $ 1,749,810 $ 4,860,761 $ 6,936,950 $ 16,750,167 213.07% 141.46% Total Shareholder's Equity $ 207,048 $ 224,045 $ 124,700 $ 667,120 $ 969,906 $ 1,130,989 $ 5,913,909 174.84% 422.90% Debt/Assets 46% 69% 89% 72% 83% 86% 74% 108.08% -14.04% Debt/Equity 86% 218% 793% 262% 501% 613% 283% 121.87% -53.82% CAGR Var DuPont Analysis 2010 2011 2012 2013 2014 2015 2016 (10-16) (15-16) Profit Margin -158.97% -171.24% -102.73% -3.85% -9.78% -23.75% -12.17% 65.16% 48.76% Asset Turnover 25.14% 20.82% 34.62% 79.52% 51.57% 46.37% 28.02% 101.82% -71.98% Equity Multiplier 186.47% 318.44% 893.50% 362.29% 639.53% 744.48% 476.85% 116.94% -35.95% ROE -74.54% -113.55% -317.73% -11.09% -32.25% -82.00% -16.26% 77.59% 80.17%
26
6. Weighted Average Cost of Capital (WACC)
The WACC is a valuable tool, commonly accepted by countless authors, used to discount the cash flows. It reflects the investor’s expected compensation for the time value and risk related to Tesla’s equity and debt. Considering the after-tax cost of debt and Tesla’s capital structure, the WACC is equal to 8,52% (Appendix H).
6.1. Cost of Debt
The cost of debt is usually considered to be the yield to maturity on long-term option-free bonds for investment grade companies. The yield to maturity in Tesla’s case is distorted, since it only has short-term convertible bonds. As referred in Chapter 2, another approach is used to determine the cost of debt by calculating the credit spread above the risk-free rate. The latest change to the company’s rating was to a “B-” rating by S&P500 in 2014. This rating level suggests that the company has the necessary capabilities to meet financial commitments, even though it is vulnerable to adverse business and financial conditions. As concerns this rating, Damodaran (2014) assigns a credit spread of 5,5% for companies with market capitalization greater than USD 5 billion, that adjusted to the risk-free rate gives a total return on debt of 7,3%.
6.1.1. Effective Tax Rate
The tax benefit that comes with the payment of interest over existing debt should be considered when calculating the cost of debt as they will reduce tax liabilities. In this sense, the cost of debt used to calculate the WACC should be on an after-tax basis. The method used to calculate the tax rate goes in line with Damodaran (2012), who suggests using the actual statutory rate of the country of incorporation. The tax rate of 40% (KPMG 2017) in the U.S. would imply a reduction of the cost of debt to 4,38% (7,3% * (1 – 40%)).
6.2. Cost of Equity
The compensation for equity-holders is calculated through the CAPM. This formula is computed with the following inputs: the market risk-free rate, the systematic risk (Beta) and the equity risk premium.
27
6.2.1. Risk Free Rate
The risk-free rate considered for this analysis is the 10-year U.S. Treasury Bond. This riskless security is in a declining trend, and the maximum value was recorded in the most distant date from the period used. The rates have been registering historically low values, as seen below, being its minimum recorded on July 2016 with a value of 1,37%.
As of October 14th, 2016, the value of this rate was 1,8%, and since the rates are relatively low
regarding this period’s average (3,6%), a sensitivity analysis is necessary to account for possible changes in the rate affecting final price.
6.2.2. Systematic Risk
To measure the riskiness of Tesla’s shares compared to that of the market, a regression between the share and the market’s daily returns is made. The time frame used was two years, from
January 2nd, 2014 back to December 30th, 2016. If a longer period than the one considered was
used, the returns could not represent the future returns of a rapidly growing company as Tesla, and would be distorted by the recent financial crisis causing a bias in the beta calculation due to abnormally behaving stocks (Berk, DeMarzo, 2014). Regarding the market returns, two indexes were representative of the market in which Tesla competes. One if the S&P 500 Index that represents the 500 largest stocks in the U.S. market, where Tesla has the majority of its operations. The second index is the MSCI World Index (MSCI World, 2016), used to account for possible investment in risky shares outside of the country of incorporation. With these two indexes, it is considered that a representative set of data for the market is included in the
28 analysis. The betas were averaged and then adjusted, since in the long-run this value tends to 1. So, the following calculations were made:
𝑎𝑑𝑗𝑢𝑠𝑡𝑒𝑑 𝛽 = 2
3 ∗ (1,38) +
1
3∗ (1) = 1,25
6.2.3. Market Risk Premium
The investors use this return as a reference to know the premium they would require when investing in a company operating in the same market as Tesla. Results for this premium tend to vary according to the period chosen and the risk-free security. Damodaran has estimated in January 2017 the Total Equity Risk Premium for the U.S. market as 5,69%.
6.3. Capital Structure
The final stage in the process of determining the WACC lies in the estimation of the company’s target capital structure. The true market values of both Equity and Debt are unknown, so an approximation of the market values is used instead. Tesla has historically relied on equity financing, even though it has been changing since the IPO. The market value of Equity should be the product of the number of shares outstanding and the share price, adding the equity component of the convertible notes (Damodaran, 2012). With 156,100,000 shares outstanding and a share price of $196,51, the equity value from the shares accounts to $32,909,632,323.68. As for the option feature on the convertible senior notes, as convertible notes can be converted into a predetermined amount of the underlying company’s equity, adding to the previous value $205,013,000 (2018 note), $920,000,000 (2019 note) and $1,138,000,000 (2021 note), it results in a final Equity value of $35,414,645,323.68.
The Debt used to weigh the return required by investors should be the Net Debt (Damodaran, 2012). This value is calculated by the difference between Long-term Debt ($5,860,049,000), and its current portion of Debt ($984,211,000), and Cash and Cash Equivalents ($3,393,216,000). The outcome of these calculations results in a Debt value of $3,451,044,000. According to the capital structure, the current ratios for Debt and Equity are 9.42% and 90.58%, respectively.
29
7. Forecasting
In the forecasting exercise, there are two factors that make Tesla highly sensitive and challenging to predict, such as the historical negative cash flows and the young age of the company. The value of the company is mostly based on future predictions, raising the company’s value due to high probability of future creation. The forecasts in this chapter are mainly based on Tesla’s Annual Reports from 2016 and before (Appendix K).
The time frame to be used in the analysis has an important role in the future cash flow estimation. The changing point of the analysis will be when the company is assumed to have reached a steady state performance. Until this point the growth rates of the company will reflect some of Tesla’s predictions and expectations (Tesla Annual Report 2016), considering a constant growth for the terminal value, since the company is in a steady state. Tesla is more constrained by supply than demand, and therefore the explicit period should be long enough to allow for a balance between both. It is also unrealistic to assume that a company in a steady state grows more than the growth of the economy itself. Based on the conclusions from Chapter 5.2, the supply and the demand will only be balanced after 2020. Cheaper models, sufficient supply of battery cells with Gigafactory 1 fully operational, the Gigafactory 2 in Buffalo and new factories in Europe are the main reasons for a high growth in the next few years. Nonetheless, due to uncertainty constraints, two different growth periods will be considered: a high growth phase from 2016 up to 2020, when Tesla expects to have the Gigafactory fully operational, and a lower growth stage fading to the economy’s growth from 2020 to 2024, where it is assumed that Tesla is already firmly implemented in Europe and in Buffalo with its Gigafactory 2.
7.1. Revenues
The first item to be analysed in the income statement, which is the one with higher volume, is “Total Revenues”. In the past years, Tesla developed some new sources of revenue and the total amount is the sum of automotive revenues, leasing, energy generation and storage, and services and others. Thus, Tesla’s revenues have two main bases, automotive and energy generation and storage. The former includes the sales of their three models and regulatory credits to other manufacturers, while the latter includes the sale of solar energy systems, incentives and their leases, as well as energy storage products. Tesla sold 84.000 vehicles in 2016, an increase of 64% from 2015. It is estimated that around 20.000 Model X cars were sold in 2016, following the same behaviour of Model S’s growth on the first year after its introduction in the market.