D
packaging systems to
maximize quality
retention
and increase shelf life
of Pleurotus
This work was funded by Fundação para a Ciência e a Tecnologia (Portugal), and co-funded by Programa Operacional Potencial Humano (POPH), European Social Fund (ESF), via PhD grant SFRH/BD/38577/2007.
Acknowledgements
I acknowledge Fundação para a Ciência e a Tecnologia (FCT) for financial support through PhD grant SFRH/BD/38577/2007.
I wish to acknowledge to my supervisor, Dr. Luís M. Cunha, for receiving me in his laboratory over a decade ago and for motivating me to undertake this PhD project. To him I am grateful for the presentation of the initial thesis project proposal, for providing the conditions to develop my work in Vairão and in Ireland, for all the helpful support throughout these years and for being an inspiration with mathematical modelling and data analysis.
Thank you to my co-supervisor, Dr. Susana Fonseca for the friendship, assistance, thoughtful discussions and for the careful support on reviewing the thesis. Also acknowledge her support for providing all the conditions at IPVC´s laboratory, in Viana do Castelo, to perform the experimental work regarding the packaging validation experiments.
I would like to thank to Professor Jorge Oliveira and Dr. Pramod Mahajan for the kindness in receiving me at the Department of Process and Chemical Engineering, University College Cork, Cork, Ireland, where I performed an important part of my experimental work and for the assistance and guidance during my research. Thank you to the technicians from the Department for all the help during my Cork stages.
I also acknowledge to the ICETA team from project PROAMBIENTE - Dietas sustentáveis e de reduzido impacto ambiental para o linguado senegalês, for the research grant that helped me through difficult times.
A very special thanks to the late Professor Fernanda Oliveira, for the insightful discussion during the preparation of the thesis project proposal.
I acknowledge to Dr. Conceição Manso that had an important role during my previous MSc thesis.
A special thanks to Anna Carolina, Débora and Catarina for the enthusiasm showed during the lab work.
To MICOPLANT, Engº Pedro Capela and Engº Ricardo Lopes for providing mushrooms of excellent quality for experiments.
To Ana and Hernan for the good moments in Vairão and to Isabel Gomes for the care and friendship that had demonstrated.
I am very grateful to Dr Paulo Castro de Aguiar, for the kindness with which he received me and for being optimist with my modelling data.
To all my friends for the encouragement and all the assistance that provided me. Once again, thank you.
To my family for all the love, support and assistance in all these years.
June 2014
ABSTRACT
Development of packaging systems to maximize quality retention
and increase shelf life of Pleurotus mushrooms
Fresh horticultural commodities are excellent sources of vitamins, fiber and minerals for the human diet. They are also very perishable and highly dependent on the management of the postharvest environment surrounding the product. Therefore, quality maintenance over time relies on the success in the reduction of the physiological activity of the commodity.
Modified atmosphere packaging (MAP) used under strict temperature control is a postharvest technology that has been applied for many years in a wide range of commodities. MAP is known to directly affect commodity metabolism, with a positive effect on microbiological spoilage and, consequently, on the extension of the commodity shelf life.
MAP relies on the interplay between the respiration process of the product and the gas exchange through the package that contains the product. The movement of O2
and CO2 within the package creates a gradient that will, at equilibrium, lead to an
atmosphere composition considered optimal for the preservation of the product.
In mushrooms, postharvest biological changes are particularly fast. Mushrooms have high respiration rate, tends to lose moisture rapidly and gets discoloured at a very fast rate. Predicting the kinetics of respiration and transpiration rate of oyster mushrooms (Pleurotus ostreatus), as influenced by temperature, relative humidity and storage time, is important in order to overcome the lack of information regarding the effect of storage conditions on oyster mushroom quality.
The main aim of this work is to estimate the respiration rate (RR) and the transpiration rate (TR) of oyster mushrooms in order to evaluate the response of postharvest technologies such as reduced temperatures, modified atmosphere and moisture absorbers in the retention of their quality and, ultimately, contribute for the development of novel packaging strategies.
The respiration rate of oyster mushrooms was evaluated under different constant storage temperatures (2, 6, 10, 14 and 18 ºC) and the impact of each storage temperature on quality attributes such as colour, solid soluble content, electrolyte leakage and mass loss, directly linked to the commodity metabolism, was also determined. Herein, it is shown that time had a significant effect on the oyster mushroom RR, decreasing over time. Storage temperature also had a significant effect in mushrooms quality. A gradual yellowness and high mass losses were also found throughout storage life, with an increase rate as storage temperature increases. Results show the importance of low temperature on oyster mushroom quality retention. Furthermore, results show that, under the conditions tested, storage of fresh oyster mushrooms at 2 °C has the potential to increase shelf life.
Given that respiration rate is an important indicator of postharvest senescence, reliable predictions of respiration rates are critical for the development of Modified atmosphere packaging (MAP). To study the influence of storage time and temperature on the respiration rate, oyster mushrooms were stored at constant temperatures of 2, 6, 10, 14 and 18 °C under ambient atmosphere. Respiration rate data was measured with eight hour intervals up to 240 h. Again, a decrease of respiration rate was found after the cutting of the carpophores. Therefore, time effect on respiration rate was modelled using a first order decay model. The results also show the positive influence of low temperatures storage on mushroom respiration rate and the primary model explaining the effect of time on oyster mushroom’s RR also included the temperature dependence according to the Arrhenius equation. Moreover, the model included a parameter describing the decrease of the respiration rate, from the initial time until equilibrium. The overall model fitted well to the data and can be relevant for the choice of an appropriate packaging system for fresh oyster mushrooms.
Atmospheric composition (low O2 and high CO2) can affect respiration rate of
horticultural commodities. To assess the potential benefits of MAP, the RR of fresh oyster mushrooms was evaluated under different concentrations of O2 and CO2 at a
constant temperature (2 ºC) during storage. Six atmosphere were tested, according to a full factorial design, with 2 levels of O2 (2 and 15 % v/v) and 3 levels of CO2 (5, 10 or
20 % v/v) and with ambient air used as a control. Results showed that RR was affected by the conditions tested. Lower RR were found when mushroom were stored under 2 % O2 and 20 % CO2 (v/v), indicating that MAP under this levels may have potential in
increasing oyster mushroom shelf life. A response surface regression analysis was also used to determine the effect of O2 and CO2 on oyster mushrooms respiration rate.
Postharvest transpiration is also an important physiological process affecting storage life and overall quality. Although MAP of fresh produce can be used to restrain postharvest mass losses, its use in high metabolic products like mushrooms can lead to condensation inside the package, ultimately leading to quality losses and shelf-life shortening. Therefore, quantification of fresh produce transpiration rate (TR) and the use of predictive models could be useful to improve packaging design. To evaluate the impact of storage conditions (temperature and RH) on oyster mushroom transpiration rate over storage time, mushrooms were stored at 2, 6, 10, 14 and 18 °C and at 86, 96 and 100 % relative humidity (RH) under ambient atmosphere. Periodically, mushrooms mass losses were recorded over 248 h of storage. The results showed that both RH and temperature had a significant effect on oyster mushroom TR. Low temperatures and high RH decreases mass losses over storage time and therefore transpiration rate. An empirical mathematical model considering the effect of temperature and RH was developed. Temperature effect was explained using an Arrhenius model and the constants of the model were then fitted to linear equations to explain the effect of the relative humidity of storage on oyster mushrooms transpiration rate. The novel information obtained regarding oyster mushroom mass loss and the developed model may be useful for improving packaging design.
The usefulness of improving MAP of oyster mushrooms, by controlling the levels of moisture inside the package, was also tested using different mixtures of moisture absorbers in order to identify the mixture that matches the requirements of relative humidity inside oyster mushrooms package. Moisture holding capacity of the different mixtures was evaluated and a cubic model obtained. According to the model, a mixture containing 0.5, 0.26 and 0.24 (m/m) of calcium oxide, calcium chloride and sorbitol respectively yield a moisture holding capacity of 0.81 g water.g-1 desiccant and remains in powder form for at least 117 hours at 10 ºC presenting therefore, good perspectives for application of mixed desiccant for packaging of oyster mushrooms.
After gathering the necessary information regarding the Pleurotus metabolism and moisture holding capacity of the water absorber mixtures, a final validation experiment was developed. Locally grown oyster mushrooms were packaged in polystyrene trays and stored under different temperature regimes over a 240 h period.
Simulated commercial packages were compared with MAP and with MAP with moisture absorber obtained in the previous chapter. Levels of O2 and CO2 inside the
packages and quality evaluation that included both physical (visual appearance, mass loss, colour of the cap and texture) and chemical (pH, SSC) parameters were determined. Quality of oyster mushrooms was affected by storage time, package and temperature regime. Temperature profile significantly affected the quality of oyster mushrooms, with mushrooms maintained under abuse temperature showing a fast rate of quality loss regarding colour and texture alterations and mass loss. The addition of the moisture absorber limited some condensation on mushroom surface.
This thesis provides novel information regarding the most accurate strategies to maintain the quality of oyster mushrooms namely by adjusting the storage time, type of package and temperature. The usefulness of the results here presented is also expected to motivate the development of other species-specific preservation systems that might be important for mushrooms with commercial significance.
KEY-WORDS: Postharvest technology, modified atmosphere packaging, moisture
RESUMO
Desenvolvimento de sistemas de embalagem para maximizar a
retenção da qualidade e aumentar o tempo de vida útil de
cogumelos do género Pleurotus
Os produtos hortícolas frescos são excelentes fontes de vitaminas, fibras e minerais. Contudo, são muito perecíveis e muito dependentes do tipo de cuidados pós-colheita. Por conseguinte, a retenção da qualidade durante o armazenamento baseia-se principalmente no êxito na redução da atividade fisiológica do produto.
A embalagem em atmosfera modificada (EAM), utilizada sob rigoroso controlo de temperatura é uma tecnologia pós-colheita que tem sido aplicada desde há muitos anos numa vasta gama de produtos. A EAM é conhecida por afetar diretamente o metabolismo dos produtos hortícolas e pelo efeito positivo no controlo de microrganismos e, consequentemente, sobre a extensão da vida-útil do produto.
A EAM baseia-se na interação entre o processo de respiração do produto e a troca de gases através da embalagem que contém o produto. O movimento de O2 e
CO2 no interior da embalagem cria um gradiente gasoso que, no estado de equilíbrio,
origina uma composição da atmosfera considerada ideal para a conservação do produto.
A pós-colheita de cogumelos é caracterizada por mudanças biológicas particularmente rápidas. Os cogumelos têm alta taxa de respiração, perdem água rapidamente e sofrem alterações de cor a um ritmo muito rápido. A previsão das taxas de respiração e transpiração de repolga (Pleurotus ostreatus) e a influência da temperatura, humidade relativa e tempo de armazenamento é de extrema importância para colmatar, a falta de informação sobre as condições de armazenamento ótimas deste produto.
O principal objetivo do presente trabalho é estimar a taxa de respiração e a taxa de transpiração de Pleurotus, a fim de avaliar a resposta de tecnologias pós-colheita, tais como baixas temperaturas e atmosfera modificada na retenção da
qualidade e, assim contribuir para o desenvolvimento de novos sistemas de embalagem que aumentem o tempo de vida útil de cogumelos do género Pleurotus.
A taxa de respiração de Pleurotus foi avaliada sob diferentes temperaturas de armazenamento constantes (2, 6, 10, 14 e 18 ºC) e, o impacto da temperatura de armazenamento nos atributos de qualidade, tais como a cor, o teor em sólidos solúveis, a perda de eletrólitos e perda de massa, diretamente ligada ao metabolismo do cogumelo, também foi determinado. Quer o tempo de armazenamento quer a temperatura têm um efeito significativo na taxa de respiração do cogumelo que diminui com o tempo. A temperatura teve também influência na qualidade do cogumelo, especialmente no que se refere às perdas de massa obtidas e amarelecimento gradual do cogumelo. Os resultados mostram a importância da utilização de baixas temperaturas na retenção da qualidade do cogumelo. Além disso, os resultados demostram que, nas condições testadas, o armazenamento a 2 ºC pode aumentar a vida de útil do produto.
Tendo em conta que a taxa de respiração é um importante indicador de senescência pós colheita, as previsões das taxas de respiração são fatores críticos para o desenvolvimento de EAM. Para estudar a influência do tempo de armazenamento e da temperatura na taxa de respiração, os cogumelos foram armazenados a temperaturas constantes de 2, 6, 10, 14 e 18 ºC sob atmosfera ambiente. A taxa de respiração foi medida a cada oito horas até às 240 horas de armazenamento. Mais uma vez, verificou-se uma diminuição da taxa de respiração após o corte dos cogumelos. Como tal, o efeito do tempo na taxa de respiração de cogumelos foi modelado com uma cinética de primeira ordem. Os resultados mostram também o efeito positive das baixas temperaturas de armazenamento na taxa de respiração. Como tal, o modelo primário que explica o efeito do tempo na taxa de respiração incluiu também a dependência da temperatura de acordo com o modelo de Arrhenius. O modelo final inclui ainda um parâmetro que descreve a redução da taxa de respiração a partir do momento inicial, até ao equilíbrio. O modelo global ajustou-se bem aos dados e pode ser relevante para a escolha adequada de um sistema de embalagem para Pleurotos frescos.
A composição da atmosfera dentro da embalagem (níveis baixos de O2 e altos
de CO2) pode também afetar a taxa de respiração de produtos hortícolas. Para avaliar
avaliada sob diferentes concentrações de O2 e CO2 a uma temperatura constante de 2
ºC. Foram testadas seis atmosferas, de acordo com um delineamento fatorial completo, com 2 níveis de O2 (2 e 15 % v/v) e três níveis de CO2 (5, 10 ou 20 % v/v) e
com o ar ambiente, utilizado como controlo. Os resultados mostraram que a taxa de respiração foi afetada pelas condições testadas. A taxa de respiração mais baixa foi observada para cogumelos armazenados a 2 % O2 e 20 % de CO2 (v/v), o que indica
que a utilização destes níveis de O2 e CO2 pode ter efeitos positives no aumento da
vida útil do produto.
A perda de água ou transpiração pós-colheita é também um processo fisiológico importante que afeta o tempo de armazenamento e a qualidade global do produto. Embora o uso de EAM possa restringir a perda de massa, a sua utilização em produtos de elevada taxa metabólico, como o cogumelo pode originar condensação no interior da embalagem, levando a perdas de qualidade e redução de vida útil. Portanto, a quantificação da taxa de transpiração e a utilização de modelos de previsão pode ser útil para melhorar o desenho da embalagem. Para avaliar o impacto das condições de armazenamento (temperatura e humidade relativa) na taxa de transpiração de cogumelos ao longo do tempo de armazenamento, estes foram armazenadas a 2, 6, 10, 14 e 18 ° C e a 86, 96 e 100% de humidade relativa em atmosfera ambiente. Periodicamente, as perdas de massa foram registadas durante um período máximo de 248 horas. Os resultados mostraram que quer a temperatura, quer a humidade relativa tiveram um efeito significativo sobre a taxa de transpiração. As baixas temperaturas e altas humidades relativas diminuíram as perdas de massa ao longo do tempo de armazenamento e, portanto, a taxa de transpiração. Um modelo matemático empírico considerando o efeito da temperatura e HR foi desenvolvido. O efeito da temperatura foi modelado através de uma equação de Arrhenius e as constantes do modelo foram modeladas com equações lineares para explicar o efeito da humidade relativa na taxa de transpiração de Pleurotus. As informações obtidas sobre a perda de massa de cogumelos e, consequentemente o modelo desenvolvido podem ser úteis para melhorar o desenho da embalagem para este produto.
A utilização de absorvedores de humidade para controlar os níveis de água dentro da embalagem foi também considerada. Para o efeito, avaliou-se a capacidade de retenção de água das diferentes misturas e obteve-se um modelo cúbico. De acordo com o modelo, uma mistura contendo 0.5, 0.26 e 0.24 (m/m) de óxido de cálcio, cloreto de cálcio e de sorbitol, respetivamente possui uma capacidade de
retenção de água de 0.81 gágua.g-1, permanecendo na forma de pó durante pelo menos
117 horas a 10ºC. Por conseguinte, os resultados apresentam boas perspetivas para aplicação de um absorvedor de humidade para embalagem de Pleurotus.
Depois de reunir as informações necessárias sobre o metabolismo de Pleurotus e da capacidade de absorção de água das misturas de dissecantes consideradas, a experiência final foi desenvolvida para validar uma embalagem para o armazenamento de cogumelo. Para o efeito, Pleurotus cultivados localmente foram embalados em bandejas de poliestireno e armazenadas sob diferentes regimes de temperatura por um período de 240 horas. As embalagens comerciais foram comparadas com as embalagens com modificação da atmosfera e com embalagens com modificação da atmosfera e absorvedor de humidade obtido no capítulo anterior. Os níveis de O2 e CO2 no interior da embalagem e a avaliação da qualidade, que
incluiu parâmetros físicos (aparência visual, perda de massa, cor e textura) físicos e química (pH e teor em sólidos solúveis) foram determinados. A qualidade dos cogumelos foi afetada pelo tempo de armazenamento, pelo tipo de embalagem e pelo perfil de temperatura. A temperatura afetou significativamente a qualidade dos cogumelos, com estes mantidos sob temperaturas de abuso com perdas rápidas de qualidade no que se refere à cor, textura e perda de massa. A adição do absorvedor de humidade permitiu controlar de alguma forma a ocorrência de condensação na superfície do cogumelo.
Esta tese fornece novas informações sobre as estratégias mais precisas para manter a qualidade de cogumelos ostra nomeadamente ajustando o tempo de armazenamento, do tipo de embalagem e da temperatura. A utilidade dos resultados aqui apresentados também é esperado para motivar o desenvolvimento de outros sistemas de preservação específica de espécies que podem ser importantes para cogumelos com significado comercial.
PALAVRAS-CHAVE: Tecnologia pós-colheita, embalagem em atmosfera modificada,
Absorvedor de humidade, Pleurotus ostreatus, perda de massa, modelação matemática.
Table of Contents
Acknowledgements ... iii
Table of Contents ... xiii
List of Tables ... xvii
List of Figures ... xviii
List of Symbols ... xxii
List of Abbreviations ... xxv
List of Equations ... xxvii
PART I -Thesis Framework ... 31
Chapter 1: General introduction ... 33
1.1. The importance of postharvest preservation ... 35
1.2. The relevance of mushrooms in human diet and health ... 36
1.3. Postharvest quality of fresh mushrooms ... 37
1.4. Research objectives ... 39
1.5. Thesis structure ... 40
Chapter 2: State of the art ... 43
2.1. Mushrooms taxonomy, morphology, cultivation, nutritional and medicinal properties and world production ... 45
2.1.1. Mushrooms taxonomy and morphology ... 45
2.1.2. History of mushroom cultivation ... 50
2.1.3. Mushroom nutritional composition ... 51
2.1.3.1. Moisture content ... 51 2.1.3.2. Carbohydrate content ... 52 2.1.3.3. Protein content ... 52 2.1.3.4. Fat content ... 53 2.1.3.5. Mineral content ... 53 2.1.3.6. Vitamin content ... 54 2.1.3.7. Energy content ... 54
2.1.4. Health promoting properties of mushrooms ... 54
2.1.4.1. Antioxidant activity ... 55
2.1.4.2. Antimicrobial and antiviral activity ... 55
2.1.4.3. Hypoglycaemic activity ... 56
2.1.4.5. Anti-Inflammatory ... 56
2.1.5. Worldwide mushroom production ... 56
2.2. Main physiological processes responsible for quality deterioration in fresh commodities ... 60
2.2.1. Respiratory metabolism ... 60
2.2.2. Factors affecting respiration rate ... 62
2.2.2.1. Commodity related factors ... 62
2.2.2.2. Time after harvesting or processing ... 63
2.2.2.3. Environmental factors: temperature and atmospheric composition ... 64
2.2.2.4. Mathematical modelling of respiration rate ... 65
2.2.3. Transpiration or moisture loss ... 67
2.2.3.1. Factors affecting transpiration ... 69
2.2.3.1.1. Commodity related factors ... 69
2.2.3.1.2. Environmental factors ... 70
2.3. Postharvest deteriorative changes in mushrooms ... 71
2.3.1. Colour changes ... 71
2.3.2. Textural changes ... 72
2.3.3. Mass loss ... 73
2.3.4. Microbiological spoilage ... 74
2.4. Postharvest technologies to extend the shelf life of fresh produce ... 77
2.4.1. Temperature and relative humidity control ... 77
2.4.2. Packaging systems ... 80
2.4.2.1. Modified atmosphere packaging ... 80
2.4.2.2. Controlling humidity inside fresh produce package ... 86
PART II- Experimental work ... 89
Chapter 3: Influence of storage conditions on the shelf life of fresh oyster mushrooms ... 91
3.1. Introduction ... 93
3.2. Material and methods ... 94
3.2.1. Sample preparation ... 94
3.2.2. Experimental procedure ... 94
3.2.3. Respiration rate measurement ... 94
3.2.4. Quality indicators analysis ... 96
3.2.5. Data analysis ... 97
3.4. Conclusions ... 110
Chapter 4: Modelling the influence of time and temperature on the respiration rate of fresh oyster mushrooms ... 113
4.1. Introduction ... 115
4.2. Material and methods ... 116
4.2.1. Sample preparation ... 116
4.2.2. Respiration rate measurement ... 117
4.2.3. Data analysis ... 118
4.3. Results and discussion ... 118
4.3.1. Respiration rate of fresh oyster mushrooms at ambient air ... 118
4.3.2. Effect of time on respiration rate ... 121
4.3.3. Effect of temperature on respiration rate ... 123
4.3.4. Overall model ... 125
4.4. Conclusions ... 132
Chapter 5: Influence of gas composition on the respiration rate of fresh oyster mushrooms ... 133
5.1. Introduction ... 135
5.2. Material and methods ... 136
5.2.1. Sample preparation and experimental procedure ... 136
5.2.2. Respiration rate measurement ... 136
5.2.3. Data analysis ... 137
5.3. Results and discussion ... 137
5.4. Conclusions ... 140
Chapter 6: Modelling the influence of time, temperature and relative humidity conditions on the mass loss of fresh oyster mushrooms ... 141
6.1. Introduction ... 143
6.2. Material and methods ... 144
6.2.1. Sample preparation ... 144
6.2.2. Transpiration rate measurement ... 145
6.2.3. Data analysis ... 145
6.3. Results and discussion ... 146
6.3.1. Mass loss of oyster mushroom ... 146
6.3.2. Effect of temperature... 149
6.3.3. Combined effect of temperature and relative humidity ... 151
6.4. Conclusions ... 155
7.1. Introduction ... 159
7.2. Material and Methods ... 160
7.2.1. Measurement of the moisture holding capacity of the desiccant ... 160
7.2.2. Statistical analysis ... 162
7.3. Results and discussion ... 162
7.4. Conclusions ... 167
Chapter 8: Influence of modified atmosphere packaging and moisture absorber on the quality of fresh oyster mushrooms as affected by storage temperature ... 169
8.1. Introduction ... 171
8.2. Material and Methods ... 172
8.2.1. Sample preparation ... 172
8.2.2. Experimental procedure ... 172
8.2.3. Headspace gas composition ... 174
8.2.4. Quality indicators ... 174
8.2.5. Statistical analysis ... 175
8.3. Results and discussion ... 176
8.3.1. Atmosphere composition inside the package ... 176
8.3.2. Quality indicators ... 177
8.4. Conclusions ... 192
PART III - General conclusions and suggestions for future work ... 195
Chapter 9: General conclusions and suggestions for future work ... 197
9.1. General conclusions ... 199
9.2. Suggestions for future work ... 203
List of publications and communications based on thesis work ... 205
References ... 209
Appendices ... 235
Appendix A: CIE L*a*b* colour parameters ... 237
Appendix B: Supplementary material pertaining to Chapter 3. ... 238
Appendix C: Supplementary material pertaining to Chapter 4. ... 250
Appendix D: Supplementary material pertaining to Chapter 7. ... 252
List of Tables
Tab. 2.1 - Taxonomy of the main mushroom species cultivated. ... 47 Tab. 2.2 – General characteristics of P. ostreatus. ... 49 Tab. 2.3 - Variable involved in MAP design. ... 82 Tab. 3.1 - Soluble solid content (ºBrix) (mean ± SE) of Pleurotus ostreatus mushrooms stored at 2, 6, 10, 14 and 18 ºC for 96 hours. ... 105 Tab. 3.2 – Relative electrolyte leakage (%) (Mean ± SE) of Pleurotus ostreatus mushrooms stored at 2, 6, 10, 14 and 18 ºC for 96 hours. ... 107 Tab. 4.1 - Constant estimates (± SE) of the first order decay model describing the effect of time on respiration rate of fresh oyster mushrooms, according Eq. 4.3.122 Tab. 4.2 – Model parameter estimates of the global model, obtained to predict the effect of time and temperature on oyster mushrooms respiration rate, according with Eq. 4.9. ... 127 Tab. 4.3 – Correlations of model parameters estimates obtained to predict the effect of time and temperature on fresh oyster mushrooms O2 consumption rate, according
with Eq. 4.9. ... 127 Tab. 6.1 – Transpiration rate (g.kg-1.h-1) (mean ± SE) of oyster mushrooms stored at 2,
6, 10, 14 and 18 ºC and 86, 96 and 100 % RH. ... 147 Tab. 6.2 - Constant estimates (± SE) (k and apparent activation energy) of the Arrhenius type model (Eq. 6.1). ... 150 Tab. 6.3 – Constant of the global model (Eq. 6.4) obtained to predict the effect of temperature and relative humidity in oyster mushroom transpiration rate. ... 152 Tab. 7.1 - Proportion of components used in each mixture of desiccant... 161 Tab. 7.2 – Moisture holding capacity (g water. g−1 desiccant) of mixed desiccant at 117
hours. ... 163 Tab. 7.3 - Coefficients and respective standard errors of the cubic model (Eq. 7.2). . 165 Tab. 7.4 - Analysis of variance of the cubic model (Eq. 7.2). ... 166 Tab. 8.1 - Evolution of O2 and CO2 in Pleurotus mushroom stored under different
storage conditions. Values are the mean (± SE) of 3 packages. ... 176 Tab. 8.2 – Evolution of the scores of Pleurotus mushroom stored under different storage conditions. ... 191
List of Figures
Fig. 1.1 - Schematic representation of the thesis outline. ... 41
Fig. 2.1 - Mushroom structure. ... 46
Fig. 2.2 - Aspect of some important oyster mushroom species. ... 48
Fig. 2.3 – Visual aspect of Pleurotus ostreatus mushrooms. ... 50
Fig. 2.4 - Evolution of world production of mushrooms and truffles. ... 57
Fig. 2.5 - Production of leading producing countries of mushrooms and truffles in 2011. ... 57
Fig. 2.6 - European mushroom and truffles producers and their outputs in 2011. ... 58
Fig. 2.7 - Production of cultivated mushrooms and truffles in Portugal, from 1981 to 2011. ... 59
Fig. 3.1 - Changes in (a) RRO2 (mL.kg-1.h-1) (b), RRCO2 (mL.kg-1.h-1) and (c)RQ of Pleurotus ostreatus mushrooms over time stored at 2, 6, 10, 14 and 18 °C. Each point represents the mean of three replicates and vertical bars represent the standard error of the mean. □: 2ºC; ▲: 6ºC; ○:10ºC; :14ºC; : 18ºC. Dotted interpolation lines added for easiness in reading. ... 99
Fig. 3.2 - Evolution of CIE L*a*b* parameters, C*, Hº, browning index, total lightness and total colour differences of Pleurotus ostreatus mushrooms over time stored at 2, 6, 10, 14 and 18 °C. Each point represents the mean of three replicates and vertical bars represent SE. □: 2ºC; ▲: 6ºC; ○:10ºC; :14ºC; : 18ºC. Dotted interpolation lines added for easiness in reading. ... 102
Fig. 3.3 - Evolution of mass loss of Pleurotus ostreatus, during storage at 2, 6, 10, 14 and 18 °C. Dots are the mean of ten replicates and vertical bar represent SE. □: 2ºC; ▲: 6ºC; ○:10ºC; :14ºC; : 18ºC . Dotted interpolation lines added for easiness in reading. ... 108
Fig. 4.1 - Evolution of a) RRO2 and b) RRCO2 (mL.kg-1.h-1) of oyster mushrooms stored at various constant temperatures under ambient air. Symbols represent the mean of 3 replicates and bars represent the standard error of the mean (□- 2 ºC; ▲- 6 ºC; ○-10 ºC; -14 ºC; - 18 ºC). ... 119
Fig. 4.2 – Respiration rate of oyster mushrooms stored under ambient air at 2ºC (□) and 18ºC (). The symbols represent the respiration rate data, vertical bars represent standard deviation and the dot and slash line represents the individual of the individual model according with Eq. 4.3. ... 122
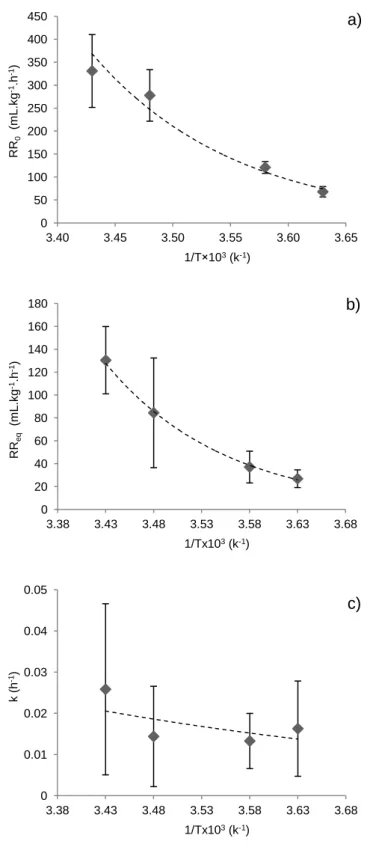
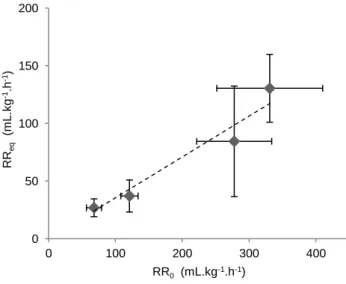
Fig. 4.3 - Dependence on temperature of the first order decay model parameters: a) RR0, ref (mL.kg-1.h-1); b) RReq,ref (mL.kg-1.h-1) and c) kref (h-1). The dots represent the individual estimates and the bars represent the asymptotic 95 % confidence intervals (Cunha et al., 2006) and the lines represent the fit of the model, according with Eqs. 4.4, 4.5 and 4.6, respectively. ... 124 Fig. 4.4 - Relationship between individual parameter estimates of the initial respiration rate (RR0) and respiration rate at equilibrium (RReq) at each temperatures used for
confidence intervals. Dotted line represents the linear fit between RR0 andRReq
(R2=0.940). ... 125 Fig. 4.5 –Respiration rate of oyster mushrooms at different constant temperatures under ambient air. Symbols depict the O2 consumption rates data as calculated
with Eq. 4.2 and vertical bars represent standard error for: a) 2 ºC; b) 6 ºC; c) 10 ºC; d) 14 ºC; e) 18 ºC). Lines (- - - and ---) represent the fit of the individual (Eq. 4.3) and global model (Eq. 4.9), respectively. Long lash dot line on Figure 5c represents the predicted O2 consumption rate with time at 10 ºC according to the
global model (Eq. 4.9). ... 128 Fig. 4.6 - Relationship between experimental and predicted O2 consumption rates using
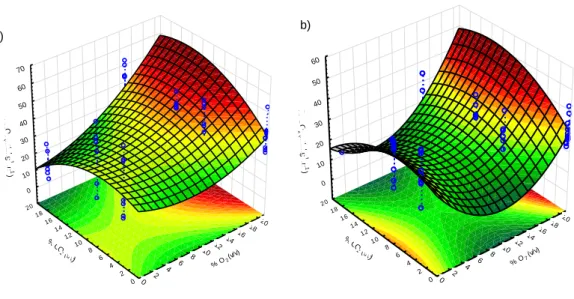
the first decay model and assuming an Arrhenius type dependence of the model parameters on temperature (global model – Eq. 4.9). Enclosed figures represent the residual versus predicted values (top corner) and the frequency distribution of residuals, with __ representing the expected normal distribution (bottom corner). ... 130 Fig. 5.1 – Oxygen consumption ( ) and CO2 production rate ( ) (mL.kg-1.h-1) of oyster mushrooms stored in different O2 and CO2 concentrations at 2 °C. Vertical bars
represent SE. ... 138 Fig. 5.3 – Response surface modelling for the effect of O2 and CO2 on oyster
mushrooms respiration rate, according with Eqs. 5.1 and 5.2... 140 Fig. 6.1 – Changes in mass loss (M/M0) of oyster mushrooms stored at 2 ºC over time.
The values were normalized with respect to the initial mass of mushroom (M0). Each point represents the mean of eight replicates. Vertical bars represent the standard error of the mean. □- 86 % RH; ▲- 96 % RH; ○- 100 % RH. ... 146 Fig. 6.2 – Effect of temperature on oyster mushrooms transpiration rate (g.kg-1 .h-1) stored at 96 % RH. Points are the mean of eight replicates, vertical bars represent the standard error of the mean and the line represents the fit of the primary model, according with Eq. 6.1. ... 150 Fig. 6.3 – Effect of RH of the storage environment on the parameters of the Arrhenius model, (a) EaTR (kJ.mol-1), and (b) k (h-1). The symbols represent the estimates of
the individual model parameters, the bars represent the 95 % asymptotic confidence intervals and the lines represent the fit of the model (Eq. 6.2 and 6.3, respectively). ... 151 Fig. 6.4 - Relationship between transformed -natural logarithm- experimental (TRexp) and predicted (TRpred) transpiration rates, following Equation 6.4. Enclosed figures represent the residuals versus predicted values (top corner) and the frequency distribution of residuals with the solid line representing the expected normal distribution (bottom corner). ... 153 Fig. 6.5 – Response surface model for the effect of temperature (ºC) and relative humidity (%) on oyster mushrooms transpiration rate (g.kg-1.h-1), according with
Equation 6.4. ... 154 Fig. 7.1 – Experimental setup used to: (a) hold moisture absorber and of (b) the plastic trays used to hold each mixture. ... 161
Fig. 7.2 - Standardized Pareto chart accounting for the effect of each of the individual components and the mixing component in the total moisture holding capacity. The dashed vertical line corresponds to the 95 % confidence limits. ... 164 Fig. 7.3 - Contour plot for accounting the effect of each of the individual components and the mixing component in the total moisture holding capacity. The dashed vertical line corresponds to the 95 % confidence limits. ... 164 Fig. 8.1 – Examples of the packages used in the experiment. Commercial package; modified atmosphere package and modified atmosphere package with moisture absorber, respectively. ... 173 Fig. 8.2 - Temperature history of the storage ambient temperatures for the two temperature profile (I being constant and II with abuse of temperature). ... 173 Fig. 8.3 - Evolution of L* parameter of Pleurotus mushroom stored under different storage conditions (dots are the mean of 30 replicates and bars are standard error of mean). ... 177 Fig. 8.4 - Evolution of a* parameter of Pleurotus mushroom stored under different storage conditions (dots are the mean of 30 replicates and bars are standard error of mean). ... 179 Fig. 8.5 - Evolution of b* parameter of Pleurotus mushroom stored under different storage conditions (dots are the mean of 30 replicates and bars are standard error of mean). ... 179 Fig. 8.6 - Evolution of BI parameter of Pleurotus mushroom stored under different storage conditions (dots are the mean of 30 replicates and bars are standard error of mean). ... 180 Fig. 8.7 - Evolution of C*of Pleurotus mushroom stored under different storage conditions (dots are the mean of 30 replicates and bars are standard error of mean). ... 182 Fig. 8.8 - Evolution of hue values of Pleurotus mushroom stored under different storage conditions (dots are the mean of 30 replicates and bars are standard error of mean). ... 182 Fig. 8.9 - Evolution of firmness of Pleurotus mushroom stored under different storage conditions (dots are the mean of 30 replicates and bars are standard error of mean). ... 184 Fig. 8.10 - Evolution of resilience of Pleurotus mushroom stored under different storage conditions (dots are the mean of 30 replicates and bars are standard error of mean). ... 185 Fig. 8.11 - Evolution of cohesiveness of Pleurotus mushroom stored under different storage conditions (dots are the mean of 30 replicates and bars are standard error of mean). ... 185 Fig. 8.12 - Evolution of SSC of Pleurotus mushroom stored under different storage conditions (dots are the mean of 3 replicates and bars are standard error of mean). ... 187 Fig. 8.13 - Evolution of pH of Pleurotus mushroom stored under different storage conditions (dots are the mean of 3 replicates and bars are standard error of mean). ... 187
Fig. 8.14 - Evolution of mass loss of Pleurotus mushroom stored under different storage conditions (dots are the mean of 3 replicates and bars are standard error of mean). ... 189
List of Symbols
Symbol Designation Unity
a* CIE L*a*b* colour parameter (red/green) Dimensionless
aEa Model parameter (Eq. 6.4) kJ.mol-1
ak Model parameter (Eq. 6.4) h-1
b* CIE L*a*b* colour parameter (yellow/blue) Dimensionless
bEa Model parameter (Eq. 6.4) kJ.mol-1
bk Model parameter (Eq. 6.4) h-1
C* Chroma, colour parameter Dimensionless
C
1 Conductivity after 1 minute µs
C
1 Total Conductivity µs
C
60 Conductivity after 60 minutes µs
Ea Activation energy kJ.mol-1
Ea
K Activation energy for kinetic constant kJ.mol
-1
Ea
RR0 Activation energy for initial respiration rate kJ.mol -1
Ea
RReq Activation energy for equilibrium respiration
rate
kJ.mol-1 Ea
RR Activation energy for respiration rate KJ.mol
-1
Ea
TR Activation energy for transpiration rate KJ.mol -1
Ho Hue angle, colour parameter Dimensionless
k Kinetic constant h-1
k Overall transpiration coefficient mg.s-1.kg.kPa or mg.
s-1
.m2.kPa L* Lightness, CIE L*a*b* colour parameter
(Black/white)
Dimensionless
M Mass, product mass kg or g
ṁ Rate of moisture loss mg.s-1 or mg.s-1.m2
M
i Initial mass g
ML Mass loss %
MHC Moisture holding capacity gwater.g−1
P∞ Water vapour pressure close to the product
surface
kPa
P
s Water vapour pressure at evaporating surface kPa
Q
10 Respiration rate increase for a 10 ºC increase
rise
Dimensionless
R Ideal gas constant kJ.mol-1.K-1
RQ Respiratory quotient Dimensionless
RR Respiration rate mL.kg-1.h-1
RR*
O2 Respiration rate estimated mL.kg
-1.h-1
RR
0 Respiration rate at time 0 mL.kg
-1
.h-1 RR
0,ref Initial respiration rate at reference temperature mL.kg -1.h-1
RR
CO2 Rate of CO2 production mL.kg
-1.h-1
RR
eq Respiration rate at equilibrium mL.kg
-1.h-1
RR
eq,ref Respiration rate at equilibrium at reference
temperature mL.kg-1.h-1 RR O2 Rate of O2 consumption mL.kg -1.h-1 RR
T,t Respiration rate at a given time and
temperature mL.kg-1.h-1 T Temperature ˚C or K t Time h TR Transpiration rate g.kg-1.h-1 T
ref Reference temperature K
TR
ref Transpiration rate at reference temperature g.kg -1.h-1 V Volume m-3 V f Free volume m -3 C 2 Variation of CO2 % (v/v) 2 Variation of O2 % (v/v) Variation of time h
α1 Model parameter (Eq. 7.2) Dimensionless
α12 Model parameter (Eq. 7.2) Dimensionless
α123 Model parameter (Eq. 7.2) Dimensionless
α13 Model parameter (Eq. 7.2) Dimensionless
α2 Model parameter (Eq. 7.2) Dimensionless
α23 Model parameter (Eq. 7.2) Dimensionless
α3 Model parameter (Eq. 7.2) Dimensionless
ρ Commodity apparent density kg.m-3
List of Abbreviations
AA Ascorbic acid
AC After Christ
ACE Angiotensin-I converting enzyme
acetyl-CoA Acetyl coenzyme A
ANOVA Analysis of variance
ATP Adenosine triphosphate
BC Before Christ
BI Browning index
CFU Colony forming units
CI Confidence interval
CIE Commission internationale de l'éclairage COTR Carbon dioxide transmission rate
DW Dry weight
EMAP Equilibrium modified atmosphere packaging EMP Glycolysis or Embeden-Meyerhof-Parnas pathway FAO/WHO Food and Agricultural Organization/World Health
Organization
FAOSTAT Statistic division of Food and Agricultural Organization
FW Fresh weight
IPRH In-pack relative humidity LDPE Low-density polyethylene films
MA Modified atmosphere
MAP Modified atmosphere packaging
MHC Moisture holding capacity
MHP Modified-humidity packaging
n Number
NAD Nicotinamide adenine dinucleotide
SSC Solid soluble content
p Significance level
PM-MAP Perforation-mediated modified atmosphere packaging
PP Polypropylene
PS Polystyrene
PVC Polyvinyl chloride
R2 Coefficient of determination
R2 Adj Adjusted coefficient of determination REL Relative electrolyte leakage
RH Relative humidity
RQ Respiration quotient
RR Respiration rate
SD Standard deviation
SE Standard error
TCD Total colour difference
TL Total lightness
TR Transpiration rate
WVP Water vapour pressure
WVPD Water vapour pressure deficit WVTR Water vapour transmission rate
List of Equations
C6H12 6 6 2 6C 2 6H2 36 Eq. 2.1 m s ∞ Eq. 2.2 RR 2 2 f t 100 Eq. 3.1 RRC 2 C 2 f t 100 Eq. 3.2 f ρ Eq. 3.3 R RRC 2 RR 2Eq. 3.4 C a 2 b 2 12 Eq. 3.5 H° arct b a Eq. 3.6 2 1 2 Eq. 3.7 CD 2 a 2 b 2 1 2 Eq. 3.8 100 0.31 0.1 Eq. 3.9 a 1. .6 a 3.012b Eq. 3.10 RE C60 C1 C 100 Eq. 3.11
i t i 100 Eq. 3.12 RR 2
RRC 2 0.83 Eq. 4.1 RR RR 2 RR 2 2 Eq. 4.2 RR RRe RR0 RRe e p ( t) Eq. 4.3 RR0 RR0 ref e p EaRRoR 1 1 ref Eq. 4.4 RRe RRe ref e p EaRRe R 1 1 ref Eq. 4.5 ref e p Ea R Eq. 4.6 RRe
RR0 Eq. 4.7 RR RRe ref e p EaRRe R 1 1 ref RR0 ref e p EaRR0 R 1 1 ref RRe ref e p EaRRe R 1 1 ref e p ref e p Ea R 1 1 ref t Eq. 4.8 RR t RR0 ref e p EaRR R 1 1 ref
1
e p ref e p Ea R 1 1 ref t Eq. 4.9 RR 2 28.2 1. 2 1. 1 C 2 0.09 2 2 0.09 2 C 2 0.11 C 2 2 Eq. 5.1RRC 2 28.30 .2 2 1. C 2 0.20 2 2 0.0 2 C 2 0.11 C 2 2 Eq. 5.2 R e p Ea RR0 1 1 ref Eq. 6.1 a b RH Eq. 6.2
Ea
Ra
Eab
EaRH
Eq. 6.3ln R ln a
- b
RH -
aEa bEa RH R 1-
1 refEq. 6.4 HC t i i Eq. 7.1 HC α1 α2 α3C α12 α13 C α23 C α123 C Eq. 7.2
1.1. The importance of postharvest preservation
Fresh horticultural commodities are fundamental components in a balanced healthy diet, providing vitamins, minerals and phytochemicals. Additionally, horticultural commodities are recommended as a source of dietary fibber (Slavin and Lloyd, 2012).
Harvested horticultural products remain as living tissues subject to continuous metabolism. Before harvesting, when horticultural commodities are attached to the parent plant, losses of substrates and moisture due to respiration and transpiration are replaced. After harvest, however losses are not replaced and quality declines, limiting horticultural commodities shelf life.
Respiration involves a chain of oxidation–reduction reactions, each of which is catalysed by specific enzymes which brea s down or anic reserves to simpler molecules releasing energy used for other metabolic processes of the cell (Kays, 1991; Fonseca et al., 2002a). An inverse relation exists between respiration rate and storage life- higher respiration rates are associated with higher deterioration of commodities and consequently lower storage life (Brash et al., 1995).
Moisture loss by transpiration in fresh products is associated with mass and quality losses and it is assumed to be a major cause of postharvest loss in some commodities such as leafy vegetables or citrus fruits (Ben-Yehoshua, 1969).
The goal of postharvest techniques is to maintain the level of quality found at harvest, so proper storage conditions are key factors to maintain maximum quality. One of the most important approaches for overall quality retention is proper control of temperature and relative humidity in the storage environment (Kader, 2002).
Although the management of temperature and relative humidity have a well-known positive effect, other hurdles may be used to obtain maximum quality. The low levels of O2 and the high levels of CO2 in modified atmospheres can potentially
reduce respiration rate, ethylene sensitivity and production, decay and physiological changes, namely oxidation, with the resultant benefit of extending the storage life of the fresh produce (Kader, 1987).
The selection of the best storage conditions for a particular commodity helps to reduce postharvest losses, optimizing quality and maintaining fresh appearance and nutritional quality.
1.2. The relevance of mushrooms in human diet and health
In recent years, demand for fresh mushrooms is increasing due to their organoleptic, nutritional and pharmacological properties. The total number of species of mushrooms has been estimated as reaching about 140.000, though only a small fraction (10%) are currently known (Wasser, 2002).
The inclusion of mushrooms in human diet is a long lasting story as a key source of nutrients and proteins. Judging from archaeological finds, mushrooms and other fungi have been used since before recorded history (Moore and Chiu, 2001).
Several studies have been demonstrated that mushrooms have a high protein and carbohydrate content, low fat and many minerals and vitamins (Mattila et al., 2001; Cohen et al., 2002; Phillips et al., 2012) indicating a balanced food that might have had an important role in human diet during evolution. In addition to their nutritional value, a significant role in human health is well supported by scientific research. Mushrooms protect human cells against oxidative damage (Yildirim et al., 2012), enhance the immune response in the anti-inflammatory process (Jedinak et al., 2011), protect against cardiovascular disease (Martin, 2010) and diabetes mellitus (Lo and Wasser, 2011), two of the most common human diseases. As well, mushrooms have antibacterial activity (Singdevsachan et al., 2013) and perhaps the most promising therapeutic application of edible mushrooms is related with cancer prevention (Xu et al., 2012). For example, the role of mushrooms in reducing cellular proliferation in human breast cancer cells was established recently (Martin and Brophy, 2010). Such a broad therapeutic spectrum deserves further investigation and, in parallel, the inclusion of this food in human diet should continue to be recommended.
One of the most common specie of mushrooms that are commercially available is Pleurotus ostreatus. The fruit bodies of Pleurotus species are considered a delicacy because of their flavour properties (Bano et al., 1988). This species presents a high
nutritional value and is especially effective against cancer cell proliferation (Martin and Brophy, 2010).
Aside from nutritive and medicinal values (Jedinak and Sliva, 2008), Pleurotus mushroom research have been focused in several bio potentialities such as the recycling of agricultural residues and bioconversion of lignocellulosic wastes, the production or improved of animal feed (Akinfemi et al., 2010); the bioremediation and degradation of xenobiotics and industrial wastewaters (Morgan et al., 1991; Faraco et al., 2009).
1.3. Postharvest quality of fresh mushrooms
Mushroom quality and consumer acceptability of fresh mushrooms is strongly influenced by colour te ture and appearance ( ízhányó and Felföldi 2000; Eastwood and Burton, 2002).
From a postharvest point of view, mushrooms are grouped with fruits and vegetables, being classified as highly perishable (Kader and Saltveit, 2003). Biological changes occurring after harvest are particularly fast in mushroom and prompt deterioration occurs (Ares et al., 2007).
Mushrooms shelf life can end up due to: i. high rate of respiration; ii. high rate of dehydration; iii. browning and iv. texture changes (Burton and Noble, 1993; Braaksma et al., 1994; Jolivet et al., 1998; Mahajan et al., 2008a; Iqbal et al., 2009a).
Mushrooms have high respiration rates, which is high when compared with other horticultural produce (Ares et al., 2007).
Postharvest losses of water by transpiration are also significant in mushroom fruit body. Mahajan et al. (2008a) determined transpiration rates of button mushrooms and reported significant mass losses over time, with transpiration rate ranging from 0.29 g.kg-1.h-1 to 5.2 g.kg-1.h-1 for mushrooms stored at 4 ºC and 96 % RH and 16 ºC and 76 % RH.
Colour changes are also a factor known to affect postharvest quality of mushrooms and severe browning or discoloration may occur due to enzymatic and/or microbial activities.
In agreement with its delicate nature, reduction of all metabolic processes is a key factor for optimum storage of mushrooms. The general recommendations for the postharvest procedures in mushrooms, generally refers to the genus Agaricus and are then extrapolated to other species (Ares et al., 2007; Singh et al., 2010). However, differences in physiological activities as well as morphological characteristics of the mushroom cap may be important with regard to the maintenance of postharvest quality of particular specie.
Once proper conditions of temperature and relative humidity are established, modified atmosphere package can also be used, although no consensus regarding its effect in distinct genus of mushrooms exist. For instance, MAP is considered of little benefit to Pleurotus (Villaescusa and Gil, 2003), but Iqbal et al. (2009b) obtained an important metabolism reduction and an increase in the shelf life of Agaricus. Besides these discrepancies observed in the effects of MAP in mushrooms and their optimal levels of O2 and CO2, other constrain in the use of MAP has been described. The lack
of packaging films with suitable permeability to O2, CO2 and moisture cause diverse
problems related with the accumulation of phytotoxic CO2 levels and/or the appearance
of condensation within mushroom packages (Sapata et al., 2004).
Due to these severe constraints, other strategies working synergetic with refrigeration temperatures and MAP must be developed to reduce postharvest deterioration in mushroom species. It has been suggested that placing mushrooms under controlled humidity atmosphere improve their quality and increases storability (Roy et al., 1995a,b; Villaescusa and Gil, 2003). Nevertheless, the use of hygroscopic compounds to control the in-package relative humidity is only empirical and does not fulfil requirements regarding optimum relative humidity for mushrooms.
This work focused mainly in developing novel strategies that can be used in the storage of Pleurotus ostreatus, in order to prevent losses in quality and nutritional value and early degradation of the product. No other studies have addressed the problem. Hence, the results presented here are expected to be of major importance from the commercial and the nutritional points of view.
1.4. Research objectives
The central aim of the work presented in this thesis was the development of packaging systems that can maximize the quality and shelf life of Pleurotus mushrooms. To achieve this, several lines of research were developed and are here summarized as follows:
1. Evaluate postharvest temperature response in quality attributes of Pleurotus
mushrooms over storage time;
2. Obtain experimental data on the respiratory behaviour of Pleurotus mushrooms
in a wide range of temperatures relevant to the supply chain of fresh horticultural products;
3. Obtain experimental data on the transpiration behaviour of Pleurotus
mushrooms in a range of temperatures and relative humidity relevant to fresh horticultural products;
4. Evaluate respiration and transpiration rates over time and apply mathematical
models to describe the effects of the storage environment in those physiological characteristics;
5. Evaluate and model the kinetics of moisture absorbers to determine the best
combination that match the transpiration characteristics of Pleurotus mushrooms;
6. Evaluate the effect of MAP and moisture absorber on different quality attributes
of Pleurotus mushrooms at both constant and abuse temperature usually found in the supply chain of fresh horticultural products.
1.5. Thesis structure
The thesis is divided in three parts and nine chapters. The first part includes this chapter (Chapter 1) that presents the problem and the objectives of this work and
Chapter 2 that covers literature review with an overview about mushrooms, causes
and effects of postharvest deterioration on commodities quality as well as overall strategies to control postharvest deterioration.
The second part includes the experimental work done according to the goals of the work. According to the general objective of the thesis, storage conditions on postharvest quality attributes were studied in Chapter 3.
In Chapter 4, a mathematical model describing the effect of temperature and storage time on oyster mushroom respiration rate was developed.
The effect of MA (lower O2 and higher CO2 than ambient air) on oyster
mushroom rate was also evaluated (Chapter 5).
Chapter 6 includes the study performed to obtain and model transpiration rates
of oyster mushrooms in a range of temperatures and relative humidities.
Kinetics of some mixture of moisture absorbers were also determined (Chapter
7) and finally the results obtained with the use of MAP and moisture absorbers in
oyster mushrooms are presented (Chapter 8).
The third part of this thesis (Chapter 9) presents the final conclusions and suggestions for future work.
Fig. 1.1 - Schematic representation of the thesis outline. PART I THESIS FRAMEWORK Chapter 1 General introduction
PART II
EXPERIMENTAL
WORK
Chapter 2 State of the artChapter 3
Influence of storage conditions on the shelf
life of oyster mushrooms
Chapter 5
Influence of gas composition on the respiration rate of fresh
oyster mushrooms
Chapter 6
Modelling the influence of time, temperature and relative humidity conditions on the mass
loss of fresh oyster mushrooms
Chapter 4
Modelling the influence of time and temperature on the respiration rate
of fresh oyster mushrooms
Chapter 8
Influence of modified atmosphere packaging and
moisture absorber on the quality of fresh oyster mushrooms as affected by
storage temperature
Chapter 7
Development of a moisture absorber for
fresh oyster mushrooms
PART III General conclusions and
suggestions for future work Chapter 9 General conclusions and
suggestions for future work
2.1. Mushrooms taxonomy, morphology, cultivation, nutritional
and medicinal properties and world production
Mushrooms have been appreciated since ancient times and have been used for several purposes. Their eating qualities are highly appreciated as well as their recognized health benefits.
Although Agaricus bisporus is the most popular mushroom, leading world production, other species such as Lentinula edodes and Pleurotus ostreatus are also becoming increasingly important. The genus Pleurotus comprises a number of different species. They are generally called oyster mushroom due to the sheel-like form of the cap. Due to the increasing importance of Pleurotus species as edible mushrooms throughout the world, this dissertation will focus on Pleurotus ostreatus.
In this sub-chapter, brief aspects of taxonomy and morphology of mushrooms are discussed. Nutritional value and health benefits of mushrooms with special focus in Pleurotus ostreatus mushrooms will be covered. Mushrooms world production data is also presented.
2.1.1. Mushrooms taxonomy and morphology
Mushrooms were first classified as plants but due to their particularities like the lack of chlorophyll and presence of cellular wall, were placed in a different kingdom called Myceteae (Chang and Miles, 2004). According to Chang and Miles (2004), a mushroom is “a macrofun us with a distinctive fruitin body, which can be either epigeous or hypogeous and large enough to be seen with naked eye and to be picked by hand”.
Mushrooms are constituted by densely packed fine threads filaments - the hyphae – which together form a structure called mycelium. Under favourable conditions, the mycelium differentiates and produces the fruiting body (Boa, 2004; (Chang and Miles, 2004). The structure which is generally known as mushroom is the
fruiting body of the fungus. All mushrooms fructifications have a typical morphology as presented in Fig. 2.1.
Fig. 2.1 - Mushroom structure. Source: Eastwood and Burton (2002).
Generally, the majority of mushrooms consist of a stem (or stipe), and a fleshy umbrella-shaped cap (or pileus) that contains and bear the fungi fertile structure (spores).
Mushroom differentiation and classification are based in their macroscopic and microscopic features.
All mushrooms are included in two Phyla - Ascomycota and Basidiomycota. The phylum Ascomycota includes mushrooms like truffles and morels. Most of the known mushrooms such as Agaricus bisporus, Pleurotus ostreatus and Lentinula edodes are included in phyla Basidiomycota and due to similarities in the morphological characteristics; most of the cultivated mushrooms are placed in the order Agararicale (Tab. 2.1).
Tab. 2.1 - Taxonomy of the main mushroom species cultivated. Agaricus bisporus (J.E. Lange) Pleurotus ostreatus (Jacq.) Lentinula edodes (Berk.) Pegler Kingdom Fungi Phylum Basidiomycota Class Basidiomycetes Order Agaricale
Family Agaricaceae Pleurotaceae Marasmiaceae
Genus Agaricus Pleurotus Lentinula
Specie A. bisporus P. ostreatus L. edodes
A. bisporus – known as common mushroom, champignon or button mushroom – is, within the genus Agaricus, the most familiar and cultivated specie throughout the world.
The genus Pleurotus (the word pleurotus means side ear), encompass about 50-70 species, nearly all edible and very similar (Kong, 2004) and are characterized by a ear-like in shape cap attached to the wood from which they grow by means of a lateral, or side, stem. The genus is recognized by the white spores, the stem attached at the side of the cap, or at least off center, and the fleshy or tough texture of the cap (Christensen, 1943). Within the genus Pleurotus, only a few of those species are currently domesticated and exploited industrially. Among those, P. ostreatus, P. sajor-caju and P. eryngii (cardoncello) stands out as important industrial species (Chang and Miles, 2004).Visual aspect, scientific and common names of some oyster mushrooms species are presented in Fig. 2.2.
One specie of the genus Pleurotus (Fr.) Quel. is P.ostreatus (Jacq. et Fr.) Kummer, the most cultivated specie within the genus, and in which many commercial strains are developed and cultivated (Kong, 2004). It is common recognized as oyster mushrooms, shimeji or hiratake (Sánchez and Royse, 2002). In Portugal, oyster mushrooms are known as repolga (Martins, 2004).
P. citrinopileatus
(Golden Oyster Mushroom) (a)
P. cystidiosus
(Abalone Mushroom) (b)
P. djamor
(Pink Oyster Mushroom) (c)
P. eryngii
(King Oyster Mushroom) (d)
P. florida
(Florida Oyster Mushroom) (e)
P. ostreatus
(Tree Oyster Mushroom) (f)
P. pulmonarius
(Phoenix or Indian Oyster Mushroom) (d)
P. pulmonarius
(Oyster Mushroom) (g)
Fig. 2.2 - Aspect of some important oyster mushroom species.
urce:(a) http://everythingmushrooms.com/grow-your-own-mushrooms/ ; (b) http://www.clovegarden.com/ingred/fungus.html; (c) http://mushroomersclub.blogspot.pt/2012/07/12-some-of-most-important-cultivated.html#.UwoJyU3itdg (d) Keizer (1998); (e) http://mushroomersclub.blogspot.pt/2012/07/12-some-of-most-important; (f) Authors photo(g) http://www.clovegarden.com/ingred/fungus.html
Tab. 2.2 – General characteristics of P. ostreatus.
Structure Characterization
Cap 3 to 5 inches broad, shell-shaped, pale gray in colour, growing yellowish-white with age, margin very
thin and turned in at first over the gills, later wavy. The flesh is thick, soft, white.
Gills Running down on the stem, decurrent, somewhat distant, veined, broad, white, and yellowish when
aged.
Stem Short, growing from the side of the cap (lateral), firm elastic, smooth, thickening toward cap, whitish.
Ring None
Volva None
Spores White
Odour Quite mild
Taste Rather strong, when cooked resembling the flavour of oysters
P. ostreatus has an oyster shape cap (Fig. 2.3), with a short stem tapering downward from one side. The upper side is smooth with variable colour. The gills are white, and the flesh is soft and spongy and varies between white to grey-white. It usually grows in clumps or cluster (Fig. 2.3) and it is quite adaptable to a range of climates and substrate materials. Some works also suggest that, in comparison with P. sajor-caju and P. eryngii, P. ostreatus is the most productive specie (Ramos et al., 2011).
Fig. 2.3 – Visual aspect of Pleurotus ostreatus mushrooms.
2.1.2. History of mushroom cultivation
For centuries, mushrooms have been used not only as food as well as a therapeutic agent. Both Chinese and Egyptian collected mushrooms in nature due to their knowledge of the benefits provided by mushroom consumption (Pérez-Armendáriz et al., 2010).
Mushroom cultivation began in Asia around 600 BC with the production of Auricularia auricula (Chang and Miles, 2004). Agaricus bisporus was not cultivated until 1600 AC and it was with this specie that modern mushroom cultivation techniques began to emerge. In France, the cultivation of Agaricus initially done in limestone was transferred to Paris caves in the 18th century (Kües and Liu, 2000).
In comparison with Agaricus bisporus, the commercial cultivation of Pleurotus species is relatively recent. The first cultivation of oyster mushrooms was recorded in Europe in 1917 and cultivation increased rapidly and in 1959, a large scale production of oyster mushrooms was established in Hungary. In the mid-seventies, its commercial production was fully established in Europe (Sánchez and Royse, 2002). This rapid development was probably due to cultivation practices that were easier when compared to other species and the overall potentials of Pleurotus for the degradation of lignocellulosic substrates from agriculture and silviculture (Rajarathnam et al., 1989).
2.1.3. Mushroom nutritional composition
Mushrooms are an attractive food item from the nutritional point of view due to their high protein and carbohydrate content, low fat and many minerals and vitamins (Manzi et al., 1999; Mattila et al., 2001; Cohen et al., 2002; Pérez-Armendáriz et al., 2010; Cheung, 2010; Phillips et al., 2012).
Nutritional composition of mushrooms varies between species. Within the same species, strain, type of subtract used and cultivation techniques, maturity at harvest are important factors that contribute to the nutritional content of mushrooms (Beelman et al., 1989).
The chemical composition of some mushroom species is shown as follow.
2.1.3.1. Moisture content
Moisture content of mushrooms ranges from 85 to 95 % of their fresh mass and is affected by the time of cropping, watering conditions during cultivation, postharvest period, and temperature and relative humidity during growth (Bano et al., 1988). As a