AR
TIGO
AR
TICLE
1 Instituto Israelita de Responsabilidade Social do Hospital Israelita Albert Einstein. Av. Albert Einsten 627/701, Morumbi. 05652-900 São Paulo SP Brasil. [email protected] 2 Centro de Estudos do Laboratório de Aptidão Física de São Caetano do Sul. R. Heloisa Pamplona 269/31, Bairro Fundação. 09520-320 São Caetano do Sul SP Brasil.
3 Escolas de Artes, Ciências e Humanidades de São Paulo, Universidade de São Paulo. São Paulo SP Brasil. 4 Escola Superior de Educação Física, Universidade Federal de Pelotas. Pelotas RS Brasil.
The prevalence of physical activity and its associated effects
among students in the São Paulo public school network, Brazil
Prevalência de atividade física e fatores associados
em escolares da rede pública estadual de São Paulo, Brasil
Resumo O presente estudo avaliou nível de ati-vidade física (AF) e seus efeitos associados entre estudantes da rede pública de São Paulo. Um estudo transversal foi feito usando uma amostra representativa de estudantes da rede pública de ensino de São Paulo. Foi utilizado o International Physical Activity Questionnaire para determinar o nível AF. Estudantes que relataram pelo menos 300 minutos/semana de AF, foram considerados ativos. As variáveis independentes foram: sexo, idade, índice de massa corporal, educação, região e o conhecimento do programa Agita São Paulo. A prevalência de AF regular foi de 71,7%. Os meni-nos (RP = 1,09, IC95% = 1,04 -1,15), 17 ameni-nos de idade (RP = 1,16, 95% IC 1,09-1,24), terceiro ano do ensino médio (RP = 1,20, IC95% = 1,12-1,29 ) e aqueles que residiam na região do Centro-O-este (RP = 1,27, IC95% 1,16-1,38) tinham maior probabilidade de ser ativos. Meninos de 17 anos de idade, no terceiro ano do ensino médio, que re-sidiam no Centro-Oeste e reconhecia o programa Agita São Paulo/Agita Galera tinham níveis mais elevados de AF. Alunos de São Paulo apresenta-ram um elevado nível de AF. Meninos com idade superior a 17 anos, do 3º ano do ensino médio, que residiam na região Centro-Oeste, e reconhecia o programa Agita São Paulo/Agita Galera foram mais propensos a ser mais ativos.
Palavras-chave Atividade física, Epidemiologia, Saúde pública, Adolescente
Abstract The current study evaluated physical activity (PA) level and its associated effects among students in the public network of São Paulo, Bra-zil. A cross-sectional study was taken using a rep-resentative sample of students in São Paulo pub-lic school system. International Physical Activity Questionnaire determined PA level. Students who reported at least 300 minutes/week of PA were considered active. The independente variables were: gender, age, body mass index, education, region, recognition of the Agita São Paulo pro-gram. The prevalence of regular PA was 71.7%. Males (PR = 1.09, 95%CIs = 1.04 -1.15) at least 17 years old (PR = 1.16, 95% CIs 1.09-1.24) in their 3rd year of high school (PR = 1.20, 95% CIs = 1.12-1.29) who resided in the Midwest region (PR = 1.27, 95% CIs 1.16-1.38) were most likely to be active. Males at least 17 years old in their 3rd year of high school who lived in the Midwest and recognized the Agita São Paulo/Agita Galera pro-gram had higher levels of PA. São Paulo students presented a high level of PA. Moreover, males older than 17 years, attending their 3rd year of high school, who lived in the Midwest region, and recognized the Agita São Paulo/Agita Galera pro-gram were the most likely to be more active.
Key words Motor activity, Epidemiology, Public health, Adolescent
Leonardo José Silva 1
Victor Keihan Rodrigues Matsudo 2
Douglas Roque Andrade 3
Mário Azevedo 4
Gerson Luis de Moraes Ferrari 2
Luis Carlos Oliveira 2
Timóteo Leandro Araújo 2
S
Introduction
The relationship between physical activity and health has been well established in the literature1.
However, abundant evidence has also shown that physical inactivity is common among the popu-lation, including children and adolescents2.
In addition to not enjoying the benefits of physical activity in the short term, sedentary chil-dren and adolescents have an increased chance of becoming sedentary adults. Even more troubling, physical activity and participation in physical ed-ucation courses have decreased over time among adolescents in developed countries3.
A high prevalence of physical inactivity has been estimated among adolescents in Brazil. A recent review4 found this prevalence to range
from 39.0% to 93.5%. This large variability is due to the different measurements and cutoff points used in studies to classify physical activity levels. In Brazil, there are few population-based studies school of physical activity adolescents5,6.
Interventions to increase physical activity have been recently implemented in Brazil7,8. The
Agita São Paulo program is a pioneering initia-tive in this country9. Implemented in 1996, this
program has increased (at the state level in par-ticular) people’s knowledge regarding the bio-logical, psychobio-logical, and social health benefits of physical activity and people’s involvement in moderate to vigorous physical activity10.One of
the Agita São Paulo’s initiatives is the Agita Gal-era Program11, which aims to promote awareness
and physical activity at school among school-age children.
The Agita Galera concept is highly audacious because it aims to affect the entire public school system of São Paulo. According to official data of the Board of Education of São Paulo (Secretaria da Educação do Estado de São Paulo), this school system is currently the largest in Brazil with 5,300 schools, 230,000 teachers, 59,000 staff, and more than 4 million students12.
The current study evaluated physical activi-ty level and its associated effects among students from elementary and middle schools in the pub-lic network of São Paulo, Brazil.
Methods
This school-based cross-sectional study was con-ducted in the state of São Paulo. The sample was selected across multiple stages:
a) Random selection occurred within each macro-region of the municipalities (i.e., each ad-ministrative region), stratified by size: small mu-nicipalities (up to 30,000 inhabitants), medium (30,001 to 199,999 inhabitants), and large (great-er than or equal to 200,000 inhabitants). A mu-nicipality was selected from each stratum; if the selected area did not have a municipality within its stratum, then two cities were selected from the stratum of the most representative size.
b) Schools were randomly selected in each municipality (minimum = 2; maximum = 17).
c) Students from the 5th and 8th grades as well as the 3rd year of high school were selected from each school (minimum = 3; maximum = 150).
The data were collected between February and May 2011. Trained interviewers approached individuals in the classroom at all schools. To aid in the understanding of the instrument, especial-ly with regard to the intensity of physical activity, flash cards were used with typical physical activ-ities.
The short version of the International Phys-ical Activity Questionnaire (IPAQ) was used to measure physical activity level6,13,14.The IPAQ was
developed by an international group of experts to estimate physical activity patterns of popula-tions from different countries and sociocultural contexts14. The questionnaire is validated for
Bra-zilian adolescents and the IPAQ have acceptable measurement properties for monitoring levels of habitual physical activity in adolescents6.
Young adolescents reported their frequencies and durations of walking and other physical ac-tivities of moderate to vigorous intensity over the previous week6. The content validity of IPAQ is
high, because frequency, intensity, and duration of physical activity are assessed, as well as seden-tary behavior, which is an emerging concern6,14 A
physical activity score was created by multiplying the weekly frequency and duration of each phys-ical activity session reported. Individuals with a physical activity score of at least 300 minutes/ week were considered active based on the current recommendations for physical activity among adolescents15,16. The independent variables were
as follows:
a) Gender (male or female);
b) Age (in years, categorized into three groups: 10-14, 15-16, and > 17 years);
c) Body mass index (BMI) was derived from weight and height (kg/m2), and BMI z-score
e C
ole
tiv
a,
21(4):1095-1103,
2016
Health Organization (WHO), classified into four groups: low weight, normal, overweight, and obese17;
d) Education (grade at interview date: 5th grade, 8th grade, or 3rd year of high school);
e) Region (17 regions according to the divi-sion proposed by the Government of São Pau-lo: Midwest, Mid-east, South-southeast, the Sea Coastal Regions, and Metropolitan Areas);
f) Recognition of the Agita São Paulo pro-gram logo and the “Meiorito” mascot from a card with images;
g) The ability to associate the logo and mas-cot with physical activity, healthy eating, or over-all health. For the purposes of the analyses, those who associated the logo or mascot with some-thing other than the above characteristics were grouped with those who reported that they did not know the logo or mascot.
The Ethics Committee of the Faculty of Me-dical Sciences at Santa Casa de São Paulo (Co-mitê de Ética da Faculdade de Ciências Médicas da Santa Casa de São Paulo) approved this study. Those responsible signed the Terms of Consent pursuant to Resolution 196/96 of the National Health Council before the interviews.
Descriptive analyses were conducted to ob-tain absolute numbers and proportions with re-spective confidence intervals for categorical data. Bivariate analyses between physical activity level and the independent variables were conduct-ed using the chi-square test for heterogeneity (categorical variables) and the linear trend test (ordinal variables). Adjusted analyses for possi-ble confounds were performed using a Poisson regression with robust adjustment for variance. The variables were selected “after the fact”, there-by respecting the levels of the pre-established hi-erarchical model18. Variables with p < 0.20 were
retained in the final model. The level of signifi-cance employed was p < 0.05. All analyses were weighted by the representativeness of the munic-ipalities and regions and conducted using Stata version 10.0.
Results
The final sample was composed of 51 municipal-ities in São Paulo, totaling 154 schools and 2,555 students from the 5th and 8th grades of elemen-tary school as well as the 3rd year of high school in the São Paulo state public school network. Ap-proximately 4% of schools refused to participate
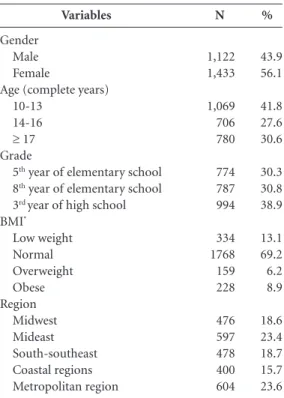
in the study; thus, new schools of the same size were randomly selected within each municipal-ity. As shown in Table 1, the students were pre-dominantly female (56.1%), aged between 10 and 13 years, and has a normal BMI (69.2%).
The prevalence of physically active students (≥ 300 minutes/week) in the state was 71.7% (95%CI 70.0-73.4). Table 2 displays the asso-ciation between physical activity and the inde-pendent variables. Young males aged at least 17 years old and in their 3rd year of high school were significantly more active than other partic-ipants. Region 5, which includes the capital and the metropolitan area, had the lowest prevalence of physical activity.
Table 3 displays the raw and adjusted analyses of the association between physical activity and the independent variables. The adjusted analyses showed the same associated factors as the raw analyses. Young males were 9% more active than females. Third year high school students were significantly more active compared with students in the 5th grade with a prevalence ratio of 1.20 (95% CIs = 1.12 to 1.29).
Variables
Gender Male Female
Age (complete years) 10-13
14-16
≥ 17 Grade
5th year of elementary school
8th year of elementary school
3rd year of high school
BMI*
Low weight Normal Overweight Obese Region
Midwest Mideast South-southeast Coastal regions Metropolitan region
N
1,122 1,433
1,069 706 780
774 787 994
334 1768 159 228
476 597 478 400 604
%
43.9 56.1
41.8 27.6 30.6
30.3 30.8 38.9
13.1 69.2 6.2 8.9
18.6 23.4 18.7 15.7 23.6
Table 1. The sample demographics of São Paulo public education students in 2008 (N = 2,555).
S
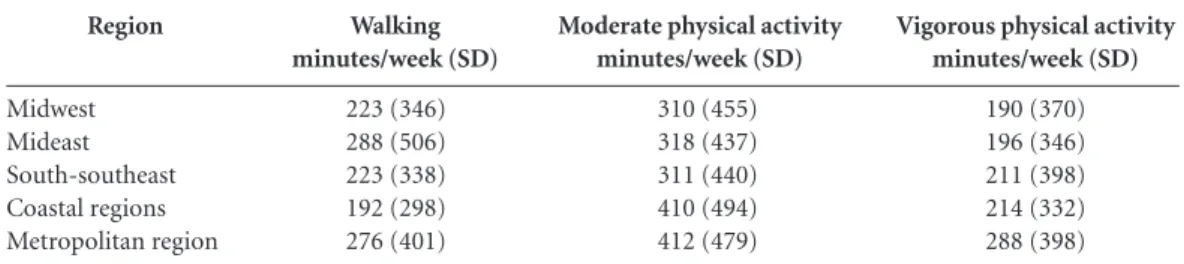
There were no significant differences (p > 0.05) among the region for any of the physical activity (walking, moderate and vigorous physi-cal activity) (Table 4).
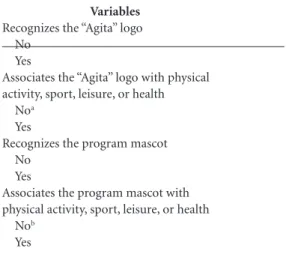
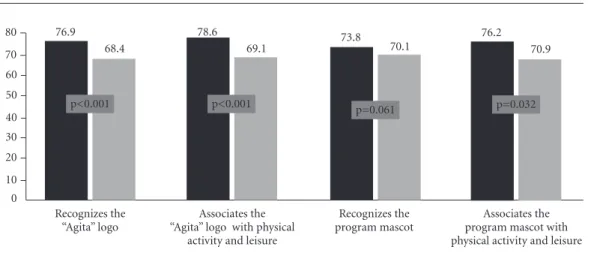
Table 5 displays the student recognition of the logo and mascot of the Agita São Paulo program: The program logo and mascot were recognized by 39.3% and 44.1% of respondents, respectively. Students who recognized the program logo were significantly more active than those who did not (76.9% vs. 68.4%, p < 0.001). Students who correctly identified the logo and mascot of Agita São Paulo were significantly more active compared with those who did not correctly do so. Analyses adjusted for gender, age, grade, and region confirmed the results of the raw analyses, except for the “identifies the program mascot correctly” variable, which was not significant (p = 0.487; Figure 1).
Discussion
The aim of this study was evaluated physical ac-tivity level and its associated effects among
stu-dents in the public network of São Paulo, Brazil. We showed that prevalence of physically active students (≥ 300 minutes/week) in the state was 71.7%. Young males were 9% more active than females. Third year high school students were significantly more active compared with students in the 5th grade. Students who recognized the program logo were significantly more active than those who did not and students who correctly identified the logo and mascot of Agita São Pau-lo were significantly more active compared with those who did not correctly do so, independent of gender, age, grade, BMI, and region confirmed the results of the raw analyses, except for the “identifies the program mascot correctly” vari-able, which was not significant.
Although the literature constantly reports technological advances in the methods used to evaluate physical activity in youths, this activity remains challenging19,20. A correlation does not
exist between data collected via questionnaires and direct methods such as accelerometry with regard to physical activity level. Nevertheless, ev-idence shows that when individuals are catego-rized into physical activity groups, these methods can be moderately to highly concordant19.
A majority of the youths in our sample (71.7%; 95%CIs = 70.0% to 73.4%) met the physical activity recommendations. Male aged at least 17 years old in their 3rd year of high school
from the Midwest region of the state were most likely to be active. The high prevalence of youths who met these recommendations is a surprising finding.
An instrument commonly used in epidemi-ological surveys21,22 was employed in the present
study. Recent studies that have used similar phys-ical activity measures and cutoffs found data that conflicted with those presented here; specifically, they reported high estimates of physical inactiv-ity among adolescents (ranging from 39.2% to 69.8%)5,21-23.
A sample of high school students who at-tended public schools in São Paulo showed a low prevalence of physical activity (37.5%). Of the adolescents who met the recommendation, 47% practiced structured physical activities in city clubs. The same study found that the prev-alence of physical activity (≥ 300 minutes/week) was significantly higher in boys than girls (50.3% versus 25.9%)5.
In the present study, boys had significant-ly higher mean values for physical activity than girls. Our findings agree with recent studies that boys accumulate more physical activity than
Variables
Gender Male Female
Age (complete years) 10-13
14-16
≥ 17 Grade
5th year of elementary school
8th year of elementary school
3rd year of high school
Region Midwest Mideast South-southeast Coastal regions Metropolitan region
BMI*
Low weight Normal Overweight Obese
%
75.7 68.7
65.7 74.9 76.8
63.3 74.1 76.4
79.3 77.4 69.6 69.5 63.2
67.0 72.6 76.0 73.0
p-value
< 0.001
< 0.001t
< 0.001t
< 0.001
0.104
Table 2. The prevalence of physical activity (≥300 minutes/week) among students in São Paulo public education.
e C
ole
tiv
a,
21(4):1095-1103,
2016
girls24-26. To describe the physical activity
prac-ticed among Brazilian adolescents, data from the National Survey of Student Health (Pesquisa Na-cional de Saúde do Escolar [PeNSE])24 were
col-lected from all the Brazilian state capitols and the Federal District in 2009. These data revealed an active youth prevalence of 46% in São Paulo. This study also observed that the proportion of active boys was higher than that of girls.
Evidence from developed countries has shown that involvement in physical activity during adolescence is declining, even during physical education classes3. Data from the Youth
Risk Behavior Surveillance System (YRBSS) that sampled participation in high school physical ed-ucation in the US from 1991 to 2004 revealed that approximately 55% of students were enrolled in these classes, but only 28% attended them each
Variables
Gender Male Female
Age (complete years) 10-13
14-16
≥ 17 Grade
5th year of elementary school
8th year of elementary school
3rd year of high school
Region Midwest Mideast South-southeast Coastal regions Metropolitan region
BMI*
Low weight Normal Overweight Obese
Table 3. The raw and adjusted analyses of the associations between physical activity and demographics, education, and BMI among students of the São Paulo state public education network.
PR (CI95%)
1.10 (1.04 -1.16) 1.0
1.0 1.14 (1.06 -1.22)
1.17 (1.10-1.25)
1.0 1.17 (1.09 – 1.26)
1.21 (1.12 -1.29)
1.26 (1.15 – 1.37) 1.23 (1.12 – 1.34) 1.10 (1.00 – 1.22) 1.10 (1.00 – 1.21)
1.0
1.0 1.06 (0.98 – 1.14) 1.09 (0.97 – 1.22) 1.05 (0.94 – 1.18)
p-value
< 0.001
< 0.001t
< 0.001t
< 0.001
0.421
a Adjusted for age; b Adjusted for gender; c Adjusted for gender, age, and grade; d Adjusted for gender, age, grade, and macro-region; Linear trend test.
PR (CI95%)
1.09 (1.04 -1.15) 1.0
1.0 1.14 (1.06 -1.21) 1.16 (1.09-1.24)
1.0 1.17 (1.09 – 1.26)
1.20 (1.12 -1.29)
1.27 (1.16 – 1.38) 1.24 (1.13 – 1.35) 1.11 (1.01 – 1.23) 1.09 (0.99 – 1.20)
1.0
1.0 1.07 (1.00 – 1.19) 1.12 (0.99 – 1.26) 1.05 (0.94 – 1.17)
p-value
< 0.001a
< 0.001b t
< 0.001b t
< 0.001c
0.250d
Raw analysis Adjusted analysis
Region
Midwest Mideast South-southeast Coastal regions Metropolitan region
Table 4. Physical activity indicators (minutes/week) by region in São Paulo public education.
Walking minutes/week (SD)
223 (346) 288 (506) 223 (338) 192 (298) 276 (401)
Moderate physical activity minutes/week (SD)
310 (455) 318 (437) 311 (440) 410 (494) 412 (479)
SD: standard deviation.
Vigorous physical activity minutes/week (SD)
S
day. In 2011, 53.3% of US students were enrolled in physical education classes, and only 23% at-tended these classes every day27.
A systematic review of the interventions conducted in Latin America showed that school interventions effectively promote physical ac-tivity28. However, the strategies aimed at greater
student involvement primarily within schools remain a global challenge. In São Paulo, the 1997 implementation of the Agita Galera Program (Active Community Day) in the public school system involved various discussions of the im-portance of physical activity. These discussions have included the sensitization of teachers in the public education network, publicity via printed media, the preparation and distribution of infor-mational handouts, and encouraging schools to promote specific and permanent actions related to physical activity, among others.
A study of public high school students in São Paulo examined the prevalence of physical inac-tivity with regard to knowledge of the Agita São Paulo/Agita Galera program and found that a lack of knowledge increased the likelihood of in-activity by 29% (PR = 1.2; 95% CIs = 1.16-1.38)5.
Our study revealed that individuals who re-ported recognizing the program logo were sig-nificantly more active than those who did not
(76.9% vs. 68.4%, p < 0.001). Several hypotheses might explain the high prevalence of the student physical activity detected in this study. These data might indicate that the Agita São Paulo/Agita Galera program positively influences the physi-cal activity levels of students in the public edu-cation network of São Paulo. This supposition is reinforced by the fact that the event has occurred annually since 1997.
To the best of our knowledge, national studies have not analyzed the temporal trends of student physical activity. A study of adults from south-ern Brazil used the same physical activity eval-uation and found an increase of 11% in adult in activity (150-minutes/week) from 2002 to 200724.
Data from the Brazilian monitoring system Vig-itel revealed a modest increase in the proportion of adults who practiced a minimum of 150 min/ week of physical activity during their leisure time nationwide (14.9% in 2006; 15.5% in 2007; and 16.4% in 2008)29. However, these data are not
directly comparable because they used different physical activity domains to classify their sample. Furthermore, São Paulo has officially com-memorated World Physical Activity Day (April 6) since 2002. On this day, several cities in the state promote large events that target the need to incorporate physical activity into one’s daily life. For example, in 2002, 888 events were held across 175 municipalities. In 2008, more than 2,030 events were held. In addition, the Brazilian Ministry of Health has funded city projects that encourage physical activity since 2006. Of the 35 municipalities of São Paulo given the award in 2006, 54% were partners of the Agita São Paulo program.
Recognition of the Agita logo has increased in recent years. In 2002, 37% of the state’s pop-ulation was aware of Agita; in 2008, this statistic increased to 60%. To date, 49% of the state’s pop-ulation has become aware of the primary mes-sage of the program30.
We stress that students who recognized the program’s logo were significantly more active than those who did not (76.9% vs. 68.4%, p < 0.001; Figure 1). In addition, the data collection and interviews were conducted between Febru-ary and March, far removed from August when the Agita Galera events are held. Thus, the pro-gram likely is sustainable and permanent among public school students. Therefore, the results presented in our study and current scientific evi-dence suggest that the engagement of adolescents in physical activities stimulated by health promo-tion programs at school or not could contribute
Variables
Recognizes the “Agita” logo No
Yes
Associates the “Agita” logo with physical activity, sport, leisure, or health
Noa
Yes
Recognizes the program mascot No
Yes
Associates the program mascot with physical activity, sport, leisure, or health
Nob
Yes
Table 5. Recognition of the Agita São Paulo program among students (N = 2,555) in the São Paulo state public education network.
e C
ole
tiv
a,
21(4):1095-1103,
2016
to the reduction of physical inactivity, probably because it raises awareness of the importance and benefits for health and also due to the greater involvement of adolescents in these activities. In that sense, the action of schools and governmen-tal agencies seems to be an interesting manner to create and implement intervention programs that assist to prevent physical inactivity.
Some limitations of the present study need to be acknowledged. The short version of IPAQ also has some limitations. The main limitation is that we were unable to differentiate domains of physical activity (leisure time, occupational, housework, and commuting). In a country like Brazil most previous research has used question-naires (IPAQ) indirect measures of physical ac-tivity for adolescents6. Questionnaires, like IPAQ,
represent the most accessible instrument for the usual physical activity evaluation, above all in ep-idemiological nature studies due to the easiness of being applied to large groups, low cost and for allowing collecting information with relation to the type and context in which they are per-formed, what does not occur to other measure-ment resources. In the present study, only high school students from state’s public schools who attended school in the mornings were assessed. Thus, other segments that are part of the edu-cational system, such as private, city’s public or technical schools and other school hours (after-noon or evening classes) were not assessed. Ac-cordingly, our inferences are related only to the group studied. The results shown in the present
study may serve as the basis for future investiga-tions in areas with specific environmental and social characteristics in the state of São Paulo, providing data for comparisons with both stud-ies involving young populations from other re-gions in Brazil and youths from other countries.
Conclusion
The present findings indicate that students in São Paulo have a high level of physical activity. More-over, males older than 17 years attending their 3rd year of high school who lived in the Midwest region and recognized the Agita São Paulo/Agi-ta Galera program were the most likely to report physical activity. At least some of our findings directly or indirectly reflect the positive effect of the Agita São Paulo/Agita Galera program on the activity level of students in São Paulo, Brazil.
Collaborations
LJ Silva, VKR Matsudo, DR Andrade, M Azeve-do, GLM Ferrari, LC Oliveira, TL Araújo e SMM Matsudo contributed equally to the preparation of the manuscript.
Figure 1. The prevalence of physical activity* (≥ 300 minutes/week) by the recognition of the Agita São Paulo
program among students of the São Paulo public education network.
* Adjusted for gender, age, grade, BMI and macro-region. 0
10 20 30 40 50 60 70 80
Recognizes the “Agita” logo 76.9
68.4
p<0.001
Associates the “Agita” logo with physical
activity and leisure 78.6
69.1
p<0.001
Recognizes the program mascot
73.8 70.1
p=0.061
Associates the program mascot with physical activity and leisure
76.2 70.9
S
Acknowledgements
State Department of Health of São Paulo.
References
Bouchard DR, Langlois MF, Boisvert-Vigneault K, Fa-rand P, Paulin M, Baillargeon JP. Pilot study: can older inactive adults learn how to reach the required intensi-ty of physical activiintensi-ty guideline? Clin Interv Aging 2013; 8:501-518.
Hallal PC, Andersen LB, Bull FC, Guthold R, Haskell W, Ekelund U. Global physical activity levels: surveil-lance progress, pitfalls, and prospects. Lancet 2012; 380(9838):247-257.
Knuth AG, Hallal PC. Temporal trends in physi-cal activity: a systematic review. J Phys Act Health.
2009;6(5):548-559.
Tassitano RM, Bezerra J, Tenório MCM, Colares V, Bar-ros MVG, Hallal PC. Physical activity in Brazilian ad-olescents: A systematic review. Rev Bras Cineantropom
Desempenho Hum 2007; 9(1):55-60.
Ceschini FL, Andrade DR, Oliveira LC, Araújo Júnior JF, Matsudo VKR. Prevalência de inatividade física e fa-tores associados em estudantes do ensino médio de es-colas públicas estaduais. J Pediatr 2009; 85(4):301-306. Guedes DP, Lopes CC, Guedes JERP. Reproducibili-ty and validiReproducibili-ty of the International Physical ActiviReproducibili-ty Questionnaire in adolescents. Rev Bras Med Esporte
2005; 11(2):147-154
Malta D, Castro A, Gosh C, Cruz DKA, Bressan A, Nogueira JD, Morais Neto OL, Temporão JG. Nation-al policy of heNation-alth promotion and the motor activity agenda in the context of the National Health System in Brazil. Epidemiol Serv Saúde 2009; 18(1):79-86. Matsudo SM, Matsudo VR, Araujo TL. The Agita Sao Paulo Program as a model for using physical activity to promote health. Rev Panam Salud Publica 2003; 14(4):265-273.
Matsudo V, Guedes J, Matsudo S, Andrade D, Araujo T, Oliveira L, Andrade E, Ribeiro M. Policy interven-tion: the experience of Agita São Paulo in using “mo-bile management” of the ecological model to promote physical activity. Perspectives 2004; 6:1-22.
Matsudo SMM, Matsudo VKR, Araújo TL, Andrade E, Oliveira L, Braggion G. Physical activity promotion: experiences and evaluation of the Agita São Paulo Program using the ecological mobile model. J Phys Act
Health 2004; 1:81-97.
Zieff SG, Guedes CM, Wiley J. Youth knowledge of physical activity health benefits: a brazilian case study.
ScientificWorldJournal 2006; 6:1713-1721.
Secretaria da Educação do Estado de São Paulo. A Secretaria. [cited 2013 Jul 16]. http://www.educacao. sp.gov.br/portal/institucional/a-secretaria
1.
2.
3.
4.
5.
6.
7.
8.
9.
10.
11.
e C
ole
tiv
a,
21(4):1095-1103,
2016
Matsudo S, Araújo T, Matsudo V, Andrade D, Andrade E, Oliveira LC, Braggion G. Questionário internacional de atividade física (IPAQ): estudo de validade e repro-dutibilidade no Brasil. Rev Bras Ativ Fís Saúde 2001; 6(2):5-18.
Craig CL, Marshall AL, Sjostrom M, Bauman AE, Booth ML, Ainsworth BE, Pratt M, Ekelund U, Yngve A, Sallis JF, Oja P. International physical activity ques-tionnaire: 12-country reliability and validity. Med Sci
Sports Exerc 2003; 35(8):1381-1395.
Strong WB, Malina RM, Blimkie CJ, Daniels SR, Dish-man RK, Gutin B, Hergenroeder AC, Must A, Nixon PA, Pivarnik JM, Rowland T, Trost S, Trudeau F. Evi-dence based physical activity for school-age youth. J
Pediatr. 2005; 146(6):732-737.
World Health Organization (WHO). Global
recom-mendations on physical activity for health. Geneva:
WHO; 2010.
de Onis M, Onyango AW, Borghi E, Siyam A, Nishida C, Siekmann J. Development of a WHO growth reference for school-aged children and adolescents. Bull World
Health Organ 2007; 85(9):660-667.
Barros AJ, Hirakata VN. Alternatives for logistic regres-sion in cross-sectional studies: an empirical compar-ison of models that directly estimate the prevalence ratio. BMC Med Res Methodol 2003; 3:21-33.
Reimers AK, Mess F, Bucksch J, Jekauc D, Woll A. Sys-tematic review on measurement properties of ques-tionnaires assessing the neighbourhood environment in the context of youth physical activity behaviour.
BMC Public Health 2013; 13:461.
Ferrari GL, Oliveira LC, Araujo TL, Matsudo V, Barrei-ra TV, Tudor-Locke C, Katzmarzyk P. ModeBarrei-rate-to-vig- Moderate-to-vig-orous physical activity and sedentary behavior: inde-pendent associations with body composition variables in brazilian children. Pediatr Exerc Sci 2015; 27(3):380-389.
Gonçalves H, Hallal PC, Amorim TC, Araújo CLP, Menezes AMB. Fatores socioculturais e nível de ativi-dade física no início da adolescência. Rev Panam Salud
Publica 2007; 22(4):246-253.
Nahas MV, Barros MVG, Goldfine BD, Lopes AS, Hal-lal PC, Farias junior JC, Oliveira ES. Atividade física e hábitos alimentares em escolas públicas do ensino mé-dio em diferentes regiões do Brasil: o projeto Saúde na Boa. Rev Bras Epidemiol 2009; 12(2):270-277. 13.
14.
15.
16.
17.
18.
19.
20.
21.
22.
Castro IRR, Cardoso LO, Engstrom EM, Levy RB, Mon-teiro CA. Vigilância de fatores de risco para doenças não transmissíveis entre adolescentes: a experiência da cidade do Rio de Janeiro, Brasil. Cad Saude Publica
2008; 24(10):2279-2288.
Hallal PC, Knuth AG, Cruz DKA, Mendes MI, Malta DC. Prática de atividade física em adolescentes brasile-iros. Cien Saude Colet 2010; 15(Supl. 2):3035-3042. Barreira TV, Schuna Junior JM, Mire EF, Broyles ST, Katzmarzyk PT, Johnson WD, Tudor-Locke C. Norma-tive steps/day and peak cadence values for united states children and adolescents: National Health and Nutri-tion ExaminaNutri-tion Survey 2005-2006. J Pediatr 2015; 166(1):139-143.
Tudor-Locke C, Craig CL, Beets MW, Belton S, Cardon GM, Duncan S, Hatano Y, Lubans DR, Olds TS, Raus-torp A, Rowe DA, Spence JC, Tanaka S, Blair SN. How many steps/day are enough? for children and adoles-cents. Int J Behav Nutr Phys Act 2011; 8:78.
Eaton DK, Kann L, Kinchen S, Shanklin S, Flint KH, Hawkins J, Harris WA, Lowry R, McManus T, Chyen D, Whittle L, Lim C, Wechsler H; Centers for Disease Control and Prevention. Youth Risk Behavior Surveil-lance – United States, 2011. MMWR Surveill Summ
2012; 61(4):1-162.
Hoehner CM, Soares J, Parra Perez D, Ribeiro IC, Joshu CE, Pratt M, Legetic BD, Malta DC, Matsudo VR, Ra-mos LR, Simões EJ, Brownson RC. Physical activity in-terventions in Latin America: a systematic review. Am J
Prev Med 2008; 34(3):224-233.
Monteiro CA, de Moura EC, Jaime PC, Lucca A, Flo-rindo AA, Figueiredo ICR, Bernal R, Silva NN. Sur-veillance of risk factors for chronic diseases obtained via telephone interviews. Rev Saude Publica 2005; 39(1):47-57.
Matsudo VKR, Matsudo SM, Araújo TL, Andrade DR, Oliveira LC, Hallal PC. Time trends in physical activi-ty in the state of Sao Paulo, Brazil: 2002-2008. Med Sci
Sports Exerc 2010; 42(12):2231-2236.
Artigo apresentado em 22/06/2015 Aprovado em 27/10/2015
Versão final apresentada em 29/10/2015 23.
24.
25.
26.
27.
28.
29.