regional committee
PAN AMERICAN
WORLD
HEALTH
HEALTH
ORGA
ORGANIZATION
NIZATIO
XXXIII Meeting XL Meeting
Washington, D.C. September-October 1988
Provisional Agenda Item 5.4 CD33/3 (Eng.)
11 July 1988
ORIGINAL: ENGLISH
PROVISIONAL DRAFT OF THE PROGRAM BUDGET PROPOSAL OF THE WORLD HEALTH ORGANIZATION FOR THE REGION OF THE AMERICAS FOR THE BIENNIUM 1990-1991
The 101st Meeting of the Executive Committee heard the report of the Subcommittee on Planning and Programming related to the global $25 million WHO Regular reduction in 1988-1989 and its impact upon the 1990-1991 proposal for the Region of the Americas.
As a result of the global reduction, the 1988-1989 WHO regular
program budget for this Region was reduced by $2,470,000, from
$62,631,000 to $60,161,000. It is from this revised 1988-1989 program
base of $60,161,000 that the 1990-1991 proposal of $65,027,000 is projected to increase by $4,866,000, representing a cost increase of
8.1%. The proposal is $504,000 less than the maximum increase permitted
by the WHO Director-General's instructions. While these instructions did not allow for overall program growth, the proposal contains program growth of 1.8%, or $507,800 in country programs.
The attached document (CE101/20) was studied by the Executive
Committee. After reviewing the reductions necessary in the 1988-1989
program and the proposed distribution of the 1990-1991 program, the Executive Committee adopted the following resolution:
THE 101st MEETING OF THE EXECUTIVE COMMITTEE,
Having considered Document CE101/20, which contains a tentative request for US$65,027,000 from the World Health Organization for the Region of the Americas for the biennium 1990-1991; and
Noting that in its last two meetings the Subcommittee on Planning
and Programming has reviewed in general terms the program budget
CD33/3 (Eng.) Page 2
RESOLVES:
1. To thank the Subcommittee on Planning and Programming for its review.
2. To thank the Director for presenting a tentative WHO regular program budget proposal for the biennium 1990-1991 which includes a 1.8% program increase in the funds allocated to country programs while at the same time proposing no overall program increase, especially in view of the $2,470,000 program decrease required in the 1988-1989 program budget.
3. To recommend to the XXXIII Meeting of the Directing Council of PAHO, XL Meeting of the Regional Committee of WHO for the Americas, that
it approve the 1990-1991 proposal of $65,027,000, which includes
$4,866,000 or 8.1% in cost increases over the revised 1988-1989 allocation of $60,161,000, by adopting a resolution along the following lines:
THE XXXIII MEETING OF THE DIRECTING COUNCIL,
Having considered Document CD33/3 and the tentative request for US$65,027,000 from the World Health Organization for the Region of the Americas for the biennium 1990-1991, which includes cost increases of 44,866,000 or 8.1% over the revised 1988-1989 alloca-tion; and
Noting the recommendation of the 101st Meeting of the Executive Committee,
RESOLVES:
To request the Director to transmit to the Director-General of WHO the request for $65,027,000 for the Region of the Americas for
the biennium 1990-1991, for consideration by the WHO Executive Board and the World Health Assembly in 1989.
C;~~~~~ ;> .
~~~~~~~~~CD33/3
(Eng.)executive
eonmmittee
of
working party of
ANNEXthe directin'g-co6uncil
the regional committee
PAN: AMERICAN
WORLD
mt
)
etJ
HEAtLTH':
HEALTH
*
ORGANIZATION
ORGANIZATION
101st Meeting Washington, D.C.
June-July 1988
Provisional Agenda Item 4.4 CE1O1/20 (Eng.)
23 May 1988
ORIGINAL: ENGLISH
PROVISIONAL DRAFT,, OF THE PROGRAM BUDGET PROPOSAL OF THE WORLD HEALTH ORGANIZATION FOR THE REGION OF THE AMERICAS FOR THE BIENNIUM 1990-1991
Summary
The subject.. proposal requires the Executive Committee to make recommendations- to the XXXIII Meeting of the Directing Council in
September 1988. In turn, the Directing Council, functioning as the XL
Regional Committee of WHO, makes its recommendations to the
Director-General of WHO. The regional proposal will become a part of the global
proposal to be presented to the January 1989 WHO Executive Board and the May 1989 World Health Assembly.
WHO Regular Tentative Allocation for 1990-1991
The original instructions received in July 1987 from the Director-General of WHO would have required a program decrease of $2,470,000 (3.9%)
in 1990-1991 from the 1988-1989 program of *62,631,000. The 1990-1991
base would be $60,161,000, plus maximum mandatory cost increases of
$5,370,000 (8.9%). Therefore, the maximum 1990-1991 proposal could not
exceed $65,531,000, which would have represented an increase of $2,900,000 or 4.6% over the original 1988-1989 program of $62,631,000 approved by the
World Health Assembly in May 1987. However, during the recent May 1988
World Health Assembly, a resolution (WHA41.10) was approved which reduced
the 1988-1989 global WHO program budget by $25,000,000. This Region's
share of the global program reduction is $2,470,000, $967,000 or 39.1% of the total program reduction in Country Activities and $1,503,000 or 60.9% in Regional and Intercountry Activities.
The several parts of Table I show the maximum 1990-1991 proposal allowed by the Director-General's instructions compared to the original 1988-1989 program (Part A) and the recently revised 1988-1989 program
(Part B). Part C shows the actual 1990-1991 proposal compared to the
revised 1988-1989 program. As noted in Parts A and B of Table I, the maximum cost increase permitted by the Director-General's instructions is
CE101/20 (Eng.) Page 2
This maximum cost increase would result in an overall increase from the original 1988-1989 allocation to the 1990-1991 proposal of 4.6% or 52,900,000. The maximum cost increase related to the revised 1988-1989 allocation is 8.9% or $5,370,000.
Part C of Table I shows the actual proposal compared to the revised
1988-1989 base. The overall cost: increases actually calculated amount to
8.1% or $4,866,000. The 1990-1991 proposal is, therefore, $504,000 less
than the maximum permitted.
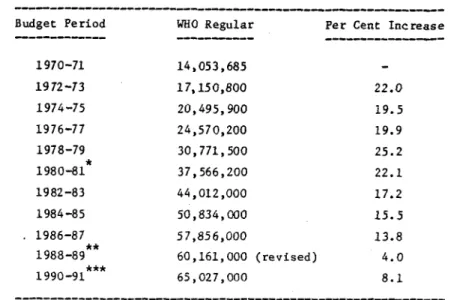
Parts A and B of Table II show the WHO Regular regional budget history since 1970-1971 and illustrate the decline in increases in the
past several years. During the four-year period, 1986 through 1989, this
Region's WHO Regular funds have been reduced by $9,317,000 or 7.7% of the original allocations.
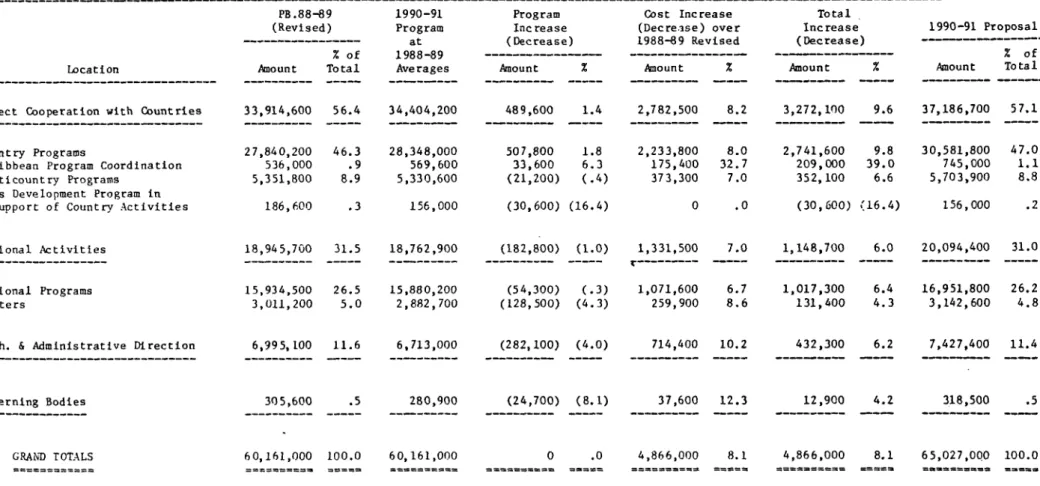
Table III shows the funds distributed by location. The 1988-1989
program is adjusted to the reduction approved by the May 1988 World Health
Assembly. Direct Cooperation with Countries increases from 56.4% in
1988-1989 to 57.1% of the total in 1990-1991. Country Programs increase
from 46.3% to 47.0% of the total. While Country Programs amount to 47.0%
of the proposal, they receive 56.3% of the 54,866,000 overall increase proposed. In an effort to offset the program reduction in Country Programs in 1988-1989, the 1990-1991 proposal includes program increases of $507,800 which, except for a small program increase of $33,600 in Caribbean Program Coordination, is the only program increase in the proposal.
The rather large cost increase of 32.7% in Caribbean Program Coor-dination is caused primarily by increases in local United Nations salary scales in Barbados since early 1986 when the 1988-1989 base was originally calculated.
Analysis of the Programs
During its meeting in April 1988, the Subcommittee on Planning and Programming reviewed the program reduction in general terms. At that time, the instructions of the Director-General required a program reduction of 52,470,000 to the 1990-1991 program. The resolution of the May 1988 World Health Assembly, however, calls for the program reduction against the 1988-1989 program. Since the reduction was anticipated, the Subcommittee reviewed the subject during its meeting in December 1987. The Subcommittee in both December 1987 and April 1988 urged the Director to be guided by the program priorities established by the Governing Bodies when considering programs reductions.
CE101/20 (Eng.) Page 3
Vaccines, and Acquired Immune Deficiency Syndrome (AIDS). Smallpox
Eradication and Surveillance has been dropped from the classification structure.
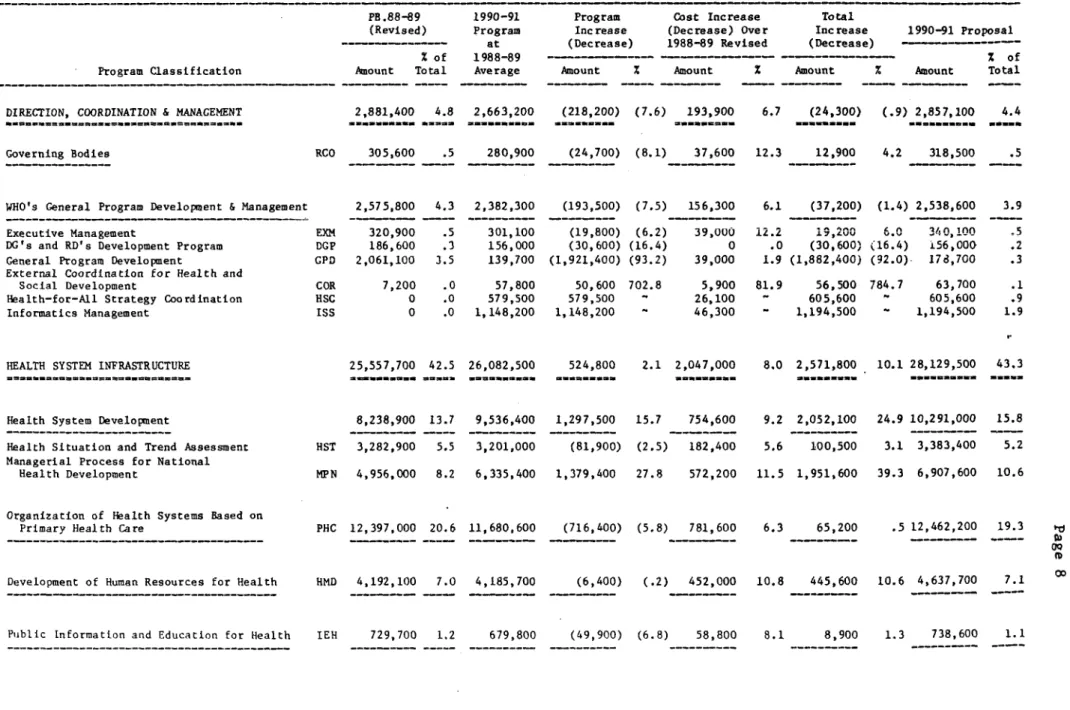
Specifically, in Table IV, General Program Development has been reduced because of the transfer of the office of Analysis and Strategic Planning Coordination to the new classification on Health for All Strategy
Coordination. Likewise, the office of Information Coordination has been
transferred to the new classification of Informatics Management. The
increase under External Coordination for Health and Social Development is due to budgeting a secretarial post for 24 months in 1990-1991 compared to
the deletion of 21 months in 1988-1989. This main part of the program
budget, Direction, Coordination and Management, has been reduced from 4.8% of the total in 1988-1989 to 4.4% in 1990-1991.
The following major part, Health System Infrastructure, has been increased from 42.5% of the total in 1988-1989 to 43.3% in 1990-1991, this
part being one of the main priorities of the Organization. The Managerial
Process for National Health Development was increased due to a redefini-tion of programs under Organizaredefini-tion of Health Systems Based on Primary Health Care.
The next major part, Health Science and Technology, is 38.2% of the total in 1990-1991 compared to 38.3% in 1988-1989 despite the required
program reductions. Nutrition was increased by the addition of a Food
Economics Advisor. Workers' Health was reduced by the deletion of a
professional post.
Protection and Promotion of Mental Health was revised to concen-trate the funds under Prevention and Treatment of Mental and Neurological Disorders, although $50,000 of the funds were transferred to Tobacco or Health.
The main change under Promotion of Environmental Health involved the transfer of the Pan American Center for Human Ecology and Health from Community Water Supply and Sanitation to Control of Environmental Health Hazards.
Within Diagnostics, Therapeutic and Rehabilitative Technology, the funds under Drug and Vaccine Quality, Safety and Efficacy were transferred to Essential Drugs and Vaccines.
Under Disease Prevention and Control, this Region was required to
take over the full funding of the two posts under Tropical Disease
Research. The increase on Acute Respiratory Infections and the decrease
on Tuberculosis simply involve the transfer between PAHO and WHO Regular
funding. The funds under Sexually Transmitted Diseases were transferred
CE101/20 (Eng.) Page 4
Program Support has been reduced from 14.4% of the total in 1988-1989 to 14.1% in 1990-1991. This is a difficult part of the program budget to reduce since it is mainly composed of personnel costs and the general operating expenses of the Headquarters buildings. However, reduc-tions were made in contractual services in Health Information Support and savings have been managed in the general operating expenses. A
profes-sional Budget Officer post was deleted.
Overall, the parts devoted to Direction, Coordination and
Manage-ment and Program Support receive 23.6% of the $2,470,000 reduction in
1988-1989 while requiring 18.5% of the total program budget. The purely technical parts of the program, Health System Infrastructure and Health
Science and Technology, receive 76.4% of the reduction while consuming
81.5% of the total program budget.
It should be noted that the 1990-1991 proposal concerning the PAHO Regular portion of the program budget will be presented to the Executive Committee next year in OfficiaL Document No. 226, which will show the combined PAHO and WHO Regular programs, as well as the extrabudgetary funds committed.
As noted in the previous Summary, it is the responsibility of this Executive Committee to make recommendations concerning the 1990-1991 WHO Regular Program Budget to the X}XXIII Meeting of the Directing Council (WHO
Regional Committee). The 1990-1991 program is proposed to increase by
3.8% over the original 1988-1989 allocation and 8.1% over the revised
PART A - WHO REGULAR 1990-91 TENTATIVE MAXIMUM ALLOCATION COMPARED TO 1988-89 ORIGINAL ALLOCATION
Maximum Increase
% of 1990-91 Cost Increase from 1988-89
1988-89 % of Program Total Program % of Over 1990-91 1990-91 % of (Original) Location (Original) Total Reduction Reduction Base Total Program Base (Maximum) Total to 1990-91
Country Activities 28,807,200 46.0 (967,000) 39.1 27,840,200 46.3 2,784,000 30,624,200 46.7 1,817,000
(3.4X) 10.0%
6.3% Regional and
Inter-country Activities 33,823,800 54.0 (1,503,000) 60.9 32,320,800 53.7 2,586,000 34,906,800 53.3 1,083,000
(4.4%) 8.0%
3.2% TOTAL 62,631,000 100.0 (2,470,000) 100.0 60,161, 00 100.0 5,370,000 65,531,000 100.0 2,900,000
(3.9%) 8.9% 4.6%
PART B - WHO REGULAR 1990-91 TENTATIVE MAXIMUM ALLOCATION COMPARED TO 1988-89 REVISED ALLOCATION
Maximum Increase
1990-91 Cost Increase from 1988-89
1988-89 % of Program Program % of Over 1990-91 1990-91 % of (Revised) Location (Revised) Total Reduction Base Total Program Base (Maximum) Total to 1990-91
Country Activities 27,840,200 46.3 - 27,840,200 46.3 2,784,000 30,624,200 46.7 2,784,000
10.0% 10.0%
Regional and
Inter-country Activities 32,320,800 53.7 32,320,800 53.7 2,586,000 34,906,800 53.3 2,586,000
8 0% 8.0%
TOTAL 60,161,000 100.0 - 60,161,000 100.0 5,370,000 65,531,000 100.0 5,370,000
8.9% 8.9%
PART C - WHO REGULAR 1990-91 PROPOSED PROGRAM BUDGET COMPARED TO 1988-89 REVISED ALLOCATION
Increase
Program 1990-91 Projected from 1988-89
1988-89 % of Increase Program % of Cost Increase 1990-91 % of (Revised) Location (Revised) Total (Decrease) Base Total Over 1988-89 (Proposed) Total to 1990-91
Country Activities 27,840,200 46.3 507,800 28,348,000 47.1 2,233,800 30,581,800 47.0 2,741,600
1.8% 8.0% 9.8%
Regional and
Inter-country Activities 32,320,800 53.7 (507,800) 31,813,000 52.9 2,632,200 34,445,200 53.0 2,124,400
(1.5%) 8.1% 6.6%
TOTAL 60,161,000 100.0 60,161,000 100.0 4,866,000 65,027,000 100.0 4,866,000
8.1% 8.1%
…---
-…--- - --____ _____ _____ _____ _____ _____-…_____________________-_ - ____- __ _ ________ - -_________ …-…_- ________-- __________- _
mc
09
0-o1
TABLE II
PART A - WHO REGULAR REGIONAL BUDGET HISTORY PART B - WHO REGULAR REGIONAL BUDGET HISTORY
Budget Period WHO Regular Per Cent Increase Budget Period
___________
WHO Regular Per Cent Increase
_ _ _ _ _ _ _ _ _ _ _ _ _
14,053,685 17,150,800 20,495,900
24,570,200
30,771,500
37,566,200
44,012,000
50,834 000
57,856,000
62,631,000 (original)
65,027,000
22.0 19.5 19.9 25.2 22.1
17.2
15.5 13.8 8.3 3.8
1970-71 1972-73
1974 -75
1976-77 1978-79
1980-81
1982-83
1984 -85
1986-87
1988-89
1990-91
14,053,685
17,150,800
20,495,900
24,570,200
30,771,500
37,566,200
44,012,000
50,834,000
57,856,000
60,161,000 (revised)
65,027,000
First biennial
Proposed
budget period First biennial budget period
**
Revised by Resolution WHA 41.10 of May 1988
Proposed
1970-71 1972-73 1974-75 1976-77 1978-79 1980-81 1982-83 1984-85 1986-87 1988-89 1990-91
**
22.0
19.5
19.9
25.2 22.1 17.2 15.5 13.8
4.0
8.1
0Q(DO
N
O
m
0
01
______II_____________11__1__________
_____I_
---TABLE III
ANALYSIS OF THE TENTATIVE PROGRAM BUDGET PROPOSAL FOR 1990-91 - WHO REGULAR COMPARISON OF REVISED PB.88-89 AND PB.90-91
BY LOCATION
PB.88-89 1990-91 (Revised) Program
--- ---
~
- -at-% of 1988-89
Amount Total Averages
Program Inc trease (Decrease)
Amount % _ _ _ _ _ _ _ _ _ _
-Cost Increase
(Decrease) over 1988-89 Revised
Amount %
- _ -_ _ _ __-
-Total Increase (Decrease)
Amount %
_ _ _ _ _ _ _ _ _ _
1990-91 Proposal
% of Amount Total
Direct Cooperation with Countries 33,914,600 56.4 34,404,200 _ _ _ _ _ _ _ -_ - - - -_ -_ _ _
489,600 1.4 -_ -_- _-- - - - _ _
-2,782,500 8.2 3,272,100 9.6 37,186,700 57.1
Country Programs
Caribbean Program Coordination Multicountry Programs
RD's Development Program in Support of Country Activities
27,840,200 536,000 5,351,800
46.3 .9
8.9
28,348,000 569,600
5,330,600
186,600 .3 156,000
507,800 33,600 (21,200)
1.8 6.3
(.4)
2,233,800 175,400
373,300
(30,600) (16.4)
8.0 32.7
7.0
2,741,600
209,000
352, 100
9.8 39.0
6.6
0 .0 (30,600) (16.4)
Regional Activities
___________________
18,945,700 31.5 18,762,900 _ _ -_ _ _ - - _ _ - - - -_ - - _ __--
-(182,800) (1.0)
_ _ _ _ _ _ _ _ _ _
-1,331,500
r---…--7.0 1,148,700 6.0 _ _ _ _ _ _ _ _ _ - _ _
20,094,400 31.0 _ _ _ _ _ _ _ _ _ - _ _ _ _
Regional Programs Centers
15,934,500 26.5 15,880,200 3,011,200 5.0 2,882,700
(54,300) (.3) (128,500) (4.3)
1,071,600 6.7 259,900 8.6
1,017,300 6.4 16,951,800 26.2 131,400 4.3 3,142,600 4.8
Tech. & Administrative Direction
Governing Bodies
________________
6,995, 100 11.6 _ _ _ _ _ _ _ _ _ _ _ _ _ _
305,600 .5 _ _ _ _ _ _ _ _ _ _
-6,713,000 _________
280,900 _________
(282,100) (4.0)
(24,700) (8.1)
_ _ _ _ _ _ _ _ _ _ _ _
_-714,400 10.2
37,600 12.3 _ _ _ _ _ _ _ _ _ _ _ _ _
432,300 6.2
12,900 4.2 _ _ _ _ _ _ _ _ - _ _ _
7,427,400 11.4
318,500 .5 _ _ _ _ _ __ _ _ _ _ _
60,161,000 100.0 60,161,000 0 .0 4,866,000 8.1
-====-== =.=== ====-==== =====.
4,866,000 8.1 -======= ====,.
65,027,000 100.0 =----=....= .=,==,
Location
____________-_-_-__________________
30,581,800
745,000 5,703,900
156,000
47.0 1.1
8.8
.2
GRAND TOTALS
Pt
Q-- Q-- Q-- Q--Q--Q-- Q-- Q--Q-- Q--Q--Q-- Q--Q--Q-- Q-- Q--Q--Q-- Q-- Q--Q-- Q-- Q-- Q-- Q-- Q-- Q-- Q-- Q--Q--Q-- Q--Q-- Q-- Q-- - -- - - --- -- - --- -- - - -
--TABLE IV
ANALYSIS OF THE TENTATIVE PROGRAM BUDGET PROPOSAL FOR 1990-91 - WHO REGULAR COMPARISON OF REVISED PB.88-89 AND PB.90-91
BY WHO PROGRAM CLASSIFICATION
Program Classification
A. DIRECTION, COORDINATION & MANAGEMENT
...- ... =... w
PB.88-89 (Revised)
% of
Amount Total
1990-91
Program at 1988-89
Average
2,881,400 4.8 2,663,200 ... ... ... . .. ...
Program
Increase
(Decrease)
Cost Increase (Decrease) Over 1988-89 Revised
Amount % Amount
(218,200) (7.6) 193,900
Total Inc rease
(Decrease)
x Amount
1990-91 Proposal
% of % Amount Total
6.7 (24,300) (.9) 2,857,100 4.4
1. Governing Bodies ____________
2. WHO's General Program Development & Management
Executive Management
DG's and RD's Development Program General Program Development
External Coordination for Health and Social Development
Health-for-All Strategy Coordination Informatics Management
RCO 305,600 .5
2,575,800
EXM 320,900 DGP 186,600 GPD 2,061,100
COR HSC ISS 7,200 0 0 4.3 .5 .3 3.5 .0 .0 .0
280,900 (24,700) (8.1) 37,600 _ _ _ _ _ _ _ _ _ _ _ _ _ _ _ _ _ _ _ _ 2,382,300 301,100 156,000 139,700 57,800 579,500 1,148,200 (193,500) (19,800) (30,600) (1,921,400) 50,600 579,500 1,148,200
(7.5) 156,300
(6.2) 39,000
(16.4) 0
(93.2) 39,000
702.8 5,900 26,100 46,300
12.3 12,900
6.1 12.2 .0 1.9 (37,200) 19,200 (30,600) (1,882,400)
81.9 56,500 - 605,600 - 1,194,500
4.2 318,500
(1.4) 2,538,600
6.0 340,100 (16.4) i56,000 (92.0)- 178,700
784.7 63,700 605,600 ~ 1,194,500
B. HEALTH SYSTEM INFRASTRUCTURE
3. Health System Development
Health Situation and Trend Assessment Managerial Process for National
Health Development
25,557,700 42.5 26,082,500 ,
... _. ... .. at... ...
8,238,900 13.7
HST 3,282,900 5.5
9,536,400
3,201,000
524,800 2.1 2,047,000 ... ... ....
1,297,500
(81,900)
MPN 4,956,000 8.2 6,335,400 1,379,400
15.7 754,600
(2.5) 182,400
27.8 572,200
8.0 2,571,800 10.1 28,129,500 43.3 ,.._... ... ...
9.2
5.6
2,052,100
100,500
24.9 10,291,000
3.1 3,383,400
11.5 1,951,600 39.3 6,907,600 10.6
4. Organization of Health Systems Based on Primary Health Care
5. Development of Human Resources for Health
PHC 12,397,000 20.6 11,680,600 (716,400)
HMD 4,192,100 7.0 4,185,700 (6,400)
(5.8) 781,600
(.2) 452,000
6.3 65,200
10.8 445,600
.5 12,462,200 19.3
10.6 4,637,700 7.1
1'
00
.-6. Public Information and Education for Health
.5 3.9 -5 .2 .3 .1 .9 1.9 15.8 5.2
_______________________________________I I__ _ ___ ____ ____ _1__1 _
1.3 738,600 1.1
_________
-IEH 729,700 1.2 679,800 (49,900) (6.8) 58,800 8.1 8,900
Program Classification
PB.88-89
(Revised)
% of
Amount Total
1990-91 Program at 1988-89 Average Program Increase (Decrease)
Cost Increase
(Decrease) Over 1988-89 Revised
Amount % Amount
Total Increas
(Decreas
2 Amount
se 1990-91 Proposal
se) -- -_
_ _-\ %of
% Amount Total _ - - - -
-C. HEALTH SCIENCE AND TECHNOLOGY ... =.= ,....,.,...
23,080,800 38.3 22,982,600
SAW_... ... ...
(98,200) (.4) 1,881,400 ... ... . ....
8.2 1,783,200
...
7.8 24,864,000 38.2
... ...
7. Research Promotion and Development, including
Research on Health-Promoting Behavior RPD 228,900 .4 228,900 0 .0 13,500 5.9 13,500 5.9 242,400 .4
8. General Health Protection and Promotion
Nutrition
Oral Health Tobacco or Health
2,368,400
NUT 1,915,300 ORH 453,100
TOH 0
3.9 3.1 .8 .0 2,517,400 2,043,400 430,000 44,000 149,000 128,100 (23,100) 44, 000 6.3 6.7 (5.1) 192,800 128,400 58,400 6,000
8.1 341,800
6.7 256,500 12.9 35,300
- 50,000
9. Protection and Promotion of the Health of Specific Population Groups
Maternal and Child Health, including Family Planning
Workers' Health Health of the Elderly
1,972,500 3.2
MCH 1,464,500 OCH 127,400 HEE 380,600
2.4 .2 .6
1,936,500 (36,000) (1.8) 102,400
1,430,500 89,400 416,600 (34,000) (38,000) 36,000 (2.3) (29.8) q9.5 62,700 12,000 27,700 5.2 4.3 9.4 7.3 66,400 28,700 (26,000) 63,700
3.4 2,038,900 3.1
2.0 (20.4) 16.8 1,493,200 101,400 444,300 2.3 .2 .6
10. Protection and Promotion of Mental Health
Psychosocial and Behavioral Factors in Promotion of Health and Human Development Prevention and Control of Alcohol and
Drug Abuse
Prevention and Treatment of Mental and Neurological Disorders
899,200 1.5
PSF 384,600 .6
ADA 342,200
MND 172,400 .6
.3
893,100 (6,100) _ _ - -_ -___
(.7) 68,100
0 (384,600) (100.0)
321,200 (21,000) (6.1)
571,900 399,500 231.7
7.6 62,000
0 .0 (384,600) (1(
20,600 6.0
47,500 27.6
6.9 961,200 1.5
00.0) 0 .0
(400) (.1) 341,800 .5
447,000 259.3 619,400 1.0
11. Promotion of Environmental Health
Community Water Supply and Sanitation Control of Environmental Health Hazards Food Safety
5,616,300
CWS 5,082,400
CEH 0
FOS 533,900 9.3 8.4 .0 .9 5,443,400 4,292,500 649,900 501,000
(172,900) (3.1)
(789,900) (15.5) 649,900
(32,900) (6.2)
12. Diagnostic, Therapeutic, Rehabilitative Technology
Clinical, Laboratory and Radiological Technology for Health Systems Essential Drugs and Vaccines
Drug and Vaccine Quality, Safety and Efficacy
937,200 1.6
CLR 214,900 EDV 271,000 DSE 451,300
.4 .5 .7
913,900 (23,300) (2.5)
205,000 (9,900) 708,900 437,900
O (451,300)
(4.6) 161.6 (100.0)
75,800 8.1
30,600 14.2 45,200 16.7
O .0
52,500
20,700 483,100 (451,300)
5.6 989,700 1.5
9.6 178.3 (100. 0)
235,600 754,100 0 .4 1.1 .0 14.4 13.4 7.8 2,710,200 2,171,800 488,400 50,000 4.2 3.3 .8 .1 458,800 397,600 34,400 26,800 8.2 7.8 5.0 285,900 (392,300) 684,300 (6,100) 5.1 (7.7) (1.2) 5,902,200 4,690,100 684,300 527,800 9.1 7.2 1.1
.8 0 C
to
0
II---Program Classification
PB.88-89 (Revised)
% of Amount Total
1990-91 Program
at 1988-89
Average
Program Cost Increase Increase (Decrease) Over (Decrease) 1988-89 Revised
Amount % Amount
Total
Inc reas (Decreas
% Amount
ie 1990-91 Proposal
se)
% of
% Amount Total
13. Disease Prevention and Control
Immunization
Disease Vector Control Malaria
Parasitic Diseases Tropical Disease Research Diarrheal Diseases
Acute Respiratory Infections Tuberculosis
Leprosy
Zoonoses
Sexually Transmitted Diseases AIDS
Other Communicable Disease Prevention and Control Activities
Blindness and Deafness
Other Noncommunicable Disease Prevention and Control Activities
EPI VBC MAL PDP TDR CDD ARI TUB LEP VPH VDT CPA 11,058,300 1,356,000 2,035,200 1,598,000 293,800 0 138,400 0 416,300 298,100 1,989,800 90,600 0
OCD 2,565,300 PBD 118,900
18.4 2.3 3.4 2.6 .5 .0 .2 .0 .7 .5 3.3 .2 .0 4.2 .2
NCD 157,900 .3
11,049,400 1,356,000 1,989,600 1,734,700 268,200 182,000 138,400 191,600 116,400 263,700 1,864,200 0 90,000 2,590,200 117,900 (8,900) 0 (45,600) 136,700 (25,600) 182,000 0 191,600 (299,900) (34,400) (125,600) (90,600) 90,000
(.1) 970,000
.0 (2.2) 8.6 (8.7) .0 (72.0) (11.5) (6.3) (100.0) 208,600 139,100 112,900 14,400 24,400 11,700 5,000 11,300 19,500 183,100 0 10,000
24,900 1.0 204,800 (1,000) (.8) 13,800
146,500 (11,400) (7.2) 11,400
8.8 15.4 6.8 7.1 4.9 8.5 2.7 6.5 9.2 .0 961,106 208,600 93,500 249,600 (11,200) 206,400 11,700 196,600 (288,600) (14, 900) 57,500 (90, 600) 100,000
8.7 12,019,400
15.4 1,564,600 4.6 2,128,700
15.7 1,847,600 (3.8) 282,600
- 206,400
8.5 150,100 - 196,600
(69.3) 127,700 (5.0) 283,200 2.9 2,047,300
(100.0) 0
- 100,000
8.0 229,700 9.0 2,795,000 11.6 .L. 12,800 L,OVU in... .I.Uo AlU,
-7.2 0 .0 157,900
D. PROGRAM SUTPORT == ====== =====
8,641,100 14.4 8,432,700 (208,400) (2.4) 743,700 8.6 535,300 6.2 9,176,400
14. Health Information Support
15. Support Services
Personnel
General Administration and Services Budget and Finance
Equipment and Supplies for Member States
GRAND TOTALS ==== i===~====
HBI 3,005,300 5.0 3,044,200
5,635,800
PER 786,800 PGS 3,193,900 BFI 1,287,800 SUP 367,300
9.4 1.3 5.3 2.2 .6 5,388,500 766,900 2,955,500 1,313,600 352,500 38,900 (247,300) (19,900) (238,400) 25,800 (14,800)
60,161,000 100.0 60,161,000
== == .. = -. =
-1.3 144,700
(4.4) 599,000
(2.5) 51,500 (7.5) 369,200 2.0 162,400 (4.0) 15,900
0 .0 4,866,000
4.8 183,600
10.6 351,700
6.5 31,600 11.6 130,800
12.6 188,200
4.3 1,100
8.1 4,866,000
6.1 3,188,900
6.2 5,987,500
4.0 818,400 4.1 3,324,700 14.6 1,476,000
.3 368,400
8.1'65,027,000 18.5 2.4 3.4 2.8 .4 .3 .2 .3 .2 .4 3.1 .0 .2 4.3 .2 .2 ……---14.1 4.9 9.2 1.3 5.1 2.2 .6
100.0 m, t
os rr
I-
0Wz