Role of Personal Factors in Academic Success
and Dropout of IT Students: Evidence From
Students and Alumni
Dijana Oreški
1, Goran Hajdin
1,
Božidar Kliček
11
Faculty of Organization and Informatics, University of Zagreb, Pavlinska 2, Varaždin, Croatia
Abstract –Aims of the study were three fold: to identify the factors which are able to explain academic success of IT students, to explore differences in perception of current students and alumni and to explore differences between genders. In order to achieve the research goals, neural networks and t-test were applied. The study was based on three sets of factors related to academic success, academic failure and dropout. The results indicate gender differences and differences between students’ and alumni responses, especially in their perception of academic failure. Age, students’ status and rank position at enrollment have been shown as the most important determinants of academic success.
Keywords –Academic success, academic failure, dropout, alumni, gender differences.
1. Introduction
Education is of strategic importance for the development of knowledge society. The analysis of academic success is very important for the economy of a country, its presence in the competing and challenging market, but also for education system which is a drive for modern economies. Analysis of academic success is also important for higher
DOI: 10.18421/TEM53-18
https://dx.doi.org/10.18421/TEM53-18
Corresponding author: Dijana Oreški,
Faculty of Organization and Informatics, University of Zagreb, Pavlinska 2, Varaždin, Croatia
Email: dijana.oreski@foi.hr
© 2016 Dijana Oreški, Goran Hajdin,
Božidar Kliček, published by UIKTEN.
This work is licensed under the Creative Commons Attribution-NonCommercial-NoDerivs 3.0 License. The article is published with Open Access at www.temjournal.com
education institutions, since „strategic planning of study programme implies extension or reduction of the scope or depth of studying material as well as modification of the structure of pedagogical and educational process, depending on the students’ success“ [14]. Enhancing academic success has been one of the major challenges in higher education in the last two decades [1-3], [5, 9, 12, 14, 16].
Despite the large number of studies and topic continuity over longer period, previous researches had contradictory findings related to the factors influencing academic success.
to investigate the relations between student characteristics and academic success in the Croatian IT context. It should be noted that most of these prior studies have primarily been focused on perspective of current students. Our study also extends prior research in one other way: we are taking into account alumni perspective and comparing it to thestudents` perception according to the three sets of factorsrelated to academic success, academic failure and dropout.
2. Research methodology
Three types of data mining approaches were conducted in this study. The first approach is descriptive which is concerned with the nature of the dataset such as the frequency table and the average values with standard deviations. In addition, t-test is conducted to determine possible differences between students and alumni, and between genders. The third type of data mining approach, i.e. predictive data mining, is conducted by using four different methods: discriminant analysis, regression analysis, decision trees and neural networks. Among the four methods the neural network models have shown the best results and thus are presented in the paper.
a. T - test
Gender and student-alumni group differences in the perception of success, failure and retention factors were tested using a t-test. Included in each linear model were the nine factors of success, nine factors of failure and ten factors related to retention. Factors are listed in the Table 1. All statistical analyses were conducted using SAS JMP. Statistical significance was set at p < 0.05.
b. Neural networks
In the academic success prediction literature the traditional approaches use discriminant analysis, logistic regression or multiple regression. Interest among researchers for applying data mining techniques (neural networks and decision trees) to this domain has been growing. Several previous research papers demonstrated better success of data mining techniques over traditional statistical approaches and indicated their significant potential in providing useful predictive models [2, 5,11,12].
Artificial neural networks (ANN) offer many advantages over conventional statistical methods [2, 5]. Artificial neural networks are non-linear mapping systems with a structure loosely based on principles observed in biological nervous systems. The ANN
uses the data to develop an internal representation of the relationship between the variables, and does not make assumptions about the nature of the distribution of the data. Another advantage is that while traditional approaches are not adaptive, artificial neural networks read just their weights as new input data becomes available [2, 5]. The model we used in this paper is based on a special case of a feed-forward neural network known as a multi-layer perception (MLP). Regarding the network topology used here, our findings are that one hidden layer is enough to predict academic success with a very high accuracy and reliability. Number of nodes in hidden layer was 18 ((number of input variables+number of output variables)/2) Kfoldcrossvalidation was used as validation method.
3. Research results
Results are presented in three parts. First, the means and standard deviations of the variables used in the analyses are reported in subsection 3.1. Neural network analyses were conducted to investigate which student characteristics are associated with academic success. Predictors were: age, gender, student status, rank position, study programme, factors of academic success, factors of academic failure and academic dropout factors. Academic success (measured with grade point average, GPA) was dependent variable. Results are presented in subsection 3.2.
The t-test results in subsections 3.3. and 3.4. showthe student-alumni and gender differences in perception of factors which are determinants of academic success, failure or dropout. However, the analysis of the differences has not controlled effects of other determining factors such as how age, study programme and other factors will affect student`s success.
3.1.Data description
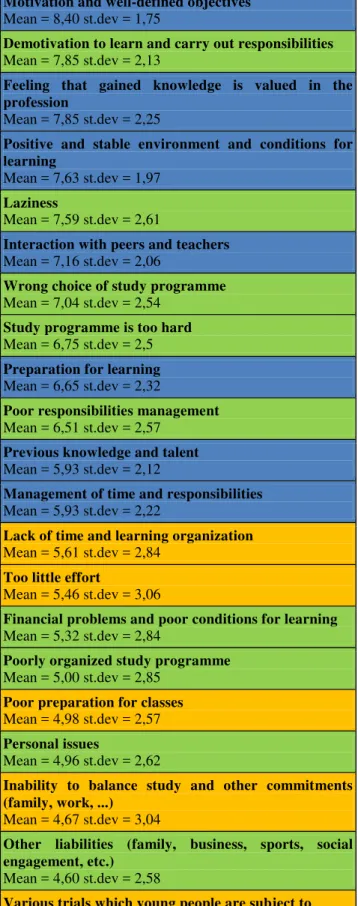
questionnaire and respective descriptive statistics for each of the variables. Variables are presented and annotated as follows: demographic variables (red color), success factors (blue color), factors of failure (orange color) and dropout factors (green color). All variables are sorted by mean values. Variables defining success (gray color) are positioned at the end of the table. For the each factor in three groups (academic failure, success and dropout) respondents were asked to grade importance of each factor with points from 0 to 10.GPA is in the range from 2.00 to 5.00, since grades are from 1 (lowest) to 5 (highest) in Croatian system.
Sample comprised of 41,67% of females and 58,33% males. Most of the respondents are (were) enrolled in graduate study of informatics (37,38%), followed by undergraduate study of economics (23,36%) and professional study programme (20,79%). Average age of respondents is 25 years.
Table 1. Variables description and descriptive statistics (gray - sociodemographic characteristics, blue - success factors, orange - failure factors, green - retention factors, red – variables defining success)
Study programme
Undergraduate study of Informatics 7,9%
Undergraduate study of Economics 23,36%
raduate study of Informatics 37,38%
Graduate study of Economics 7%
Professional study programme 20,79%
Postgraduate study 3,57%
Age
Mean = 25,29, st.dev = 7,23
Gender
Female = 215, Male = 301
Student status
Value Probability
Switched from full time to part time 7,20
Part time student 10,70
Part time student (employed) 6,23
Full time student 75,87
Rank position when enrolling the study programme
Value Probability
After two hundred 5,305
First ten 17,878
First two hundred 16,896
First fifty 34,774
First hundred 25,147
Student or alumni Alumni 162 Students 354
Persistence
Mean = 8,78 st.dev = 1,66
Availability of learning materials Mean = 8,51 st.dev = 1,78
Motivation and well-defined objectives Mean = 8,40 st.dev = 1,75
Demotivation to learn and carry out responsibilities Mean = 7,85 st.dev = 2,13
Feeling that gained knowledge is valued in the profession
Mean = 7,85 st.dev = 2,25
Positive and stable environment and conditions for learning
Mean = 7,63 st.dev = 1,97
Laziness
Mean = 7,59 st.dev = 2,61
Interaction with peers and teachers Mean = 7,16 st.dev = 2,06
Wrong choice of study programme Mean = 7,04 st.dev = 2,54
Study programme is too hard Mean = 6,75 st.dev = 2,5
Preparation for learning Mean = 6,65 st.dev = 2,32
Poor responsibilities management Mean = 6,51 st.dev = 2,57
Previous knowledge and talent Mean = 5,93 st.dev = 2,12
Management of time and responsibilities Mean = 5,93 st.dev = 2,22
Lack of time and learning organization Mean = 5,61 st.dev = 2,84
Too little effort
Mean = 5,46 st.dev = 3,06
Financial problems and poor conditions for learning Mean = 5,32 st.dev = 2,84
Poorly organized study programme Mean = 5,00 st.dev = 2,85
Poor preparation for classes Mean = 4,98 st.dev = 2,57
Personal issues
Mean = 4,96 st.dev = 2,62
Inability to balance study and other commitments (family, work, ...)
Mean = 4,67 st.dev = 3,04
Other liabilities (family, business, sports, social engagement, etc.)
Mean = 4,60 st.dev = 2,58
Various trials which young people are subject to Mean = 4,09 st.dev = 3,07
Subject matter is too hard Mean = 4,03 st.dev = 2,92
Unavailable learning materials Mean = 4,00 st.dev = 3,04
Health issues
Mean = 3,12 st.dev = 2,59
Health problems Mean = 2,01 st.dev = 2,68
How do you rate your success as a student Mean = 6,39, st.dev = 2,13
GPA
Value Probability
2,00 - 2,30 2,390
2,31 - 2,60 4,582
2,61 - 2,90 11,355
2,91 - 3,20 22,908
3,21 - 3,50 21,116
3,51 - 3,80 15,339
3,81 - 4,10 11,554
4,11 - 4,40 5,179
4,41 - 4,70 3,386
4,71 - 5,00 2,191
Distribution of factors in Table 1.shows that success factors have been ranked higher according to the average value. This indicates that students recognize success factors more as those that influence academic success. On the other hand, students recognize less factors related to academic failure as those which should influence it. Six out of eleven of the dropout factors have been recognized by students as those which influence more academic dropout: Demotivation to learn and carry out responsibilities, Positive and stable environment and conditions for learning, Laziness, Wrong choice of study programme, Study programme is too hard and Poor responsibilities management.
Interesting to note is that health issues and problems are recognized by students as the ones with least impact among academic failure factors as well as academic dropout factors. In addition, students recognized motivation as one of the key elements in both academic success and academic dropout factors. Another factor, which is closely connected in two groups, is time management that is recognized similar as factor of academic success and academic failure.
Opposite results related to difficulty of study programme (Study programme is too hard among academic dropout factors and Subject matter is too hard among academic failure factors) indicate that students are more likely to quit the subject than cope with tough challenges. Same can be concluded for the learning environment (Inadequate environment and conditions for learning and Positive and stable environment and conditions for learning).
3.2.Factors determining success
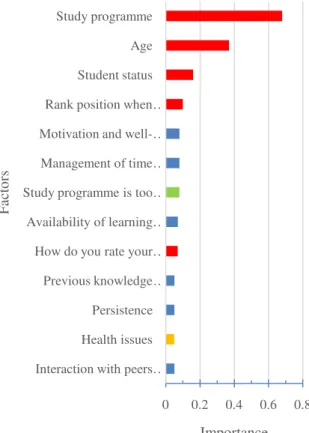
In order to get a better insight into the importance of the input variables (demographic variables, academic success factors, academic failure factors and dropout factors) for output variable (GPA), we have performed sensitivity analysis in which the impact of certain input variable of the model on the output variable has been analyzed. For the purposes of this study SAS JMP software package was used in neural network modelling.
Figure 1. Importance of factors for GPA (red - sociodemographic characteristics, blue - success factors, orange - failure factors, green - retention factors)
Student status factor can be related to the time management factor mentioned in chapter 3.1. According to the data received from students’ administration office full time students are more successful than part time students. This is closely related to available study time and time management where full time students have more study time available than part time students.
3.3.Differences between current students and alumni in perception of factors
Table 2.summarizes the survey responses and shows differences in perception of factors between students and alumni. The F statistic and level of significance are presented in first two columns. Significance of the difference is presented in column Sig. (2-tailed) followed by mean difference. The order of variables is by mean difference, with the highest difference presented first. Only statistically significant differences are presented in table 2.
Table 2.T-test for student alumni differences(gray–variables defining success, blue - success factors, orange - failure factors, green - retention factors)
Factors
S
tu
d
./A
lu
m
n
i
Levene’s Test for Equality of Variances
t-test for Equality of Means
t df Sig. (2-tailed)
Mean diff.
Std. Error
diff.
Mean F Sig.
How do you rate your success as student
S 18,96 0 -9,68 513 <0,001 -1,82 0,188 5,844 A -10,6 372,71 <0,001 -1,82 0,171 7,664
Inability to balance study and other commitments (family, work,.)
S 1,651 0,199 4,173 512 <0,001 1,2 0,288 5,039
A 4,26 306,68 <0,001 1,2 0,282 3,839
Subject matter is too hard S 0,168 0,682 3,917 514 <0,001 1,083 0,276 4,359 A 3,959 301,88 <0,001 1,083 0,273 3,276 Lack of time and learning
organization
S 0,85 0,357 3,782 514 <0,001 1,018 0,269 5,922 A 3,719 283,43 <0,001 1,018 0,274 4,904
Availability of learning materials S 9,969 0,002 5,973 513 <0,001 0,988 0,165 8,814 A 5,454 241,2 <0,001 0,988 0,181 7,826
Poorly organized study programme S 0,447 0,504 2,746 511 0,006 0,748 0,272 5,235 A 2,723 289,75 0,007 0,748 0,275 4,487
Positive and stable environment and conditions for learning
S 0,385 0,535 3,727 510 <0,001 0,699 0,187 7,840
A 3,659 283,48 <0,001 0,699 0,191 7,141
Previous knowledge and talent S 2,443 0,119 2,527 514 0,012 0,534 0,211 6,092 A 2,675 337,48 0,008 0,534 0,2 5,558 Management of time and
responsibilities
S 2,1 0,148 2,509 512 0,012 0,457 0,182 8,073 A 2,444 278,06 0,015 0,457 0,187 7,616
0 0.2 0.4 0.6 0.8
Interaction with peers … Health issues
Persistence Previous knowledge … How do you rate your … Availability of learning … Study programme is too … Management of time … Motivation and well-… Rank position when …
Student status Age Study programme
Importance
F
act
o
We find that students’ average scores are higher than those of alumni`s for all variables except evaluation of own success. According to the highest and most significant difference between students and alumni related to the evaluation of their own success interesting to note is that alumni evaluate themselves statistically significantly higher than students. This could be related to alumni’s perception of their own success since they have finished university and many of them are employed. On the other hand, most students perceive their own success only through academic success (GPA, competitions, etc.).
Students and alumni have more diverse opinion related to academic failure factors and more coherent opinion related to academic success factors.One factor that stands out from the rest of the results is Management of time and responsibilities. It has much lower statistical significant difference than two closely related factors (Inability to balance study and other commitments and Lack of time and learning organization) which both have much higher statistical significant difference between students’ and alumni’s opinion.
3.4.Gender differences in perception of factors
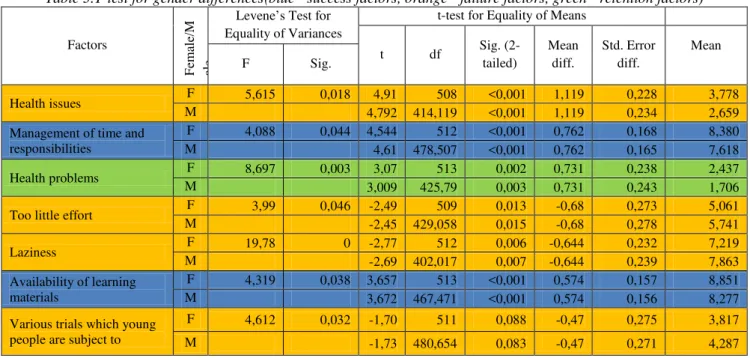
After conducted analysis of gender differences we can conclude that both genders are consistent in their answers. Male survey participants place more value on factors related to time management and motivation, such as Too little effort, Laziness and Various trials which young people are subject to. Since time management and motivation characterize entrepreneurial behavior, our results are in
accordance with the results of Kedmenec et al. [7], who found that in Croatian context male students have higher entrepreneurial intentions than female students. Female survey participants primarily place more value on factors related to health, such as Health issues (one of the academic success factors) and Health problems (one of the academic dropout factors). In line with this, Lammers, Onweugbuzie and Slatefound [9] found that female students were more likely to complete assignments several days before they were due to provide enough time to make necessary revisions, and were less likely to loaf when they should have been studying. In addition, according to Jansen and Bruinsm[6] females are more effective in the first and second year of higher education. This suggests that gender differences exist in academic performance. According to findings from several other studies (e.g., [1, 8, 10]), our research confirmed that good pre-university knowledge yielded higher achievements in the study. This suggests that prior educational achievements obtained before enrolling in higher education already can provide a basis for students' academic success and based on this, study success could be fairly accurately predicted.Compared with the previous literature, students in the present study had a tendency to rely on their own abilities and blame themselves for failure, rather than claiming this on others. This is contrary to results of Guney [4]. Guneyemphasised lecturer influence as the strongest factor for students’ success. However, our findings are consistent with prior research (e.g. [13]) showing that age has strong effects on academic achievement.
Table 3.T-test for gender differences(blue - success factors, orange - failure factors, green - retention factors)
Factors
F
em
al
e/
M
al
e
Levene’s Test for Equality of Variances
t-test for Equality of Means
t df Sig. (2-tailed)
Mean diff.
Std. Error diff.
Mean
F Sig.
Health issues F 5,615 0,018 4,91 508 <0,001 1,119 0,228 3,778 M 4,792 414,119 <0,001 1,119 0,234 2,659
Management of time and responsibilities
F 4,088 0,044 4,544 512 <0,001 0,762 0,168 8,380 M 4,61 478,507 <0,001 0,762 0,165 7,618
Health problems F 8,697 0,003 3,07 513 0,002 0,731 0,238 2,437 M 3,009 425,79 0,003 0,731 0,243 1,706
Too little effort F 3,99 0,046 -2,49 509 0,013 -0,68 0,273 5,061 M -2,45 429,058 0,015 -0,68 0,278 5,741
Laziness F 19,78 0 -2,77 512 0,006 -0,644 0,232 7,219
M -2,69 402,017 0,007 -0,644 0,239 7,863
Availability of learning materials
F 4,319 0,038 3,657 513 <0,001 0,574 0,157 8,851 M 3,672 467,471 <0,001 0,574 0,156 8,277
Various trials which young people are subject to
F 4,612 0,032 -1,70 511 0,088 -0,47 0,275 3,817
4. Conclusion
Aim of the study was to investigate the relationships between a large number of factors and academic success, failure and dropout for undergraduate and graduate students of informatics or economics study programme. We have tried to gain more insight into which factors are consistent contributors to academic success, failure and dropout, and investigate if there are any gender differences in perception of the factors, or differences between current students and alumni.
Previous researches focused on the personal factors in academic success didn’t focus on the alumni. With alumni as a part of the survey we provide a new dimension to the research of academic success factors. Since there are no papers we could compare our alumni results with, there are several open questions for future research: is experience of alumni gained through work environment cause of their lower evaluation of factors related to academic success when compared to students; are conducted changes in higher education which are focused on the quality of study programmes reason for students to evaluate factors related to the academic success higher than alumni? Those are just some of the open questions raised after conducting the survey and analyzing the results.
The results of conducted study show that factors which determine academic success are study programme, age, student status and rank position when enrolling the study programme.
Further results were focused on differences in perception of factors between current students and alumni. The results show that the greatest differences are among factors of academic failure. This issue hasn’t been widely researched and we don’t have any data we could compare our results with.
Third results were related to differences in perception of factors between genders. The results indicate consistency among gender responses. Male survey participants place more value on factors related to time management and motivation. On the other hand, female survey participants primarily place more value on factors related to health.
In future research certain questions could be directed towards further analysis of age factor, especially in correlation with duration of study which is necessary for a student to complete a study programme. This could answer the question if students which finish study programme faster also
have higher GPA. Additional factors could be taken into consideration, especially ones related to academic success, such as time required to finish a study programme.
Because of the different sets of factors used in similar researches it is challenging to decide which factors should be taken into consideration when conducting a survey. Further challenges are faced when determining survey sample. Because of all the challenges one must be careful with generalizations and survey result interpretations. Because of this we didn’t want to make any strong conclusions, but mostly focused on indications and open interpretations of the study results.
References
[1]. Albertini, J. A., Kelly, R. R., &Matchett, M. K.
(2012). Personal factors that influence deaf college students' academic success. Journal of deaf studies and deaf education, 17(1), 85-101.
[2]. Gorr, W. L., Nagin, D., Szczypula, J. (1994).
Comparative study of artificial neural network and statistical models for predicting student grade point averages. International Journal of Forecasting, 10, 17– 34.
[3]. Graunke, S. S., &Woosley, S. A. (2005). An
exploration of the factors that affect the academic success of college sophomores. College Student Journal, 39(2), 367.
[4]. Guney, Y. (2011) Exogenous and Endogenous Factors
Influencing Students’ Performance in Undergraduate Accounting Modules, Accounting Education: an international journal, 18(1), pp.51-73.
[5]. Hardgrave, B. C., Wilson, R. L., Walstrom, K. A.
(1994). Predicting graduate student success: A comparison of neural networks and traditional techniques. Computers and Operations Research, 21, 249–263.
[6]. Jansen, E. P. W. A., Bruinsma, M. (2005). Explaining achievement in higher education. Educational Research and Evaluation, 11, 235–252, doi:10.1080/13803610500101173
[7]. Kedmenec, I; Smajlović, S; Jovanovski, K. Gender differences in the entrepreneurial, political and volunteering intentions of business students // Entrepreneurial Society: Current Trends and Future Prospects in Entrepreneurship, Organization and
Management / Vuković, Ksenija ;Brčić, Ruža ; KlačmerČalopa, Marina, editor(s). Varaždin : Faculty of Organization and Informatics Varazdin, University of Zagreb, 2015. 256-263
[8]. Klicek, B., Oreski, D., Divjak, B., Determining
[9]. Lammers, W. J., Onweugbuzie, A. J., & Slate, J. R. (2001). Academic success as a function of gender, class, age, study habits, and employment of college students. Research in the Schools.
[10]. Lindblom-Ylänne, S., Lonka, K., &Leskinen, E.
(1999). On the predictive value of entry level skills for successful studying in medical school. Higher Education, 37, 239–258,
doi:10.1023/A:1003574125457.
[11]. McMillan, J. H., & Reed, D. F. (1994). At-risk
students and resiliency: Factors contributing to academic success. The Clearing House, 67(3), 137-140.
[12]. Paliwal M, Kumar U.A. A study of academic
performance of business school graduates using neural network and statistical techniques. Expert Systems with Applications. 2008.
doi:10.1016/j.eswa.2008.11.003.
[13]. Shah, C., & Burke, G. (1999). An undergraduate
student flow model: Australian higher education. Higher Education, 37, 359–375,
doi:10.1023/A:1003765222250.
[14]. Simeunovic, V., Preradovic, Lj., Using Data
Mining to Predict Success in Studying, Using Data Mining to Predict Success in Studying, 16 (2), 2014., 491-523.
[15]. Slanger, W. D., Berg, E. A., Fisk, P. S., &
Hanson, M. G. (2015). A Longitudinal Cohort Study of Student Motivational Factors Related to Academic Success and Retention Using the College Student Inventory. Journal of College Student Retention: Research, Theory & Practice.
[16]. Sugahara, S., & Boland, G. (2014). How