Human H3N2 Influenza Viruses Isolated from 1968 To
2012 Show Varying Preference for Receptor
Substructures with No Apparent Consequences for
Disease or Spread
Shelly Gulati1, David F. Smith2, Richard D. Cummings2, Robert B. Couch3, Sara B. Griesemer4, Kirsten St. George4, Robert G. Webster5, Gillian M. Air1*
1Department of Biochemistry & Molecular Biology, University of Oklahoma Health Sciences Center, Oklahoma City, Oklahoma, United States of America,2Department of Biochemistry, Emory University School of Medicine, Atlanta, Georgia, United States of America,3Department of Molecular Virology and Microbiology, Baylor College of Medicine, Houston, Texas, United States of America,4New York State Department of Health, Wadsworth Center, Albany, New York, United States of America,5St Jude Children’s Research Hospital, Memphis, Tennessee, United States of America
Abstract
It is generally accepted that human influenza viruses bind glycans containing sialic acid linkeda2–6 to the next sugar, that avian influenza viruses bind glycans containing thea2–3 linkage, and that mutations that change the binding specificity might change the host tropism. We noted that human H3N2 viruses showed dramatic differences in their binding specificity, and so we embarked on a study of representative human H3N2 influenza viruses, isolated from 1968 to 2012, that had been isolated and minimally passaged only in mammalian cells, never in eggs. The 45 viruses were grown in MDCK cells, purified, fluorescently labeled and screened on the Consortium for Functional Glycomics Glycan Array. Viruses isolated in the same season have similar binding specificity profiles but the profiles show marked year-to-year variation. None of the 610 glycans on the array (166 sialylated glycans) bound to all viruses; the closest was Neu5Aca2–6(Galb1–4GlcNAc)3in
either a linear or biantennary form, that bound 42 of the 45 viruses. The earliest human H3N2 viruses preferentially bound short, branched sialylated glycans while recent viruses bind better to long polylactosamine chains terminating in sialic acid. Viruses isolated in 1996, 2006, 2010 and 2012 bind glycans witha2–3 linked sialic acid; for 2006, 2010 and 2012 viruses this binding was inhibited by oseltamivir, indicating binding ofa2–3 sialylated glycans by neuraminidase. More significantly, oseltamivir inhibited virus entry of 2010 and 2012 viruses into MDCK cells. All of these viruses were representative of epidemic strains that spread around the world, so all could infect and transmit between humans with high efficiency. We conclude that the year-to-year variation in receptor binding specificity is a consequence of amino acid sequence changes driven by antigenic drift, and that viruses with quite different binding specificity and avidity are equally fit to infect and transmit in the human population.
Citation:Gulati S, Smith DF, Cummings RD, Couch RB, Griesemer SB, et al. (2013) Human H3N2 Influenza Viruses Isolated from 1968 To 2012 Show Varying Preference for Receptor Substructures with No Apparent Consequences for Disease or Spread. PLoS ONE 8(6): e66325. doi:10.1371/journal.pone.0066325
Editor:Andrew Pekosz, Johns Hopkins University - Bloomberg School of Public Health, United States of America
ReceivedMarch 22, 2013;AcceptedMay 3, 2013;PublishedJune 21, 2013
Copyright:ß2013 Gulati et al. This is an open-access article distributed under the terms of the Creative Commons Attribution License, which permits unrestricted use, distribution, and reproduction in any medium, provided the original author and source are credited.
Funding:This work was supported by NIH through a bridge grant from the Consortium for Functional Glycomics (GM62116, P.I. James Paulson), GM098791 (RDC), AI18203 (GMA), HHSN272200900007C (RGW) and the American Lebanese Syrian Associated Charities. The funders had no role in study design, data collection and analysis, decision to publish, or preparation of the manuscript.
Competing Interests:The authors declare that they received gifts of oseltamivir from Abbott and Roche. These gifts do not alter the authors’ adherence to all the PLOS ONE policies on sharing data and materials.
* E-mail: [email protected]
Introduction
In a seminal series of experiments in the 1980s, Paulson and colleagues showed that the hemagglutinins (HA) of human influenza viruses show binding preference for a2–6 linked sialic acid while avian viruses bound thea2–3 linked form, and that a single amino acid change was sufficient to switch the specificity from mammals to birds and vice versa [1]. Despite the presence of
a2–3 sialylated glycans in the human respiratory tract, and the efficient transmission and replication of human parainfluenza viruses that bind onlya2–3 sialylated structures [2,3], almost all human influenza viruses binda2–6 sialylated glycans. As we and others screened human H3N2 influenza viruses, or expressed HAs, on the Consortium for Functional Glycomics (CFG) Glycan Array,
we noted considerable diversity in the substructures bound by different isolates [4,5] and significant binding ofa2–3 sialylglycans has been reported in some human strains [5–8]. Viruses from the mid-1990s lost the ability to agglutinate chicken red blood cells, indicating a change in specificity and/or avidity [9]. The red blood cells recommended for hemagglutination-inhibition tests were changed from chicken to turkey, but by the 2000s it was widely recognized that the avidity for turkey red cells was reduced. Some of the sequence and structural changes responsible have been identified [10], but the low avidity of recent viruses has caused considerable problems with inconsistent hemagglutination-inhibi-tion tests when seeking evidence of antigenic drift and determining when a change in the vaccine virus is needed.
Several of the published studies used egg-adapted vaccine strains or HA genes from viruses of unknown (or unreported) passage history, and this led us to a systematic investigation of the binding properties of all major variants of human H3N2 viruses from their appearance in 1968 to 2012. We sought viruses that were isolated in mammalian cells, never grown in eggs, and minimally passaged. We screened the binding of Alexa488-labeled virions on the CFG Glycan Array. We found an overall gradation in binding preference from short, branched a2–6 sialylated (NeuAc) structures to long linear or long branched polylactosa-mine-containing sialylated glycans. Occasionally strains appeared with very different binding patterns, including viruses with affinity for NeuAca2–3, but these only lasted a year or two. However, recent isolates bound to NeuAca2–3 as well as NeuAca2–6 but the NeuAca2–3 binding was almost entirely eliminated in the presence of oseltamivir, indicating the HA was binding NeuAca2–6 but the NA bound NeuAca2–3. Other recent H3N2 viruses with a mutation of D151 in the NA have been shown to bind to NeuAca2–3 [11,12]. Entry of these dual-specificity viruses into MDCK cells was reduced when oseltamivir was present during initial adsorption then removed to allow cell-to-cell spread, indicating that the binding by the NA can contribute to entry.
Results and Discussion
Properties of the H3N2 Viruses Isolated from 1968 to 2012
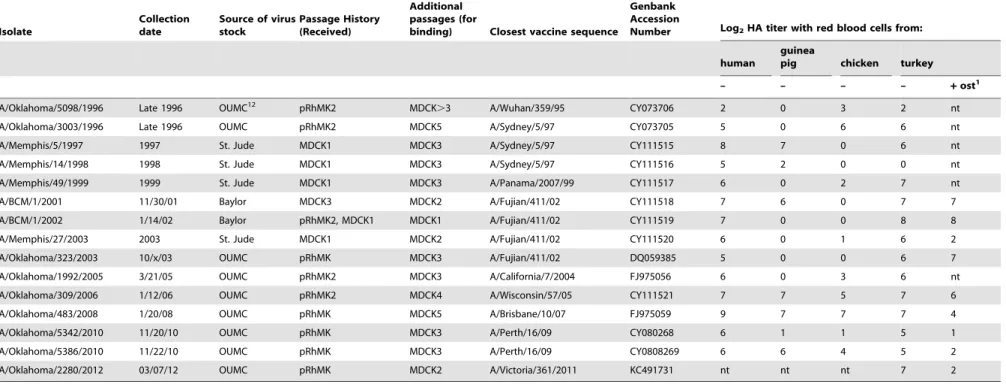
The 45 viruses analyzed in this study are shown in Table 1. We obtained human viruses that were isolated from 1968 to 2012 in mammalian cells and never passaged in eggs. We grew the viruses in MDCK cells (8–10 T175 flasks) and purified them by sucrose density gradient centrifugation. The HA1 coding sequences were determined for all viruses to ensure that we knew what was run on the Glycan Array. New sequences were deposited into Genbank via the NIAID Influenza Research Database (IRD) http://www. fludb.org [13]. Sequences of HA of A/Albany/11/68, A/Albany/ 1/69. A/Albany/1/70, A/Albany/42/75 from early passages in rhesus monkey kidney (RMK) cells were already in the database; the sequences after 2–3 passages in MDCK cells were identical, and we similarly have seen no change in Oklahoma isolates between isolation in RMK cells and after multiple passages in MDCK cells. Earlier studies also showed no change in HA sequence between patient material and MDCK cell passages [14,15]. We always passage viruses at limiting dilution and this might be why we saw only one (R220G in one virus) of the several changes attributed to MDCK cell passage by others [16–18]. The relationship of the HA1 sequences to each other and to the vaccine strains (Table 1) was shown by the IRD phylogeny tool PhyML [19]. The HA1 sequences of all the viruses used are aligned in Figure S1. We determined the HA titers of viruses with human, guinea pig, chicken and turkey red blood cells, and, for recent viruses and some earlier viruses as controls, we determined if oseltamivir reduced the HA titer. This information is included in Table 1.
Binding to the CFG Glycan Array Correlates with Red Blood Cell Avidity
The purified viruses were labeled with Alexa488 and run at three concentrations on the Consortium for Functional Glycomics Glycan array, versions 5.0 (611 glycans) or 5.1 (610 glycans). The only difference between the two array versions is omission of one glycan from v5.1 that was represented twice on v5.0 with different linkers. Here we present the results using v5.1 identification
numbers. The complete list of glycans on the array is given at www.functionalglycomics.org. Individual binding sites on HA have low (mM) affinity for glycans [20] and so the signals from both glycan array binding [21] and red blood cell binding measure avidity of multiple HA molecules to multiple ligands. We diluted the Alexa-labeled viruses well below the saturation level for the array so by running three concentrations we could distinguish high avidity from low avidity binding. We saw very little non-specific binding in these experiments using well-purified virus and a careful titration of Alexa488.
The 610 glycans on the array are only a small fraction of the possible receptors in the human respiratory tract. As a test of relevance of the glycan array results, we compared the signals from the array with HA titers of the 45 viruses. It is well known that influenza viruses vary in their binding to the red blood cells used as surrogate receptors in vaccine efficacy studies, so we first determined the HA titer of the purified virus preparations on human, guinea pig, chicken and turkey red blood cells (Table 1). Different patterns were seen but all viruses agglutinated turkey red blood cells, so we used the turkey red cell HAU per mg viral protein to compare with the fluorescent signal (RFU) of the highest binding glycan (Figure 1). To bring the results to a similar scale the RFU was calculated per 100 ng viral protein. Figure 1 shows two properties of the viruses; the relative avidities of binding among the 45 viruses, and the binding to red blood cells compared to glycans on the array for each individual virus. It is clear that some viruses bind strongly to both red blood cells and glycans while other show weak binding in both assays, despite the relatively high errors due to the two-fold dilutions in the HA titration and uncertainty in the viral protein applied to the array due to incorporated host cell proteins [22] or incomplete purification. Differences in avidity to red blood cells could be due to differences in HA density [5], but previous studies with viruses and purified HAs have shown clear differences in avidity between different HAs [7,17,18]. Figure 1 is plotted on a log scale, and shows there is up to 1000-fold variation in avidity of binding either to array glycans or to red blood cells among these H3N2 viruses. While there is an overall loss in avidity over the years, there is also a cyclical pattern of higher and lower avidities. The HAU measures viral particles while RFU measures amount of HA bound, but for most viruses there is a correlation between glycan array signal and hemagglu-tination (Figure 1B) suggesting that the difference in how glycans are displayed on the array compared to the red cell surface is not affecting the global results.
One obvious concern was whether the Alexa labeling would interfere with binding. Alexa succinimidyl ester reacts with epsilon amino groups of lysine residues and could cause steric blocking or interfere with ionic interactions. In addition, the number of basic amino acids in H3 HA has been noted to increase over time [23,24] and reaction of lysine groups with Alexa488 might decrease binding to sialic acid. We used the EMBOSS program Pepstats [25] to determine the isoelectric point of the 45 HA1 sequences and confirmed the increase in basicity over time (Figure S2) but this has not increased the avidity of binding to sialylated glycans or red blood cells (Figure 1C). Two lines of evidence indicate that the Alexa labeling does not interfere with binding. First, we determined by mass spectrometry that only a subset of lysine residues were labeled in one H3N2 and two H1N1 isolates, and none of the labeled lysines are near the binding site [26]. This result is very similar to previous work, in which high concentra-tions of reagents that modify lysine, tyrosine or histidine residues had no effect on HA titer or antigenicity of a 1971 H3 HA [27]. Second, we compared our glycan array results for Alexa-labeled 2009 H1N1pdm virus with several published glycan binding
Receptor Specificity of H3N2 Influenza 1968-2012
Table 1.Human H3N2 influenza isolates used in this study.
Isolate
Collection date
Source of virus stock
Passage History (Received)
Additional passages (for
binding) Closest vaccine sequence
Genbank Accession
Number Log2HA titer with red blood cells from:
human
guinea
pig chicken turkey
– – – – +ost1
A/Albany/11/1968 1968 Wadsworth3 pRhMK43 MDCK3 A/Aichi/2/1968 CY019891 7 8 7 8 nt2
A/BCM/2/1968 (HK/813558) 2/8/68 Baylor5 HEK62, Vol71, HEK1,
MDCK
MDCK2 A/Aichi/2/1968 CY111495 nt nt nt 7 7
A/Albany/1/1969 1969 Wadsworth pRhMK4 MDCK3 A/Aichi/2/1968 CY019899 7 4 4 6 nt
A/BCM/2/1969 1/7/69 Baylor HEK1, MDCK1 MDCK2 A/Aichi/2/1968 CY111496 6 7 6 5 nt
A/Albany/1/1970 1970 Wadsworth pRhMK3 MDCK3 A/Aichi/2/1968 CY022938 8 7 6 7 nt
A/BCM/1/1970 1/14/70 Baylor HEK2, MDCK1 MDCK2 A/Aichi/2/1968 CY111497 7 0 5 7 nt
A/BCM/1/1972 (Udorn/307/72) 9/xx/72 Baylor BEK84, Vol1, MDCK1 MDCK2 A/Udorn/307/1972 CY111498 0 1 0 2 nt
A/BCM/1/1973 1/15/73 Baylor MDCK1 MDCK2 A/Udorn/307/1972 CY111499 1 5 0 2 nt
A/BCM/1/1974 (A/Georgia/101/ 74)
9/9/74 Baylor HEK2, Vol1, MDCK1 MDCK2 A/Port Chalmers/1/1973 CY111500 10 0 7 7 nt
A/Albany/42/1975 1975 Wadsworth pRhMK2 MDCK4 A/Victoria/3/1975 CY021077 7 7 6 7 nt
A/BCM/3/1975 1/11/75 Baylor MDCK3 MDCK2 A/Victoria/3/1975 CY111501 6 7 5 7 nt
A/BCM/1/1976 1/xx/76 Baylor MDCK3 MDCK2 A/Victoria/3/1975 CY111502 5 5 1 4 nt
A/BCM/11/1976 1/28/76 Baylor MDCK1 MDCK2 A/Texas/1/1977 CY111510 9 10 8 9 nt
A/BCM/3/1977 12/30/77 Baylor MDCK3 MDCK2 A/Texas/1/1977 CY111503 8 8 7 7 nt
A/BCM/1/1978 1/3/78 Baylor MDCK3 MDCK2 A/Bangkok/1/1979 CY111504 7 7 7 6 nt
A/BCM/1/1980 2/26/80 Baylor MDCK2 MDCK2 A/Bangkok/1/1979 CY111505 8 10 8 8 nt
A/BCM/1/1981 1/5/81 Baylor MDCK2 MDCK2 A/Bangkok/1/1979 CY111506 6 5 2 6 nt
A/BCM/1/1982 11/22/82 Baylor MDCK2 MDCK2 A/Bangkok/1/1979 CY111507 8 7 9 9 nt
A/Memphis/33/83 1983 St. Jude9 MDCK1 MDCK2 A/Philippines/2/82 CY009052 7 6 7 7 nt
A/Memphis/2/1985 1985 St. Jude MDCK1 MDCK2 A/Mississippi/1/85 CY009068 7 8 7 6 nt
A/Memphis/2/1986 1986 St. Jude MDCK2 MDCK3 A/Leningrad/360/86 CY011144 8 6 3 5 nt
A/Memphis/3/1988 1988 St. Jude MDCK2 MDCK2 A/Shanghai/11/87 CY111508 8 9 7 7 nt
A/Memphis/7/1990 1990 St. Jude MDCK2 MDCK2 A/Shanghai/16/89 CY008740 3 6 5 5 nt
A/BCM/1/1991 11/25/91 Baylor LLC101, MDCK1 MDCK2 A/Beijing/353/89 CY111509 5 6 2 4 nt
A/BCM/2/1992 1/2/1992 Baylor X11MDCK1 MDCK2 A/Beijing/353/89 KC539109 nt nt nt 7 7
A/BCM/1/1993 12/20/93 Baylor MDCK1 MDCK2 A/Jo’burg/33/94 CY111511 6 0 5 7 nt
A/Memphis/7/1994 1994 St. Jude MDCK1 MDCK2 A/Jo’burg/33/94 CY111512 2 1 0 0 nt
A/New York/696/1994 12/30/94 Wadsworth pRhMK2 MDCK2 A/Jo’burg/33/94 CY011336 nt nt nt 5 nt
A/Memphis/9/1995 1995 St. Jude MDCK1 MDCK2 A/Jo’burg/33/94 CY111513 5 0 3 4 nt
A/Memphis/9/1996 1996 St. Jude MDCK1 MDCK2 A/Wuhan/359/95 CY111514 6 0 2 3 nt
Recept
or
Specificity
of
H3N2
Influenza
1968-2012
PLOS
ONE
|
www.ploson
e.org
3
June
2013
|
Volume
8
|
Issue
6
|
Table 1.Cont.
Isolate
Collection date
Source of virus stock
Passage History (Received)
Additional passages (for
binding) Closest vaccine sequence
Genbank Accession
Number Log2HA titer with red blood cells from:
human
guinea
pig chicken turkey
– – – – +ost1
A/Oklahoma/5098/1996 Late 1996 OUMC12 pRhMK2 MDCK
.3 A/Wuhan/359/95 CY073706 2 0 3 2 nt
A/Oklahoma/3003/1996 Late 1996 OUMC pRhMK2 MDCK5 A/Sydney/5/97 CY073705 5 0 6 6 nt
A/Memphis/5/1997 1997 St. Jude MDCK1 MDCK3 A/Sydney/5/97 CY111515 8 7 0 6 nt
A/Memphis/14/1998 1998 St. Jude MDCK1 MDCK3 A/Sydney/5/97 CY111516 5 2 0 0 nt
A/Memphis/49/1999 1999 St. Jude MDCK1 MDCK3 A/Panama/2007/99 CY111517 6 0 2 7 nt
A/BCM/1/2001 11/30/01 Baylor MDCK3 MDCK2 A/Fujian/411/02 CY111518 7 6 0 7 7
A/BCM/1/2002 1/14/02 Baylor pRhMK2, MDCK1 MDCK1 A/Fujian/411/02 CY111519 7 0 0 8 8
A/Memphis/27/2003 2003 St. Jude MDCK1 MDCK2 A/Fujian/411/02 CY111520 6 0 1 6 2
A/Oklahoma/323/2003 10/x/03 OUMC pRhMK MDCK3 A/Fujian/411/02 DQ059385 5 0 0 6 7
A/Oklahoma/1992/2005 3/21/05 OUMC pRhMK2 MDCK3 A/California/7/2004 FJ975056 6 0 3 6 nt
A/Oklahoma/309/2006 1/12/06 OUMC pRhMK2 MDCK4 A/Wisconsin/57/05 CY111521 7 7 5 7 6
A/Oklahoma/483/2008 1/20/08 OUMC pRhMK MDCK5 A/Brisbane/10/07 FJ975059 9 7 7 7 4
A/Oklahoma/5342/2010 11/20/10 OUMC pRhMK MDCK3 A/Perth/16/09 CY080268 6 1 1 5 1
A/Oklahoma/5386/2010 11/22/10 OUMC pRhMK MDCK3 A/Perth/16/09 CY0808269 6 6 4 5 2
A/Oklahoma/2280/2012 03/07/12 OUMC pRhMK MDCK2 A/Victoria/361/2011 KC491731 nt nt nt 7 2
1Ost = oseltamivir carboxylate. 2nt: not tested.
3Wadsworth Center- Griffin Laboratories, New York State Department of Health, Albany, New York. 4Primary Rhesus monkey kidney cells.
5Baylor College of Medicine, Houston, Texas. 6Human embryonic kidney cells.
7Human volunteer passage. 8Bovine embryonic kidney cells.
9St. Jude Children’s Research Hospital, Memphis, Tennessee. 10LLC-MK2 continuous cell line.
11Previous tissue culture passages unknown. 12
Oklahoma University Medical Center, Virology Laboratory, Children’s Hospital. doi:10.1371/journal.pone.0066325.t001
Recept
or
Specificity
of
H3N2
Influenza
1968-2012
PLOS
ONE
|
www.ploson
e.org
4
June
2013
|
Volume
8
|
Issue
6
|
experiments of the unlabeled low passage virus, or its expressed HA, and found no significant differences [26]. The CFG database (http://www.functionalglycomics.org) contains several glycan array results for unlabeled H3N2 viruses or expressed H3 HAs, but they all appear to be the egg-adapted, high growth vaccine version rather than cell-passaged isolates, so differences would be expected.
Binding Specificities from 1968 to 2012
The binding profiles on the array were analyzed by the GlycoPattern GBP Cross Analysis program (https://glycopattern. emory.edu), which ranks binding of each glycan from high to low for the three virus concentrations, averages the rank and computes the percentile rank. To compare binding of individual glycans we summed the percentile rank of each glycan for all 45 viruses and sorted the glycans from highest to lowest summed score. The top six scoring glycans are shown in Figure 2. Binding is color coded from red (100thpercentile) to violet (10thpercentile) with binding percentile less than 10 considered insignificant. The complete results are shown in Table S1 except we deleted as insignificant the
glycans that fell below an aggregate score of 15 (the top score is 3255).
First, there is no glycan out of the 610 that bound to all H3N2 viruses. There are 171 sialylated glycans on the array including 54 containing NeuAca2–6 and 83 containing NeuAca2–3. The top scoring four glycans (Figure 2) bound 40–42 of the 45 viruses to some extent, although these are not the preferred ligands for the early isolates. There are 30 glycans that bind detectably to 50% or more of the 45 viruses but the overall binding score of the 30th glycan has dropped to 25% of the top binding glycan score. There are several NeuAca2–6 glycans that bind very poorly and three did not bind enough to any virus to be included in Table S1 (#135 NeuAca2–6(Galb1–3)GalNAca-Sp8, #480 NeuAca2–6Galb1– 4GlcNAcb1–6GalNAca-Sp14, and #520 NeuAca2–6Galb1– 4GlcNAcb1–2Man-Sp0). Viruses isolated in 1972, 1973 and 1986 bound to several non-sialylated glycans (Table S1), but the overall binding was very low (Figure 1A) and the significance of these is uncertain.
Figure 1. Relationship between agglutination of turkey red blood cells and the highest binding signal on the Glycan Array.A. Hemagglutinating units (HAU, red) or fluorescent signal (RFU, blue) are shown permg or per 100 ng viral protein, respectively, to approximately equalize the magnitude. B. HAU plotted against RFU with the trendline shown in black. Note that both axes are on a log scale. C. Plot of isoelectric point (pI) against binding avidity (the average of HAU and RFU).
doi:10.1371/journal.pone.0066325.g001
Receptor Specificity of H3N2 Influenza 1968-2012
The binding patterns in Table S1 can be divided into six phases of different specificity of binding. We discuss these from earliest to latest isolates.
The first phase, 1968–1970:The HA1 sequences show two sites of variable glycosylation, at Asn63 and Asn81, but are identical after amino acid 81 of HA1. The binding patterns are not significantly different. The highest binding glycans are short,
branched NeuAca2–6 structures, with lower binding to longer branched or long linear chains.
The second phase 1972–74: The 1972 and 1973 viruses show very little binding except to glycan #138 which is the branched pentasaccharide milk sugar LSTb, a structure that is not known to be present on cell surfaces although it has been detected as a glycosphingolipid in human meconium [28]. There are 9
Figure 3. A/OK/3003/96 binds NeuAca2–3 glycans and is able to infect CHO cells that lack NeuAca2–6 sialylation.Virus was added to
cell monolayers, then infection medium added and the infected cells incubated at 37uC for 18 hours. The cells were fixed and permeabilized for immunodetection of NP (green) accumulated in nuclei (blue DAPI) of infected cells. A control H1N1 virus that binds only NeuAca2–6 glycans infected MDCK cells but not CHO cells.
doi:10.1371/journal.pone.0066325.g003
Figure 2. Binding profile of the top six glycans (ranked by the sum of the percentile signals, top to bottom) to viruses from 1968 to 2012 (left to right).The percentile binding of each glycan to each virus is shown, color-coded from 100 (red) to 10 (violet). White cells indicate binding less than 10% of the maximum. The colors show a shift from short branched sialylated structures in early viruses to long linear or long branched glycans in later isolates.
doi:10.1371/journal.pone.0066325.g002
Receptor Specificity of H3N2 Influenza 1968-2012
amino acid changes in HA1 compared to the 1968–70 viruses. BCM/1/1972 was isolated from a human volunteer infected with A/Udorn/307/72 and the HA1 sequence is identical to Udorn/ 307/72. The avidity of BCM/1/1972 is very low and we thought
the result might be due to the unusual passage of Udorn/307/ 72 in bovine cells (Table 1), but BCM/1/1973 was an original isolate passaged only in MDCK cells that had only one amino acid difference in HA1 from Udorn/72, and the same low avidity and Figure 4. Binding of four viruses to the glycan array in the absence or presence of oseltamivir.BCM/2/92 (A) and OK/483/2008 (C) bind only NeuAca2–6 glycans and there is no change in the presence of oseltamivir. OK/309/2006 (B) and OK/5342/2010 (D) show binding to many NeuAca2–3 glycans but this binding is lost in the presence of oseltamivir, indicating it is NA, not HA, that binds to NeuAca2–3.
doi:10.1371/journal.pone.0066325.g004
Table 2.Effect of oseltamivir on virus entry.
A/BCM/3/68 A/OK/309/06 A/OK/5342/10 A/OK/2280/12
Virus titer (TCIU/ml) 26106 26106 26104 26105
Effective titer in the presence of 10mM oseltamivir (TCIU/ml) 26106 26105 ,10 ,10
Conc. oseltamivir that inhibited virus entry (mM) .10 1.0 0.01 0.01
Viruses were adsorbed to cells in the presence or absence of oseltamivir for 1 hr, then the inoculum aspirated off, infection medium without drug was added and the plates incubated for 3 days to allow virus growth. Both virus and oseltamivir were titrated at 10-fold dilutions so the errors are61 log.
doi:10.1371/journal.pone.0066325.t002
Receptor Specificity of H3N2 Influenza 1968-2012
binding pattern. The 1974 isolate, from a human volunteer passage, shows somewhat higher and more diverse binding, and has an unusual preference for two glycans that contain NeuAca2– 6GlcNAcb1–4GlcNAc (#366 and#367). There are 7 amino acid differences in HA1 compared to the 1972/1973 strains.
The third phase, 1975–1986:Most of these viruses show the same preference as the earlier isolates for short sialylated branches but they now have acquired binding to longer branches and linear structures containing N-acetyllactosamine (LacNAc) repeats. They bind most of the NeuAca2–6 glycans on the array, although with varying avidities. BCM/1/81 stands out as showing less binding to tri- and tetra-antennary glycans and its avidity to array glycans or red blood cells is lower than BCM/1/1980 (Figure 1). There are no sequence differences in HA1 between the 1981 and the 1980 isolates, so the binding differences may be due to a different distribution of HA on the virus that perhaps led to steric inhibition of binding to the highly branched glycans by the 1981 isolate. We previously noted differences in ability to bind chicken red cells depending on how the HA was displayed [5]. The overall avidity for both red cells and array glycans decreased again in 1983–1986 viruses.
The fourth phase, 1988 to 1996: These viruses acquired increased preference for long linear NeuAca2–6(LacNAc)n
struc-tures with decreasing binding to highly branched or short glycans and essentially no binding to these by 1996. Two 1996 isolates from Oklahoma do not bind either long or short brancheda2–6 sialylated glycans; they bind the NeuAca2–3 glycan sulfo-sialyl-Lewisx(NeuAca2–3Galb1–4(Fuca1–3)(6S)GlcNAcb-) and its un-fucosylated relative, but showed only very weak binding to other glycans. We tested the relevance of this unusual binding pattern to infection of cells. A/Oklahoma/3003/1996 was able to infect Chinese hamster ovary (CHO) cells as measured by amplification of viral nucleoprotein and its accumulation in the nucleus of infected cells (Figure 3). Since CHO cells do not express measurablea2,6-sialyltransferase (EC 2.4.99.1) [29], this suggests that OK/3003/1996 can infect cells using NeuAca2–3 receptors. The fifth phase, 1997 to 2008:These viruses bind strongly to long linear NeuAca2–6(LacNAc)3and have lost binding to short
branched structures. Most of these viruses do not bind to chicken red blood cells as was reported at the time [30,31], necessitating changes in the standard HA and HAI protocols, that now specify ‘‘either chicken, human, turkey or guinea pig’’ red blood cells can be used, reflecting the variability of red blood cell binding seen in Table 1. The glycan array binding pattern is in accord with a recent analysis of the N linked glycans on chicken red blood cells that showed only short branched structures and an absence of LacNAc repeats [32].
The sixth phase, 2010 to 2012: We did not obtain any H3N2 isolates in 2009, but Lin et al. showed that failure of hemagglutination-inhibition (HAI) tests for 2009 H3N2 strains was due to a mutation in the NA of D151G that caused the NA to bind to substrate without cleaving it. This allowed the viruses to bind to red blood cells in an oseltamivir-inhibitable manner while anti-HA antibodies had little effect [11]. Zhu et al. followed up with glycan array and crystal structure analysis of expressed NA from A/ Tanzania/205/2010 (H3N2) with either Asp or Gly at position 151. They conclusively showed that the NA with G151 binds to NeuAca2–3 sialylated glycans but does not cleave them [12]. The isolates we obtained in 2010 and 2012 all bind a variety of NeuAca2–3 containing structures, and in most cases show higher binding to these ‘‘avian’’ type receptors than to any NeuAca2–6 ligands (Table S1). We therefore screened these and other selected viruses from our collection on the CFG Glycan Array in the presence or absence of the neuraminidase inhibitor oseltamivir
carboxylate (Figure 4). Oseltamivir had no effect on binding of viruses that only binda2–6 sialylated glycans (A/BCM/2/92 and A/Oklahoma/483/2008; also A/Memphis/27/2003 and Okla-homa/323/2003, not shown), but oseltamivir inhibited all binding to a2–3 sialylated glycans by A/Oklahoma/309/2006 and A/ Oklahoma/5342/2010 (Figure 4) and also A/Oklahoma/2280/ 2012 (not shown), showing that thea2–3 binding is by NA and not HA. The NA of A/Oklahoma/309/2006 has a mutation of Asp to Glu at 151. We previously showed that in influenza B NA, mutation D151E (N2 numbering) reduced kcatby 10-fold but at
the same time reduced Km by 6-fold, showing tighter binding to substrate and little cleavage activity even with this conservative change [33]. The NA sequences of both A/Oklahoma/5342/2010 and A/Oklahoma/2280/2012 showed a mixed population of approximately 50% Asp and 50% Asn at 151.
Does Binding by Non-cleaving NA Assist in Virus Entry into Cells?
To determine if thea2–3 sialic acid binding by the 151 variant NA can be used by the virus to infect cells, we mixed virus with oseltamivir and added it to MDCK cells for 1 hr at room temperature for the virus to adsorb, then aspirated off the virus and inhibitor and added infection medium without oseltamivir. The results are shown in Table 2. Oseltamivir inhibited entry of OK/2280/2012 and OK/5342/2010, while there was low inhibition of OK/309/2006 and no effect on BCM/3/68, a virus that binds only NeuAca2–6 glycans. These results suggest that the NA binding toa2–3 glycans is the major route of entry for the 2012 and 2010 viruses. There is less effect on entry of OK/309/ 2006, which was one of the viruses that deleted most of the NA coding sequences on passage in MDCK cells resulting in resistance of multi-cycle growth to oseltamivir [4]. The partial inhibition of entry of OK/309/2006 by oseltamivir shown in Table 2 likely indicates that entry is mediated by a combination of HA and NA binding.
Why so much Variation in Binding?
It is widely accepted that the genetic evolution of human influenza HA is driven by selection of mutants that escape antibody neutralization while retaining ability to infect and transmit among humans. It has also been known for 30 years that the main binding sites of neutralizing antibodies surround the receptor binding site, so it is not surprising that some of the antibody escape mutations change binding properties (‘‘adsorptive mutants’’ as described by Fazekas de St Groth [34]). It has been suggested that an alternative model might be that receptor binding drives antigenic drift [35], but we are not aware of data that would support this model in the natural evolution of human influenza viruses. The authors suggested that the receptor-driving model might help answer the question of how viruses can escape from polyclonal antisera, but we and others have shown there is immunodominance of particular antigenic sites recognized by human antibodies and the immunodominant site can change as the virus evolves [36–39]. There are a vast array of sialylated glycan structures on the surface of the human respiratory tract [40] and so changes in binding specificity or even avidity might not be expected to impact viral infectivity. That seems to be the case with the H3N2 viruses, since despite large differences in specificity and avidity of binding glycans and red blood cells over time, they all rapidly spread around the world.
We tried to correlate specific sequence changes with differences in binding, but did not identify simple relationships. Except for BCM/1980 and BCM/1981, all of the viruses showed multiple
Receptor Specificity of H3N2 Influenza 1968-2012
sequence differences and sophisticated docking programs might be needed to explain the differences in binding specificities.
Summary and Conclusions
None of the 610 glycans on the array (166 sialylated glycans) bound to all viruses; the closest was NeuAca2–6(Galb 1–4GlcNA-c)3in either a linear or biantennary form, that bound 42 of the 45
viruses. The earliest viruses show a preference for short, branched sialylated glycans while recent viruses bind better to long polylactosamine chains terminating in sialic acid. Viruses isolated in 1996, 2006, 2010 and 2012 bind glycans witha2–3 linked sialic acid; for 2006, 2010 and 2012 viruses the binding to the NeuAca2–3 array glycans was inhibited by oseltamivir while binding of the a2–6 glycans was not affected by oseltamivir, indicating it is only the NA that is bindinga2–3 linked sialic acid while the HA binds NeuAca2–6 glycans. More significantly, oseltamivir inhibited entry of 2010 and 2012 viruses into MDCK cells, indicating that the virus can use NeuAca2–3 glycans as entry receptors.
All of the viruses we studied were representative of epidemic strains that spread around the world, so all could infect, cause disease and transmit between humans with high efficiency. We conclude that the year-to-year variation in receptor binding specificity is a consequence of amino acid sequence changes that have been driven by antigenic drift, and that viruses with quite different binding specificities and avidities are equally fit to infect and transmit in the human population.
Materials and Methods
Viruses and Purification
The sources and passage histories of the H3N2 viruses used in this study are included in Table 1. The viruses were grown in Madin-Darby canine kidney (MDCK) cells in DMEM:Ham’s F12 medium (1:1) with ITS+(BD Biosciences) and 0.5mg/ml trypsin (TPCK treated, Worthington). All the virus stocks were first grown at 10-fold dilutions in six-well plates of MDCK cells, then an aliquot from the limiting dilution well was used to inoculate 6–10 175cc flasks. After incubation at 37uC for 3 days, the supernatants were clarified by low speed centrifugation. The viruses were pelleted from the supernatant then purified by centrifugation through a 10% to 40% sucrose gradient, pelleted, and resus-pended in borate buffered CaMg saline (0.15 M NaCl, 0.2 5 mM CaCl2, 0.8 mM MgCl2, 20 mM boric acid, 0.13 mM Na borate,
pH 7.2). Viruses were quantified by hemagglutination assay and total viral protein (Bio Rad protein assay).
Hemagglutination Assay
The purified viruses were two-fold serially diluted in 50ml of PBS and 50ml of washed turkey (0.6%), chicken (0.6%), guinea pig (0.6%) or human (0.6%) red blood cells added. The plates were kept at 4uC and hemagglutination was read at 60 min. In some cases, oseltamivir carboxylate (0.02mM) was added to the virus dilutions to inhibit agglutination caused by binding in the active site of the NA.
Isolation of Viral RNA, Reverse Transcription, and PCR Amplification (RT-PCR)
The HA1 coding regions of all the viruses used in this study were sequenced immediately before the large-scale growth passage. For RNA extraction, the virus-containing medium was cleared of cell debris (3,000 g for 5 min) then virus was concentrated by sedimentation (SW28 rotor, 25,000 rpm for 2 hr at 4u). The virus pellet was resuspended in borate buffered
CaMg saline. Viral RNA was isolated from the pelleted virus using the QiAmp Viral RNA extraction mini kit (QIAGEN, Cat. #
52904). cDNA was synthesized using the Omniscript RT kit (QIAGEN, Cat. # 205111) and an oligodeoxynucleotide (5’-AGCAAAAGCAGG) that is complementary to the 12 conserved nucleotides at the 3’ end of influenza type A viral RNA segments. To amplify the HA1 gene of all H3N2 isolates a pair of H3 HA specific primers were used: 59- AGCAAAAGCAGGGGAT and 59-CGTACCAACCGTCTACCATTC. The PCR products were separated by electrophoresis on a 1% agarose gel and extracted using the QiA Quick Gel Extraction kit (QIAGEN, Cat.#28704). The purified RT-PCR products were sequenced at the Oklahoma Medical Research Foundation sequencing Facility using an ABI 3730 Capillary Sequencer with H3HA specific primers.
Alexa Labeling of Viruses
The viruses were purified to an HA titer of about 1.06105HAU/ml. To 100ml (,1.06104HA units) of virus was added 10ml of 1.0 M sodium bicarbonate pH 9.0. Alexa Fluor-488 succinimidyl ester (Molecular Probes Cat. # A20000) was added in a ratio of 0.005mg Alexa per HAU, determined by HA
titration to give sufficient labeling without loss of binding activity [26]. After stirring for 1 hr at room temperature in the dark, the sample was dialyzed (Slide-A-Lyzer Mini Dialysis Units 7000 MWCO, Pierce) in borate buffered CaMg saline at 4uC overnight. An aliquot of the dialyzed virus was run on a 10% SDS-PAGE gel to confirm fluorescence of HA1 with no visible labeling of internal viral components or non-viral proteins. The HA activity of labeled virus was checked again to make sure binding was not reduced by the conjugation of Alexa.
Glycan Array Analysis and Data Processing
The 45 viruses used in this study were run at 3 different concentrations on v5.0 or v5.1 of the CFG Glycan Array using the buffers and conditions described previously [41]. The binding was done at 4uC where neuraminidase (NA) activity is undetectable but selected viruses were also screened in the presence of the neuraminidase inhibitor oseltamivir (50 nM). For each virus an initial dilution was made according to the HA titer that was predicted to give a low binding signal, applied to the glycan array slide, washed and read, then higher concentrations were applied to the same slide until there were data in the linear range for three concentrations of virus. For data analysis we used the method described by Heimburg-Molinaro et al [41] to take into account the differing avidities. At each concentration the glycans are ranked from highest to lowest, then for each glycan an average rank is computed from the three concentrations and that rank converted to a percentile. The program to do this (‘‘GBP Cross Analysis’’) is available as part of the GlycoPattern suite (http:// glycopattern.emory.edu) at Emory University that also includes the motif miner GLYMMR [42]. Based on the percentile of all 45 viruses at three concentrations, we calculated the score per glycan and ranked the glycans from highest to lowest binding scores.
Infectivity Assays
Virus entry into CHO cells: CHO cells were grown on cover slips in 35 mm plates. The cells were washed three times with CaMgPBS and infected with 300ml freshly grown virus from MDCK cells. The cells were incubated at 4ufor 2 hr to allow the virus to bind to the cell surface and then transferred to 37uC for 4 hr or 18 hr to detect virus internalization and production of new viral nucleoprotein (NP). To detect NP the cells were washed twice with cold PBS and fixed with 1 ml freshly prepared 3% paraformaldehyde in PBS on ice for 5 min. After washing three
Receptor Specificity of H3N2 Influenza 1968-2012
times with cold PBS, cells were permeabilized with 2% triton X-100 in PBS for 10 min at room temperature, washed 3 times with cold PBS, once with 50 mM ammonium chloride in PBS to destroy any remaining paraformaldehyde, and blocked with 10% supplemented calf serum in PBS for 15 min at room temperature. 50ml of rabbit anti-core (mostly anti-NP) antiserum diluted 1:5000 in 0.1% BSA/PBS was added for 30 min at RT. After washing with 0.1% BSA in PBS, cells were incubated with 50ml Alexa Fluor-488 labeled goat anti-rabbit antiserum (1:200 dilution) for 30 min at room temperature. After washing five times with 0.1% BSA/PBS and once with water, the cover slip was drained well and mounted with a small drop of Prolong Antifade reagent with DAPI (Invitrogen-P36931). The slides were analyzed with a Nikon TE-2000E microscope.
Effect of oseltamivir on virus entry into MDCK cells: Ten fold dilutions of MDCK-grown virus starting with 10ml were used to infect MDCK cells in 24 well plates in the absence or presence of 10mM oseltamivir. The virus +/2 inhibitor was adsorbed to cells for 1 hr at room temperature, then unattached virus was aspirated off and 1 ml DMEM-Ham’s F12/ITS+ infection medium containing 0.5mg/ml TPCK treated trypsin added to each well. After 3 days incubation at 37uC the cytopathic effect (cpe) was estimated by eye and tissue culture infectious titer determined from the last well that had hemagglutinating activity. The same protocol was used with a fixed inoculum of virus (10ml) and 10-fold dilutions of oseltamivir starting with 10mM. Supporting Information
Figure S1 Sequence alignment of HA1 of the viruses used in this study. The alignment was generated by the Influenza Sequence Database [43]. A dot indicates the amino acid is the same as on the top line. Sequons for N-linked glycosylation are highlighted in yellow.
( D )
Figure S2 The isoelectric point (pI) of the HA1 protein of each virus was calculated using EMBOSS Pepstats [25]and is plotted (green triangles) along with the HAU per mg viral protein (red squares) and glycan array
signal (RFU; blue diamonds) per 100 ng viral protein. (PDF)
Table S1 Glycan array binding data were processed as described in Materials and Methods.For each glycan, the percentile scores for all viruses were summed, converted to percentile rank, and the 610 glycans sorted from top to bottom score. Aggregate scores less than 15 are considered insignificant and those glycans have been omitted.
(XLSX)
Acknowledgments
The Glycan Arrays were provided by the Consortium for Functional Glycomics and screening was done by Core H at Emory University. The raw glycan array data are posted on the CFG web site (www. functionalglycomics.org). Data were analyzed using the GlycoPattern suite (http://glycopattern.emory.edu) at Emory University through the Re-search and Health Sciences IT Division, the Center for Comprehensive Informatics, and the Department of Biochemistry. HA1 sequences were determined at the Oklahoma Medical Research Foundation Sequencing Facility. Oseltamivir carboxylate was a kind gift from Warren Kati (Abbott Laboratories) and Roche. We thank Scott Krauss and David Walker who isolated the influenza viruses from St. Jude Children’s Research Hospital and Yi Lasanajak for running the glycan array screens. We thank the reviewer who drew our attention to the increase in positive charge of H3 HA over the years.
Author Contributions
Conceived and designed the experiments: SG DFS RDC RBC SBG KSG RGW GMA. Performed the experiments: SG DFS RBC SBG RGW GMA. Analyzed the data: SG DFS RDC GMA. Contributed reagents/ materials/analysis tools: RBC SBG KSG RGW. Wrote the paper: SG DFS RBC RGW GMA.
References
1. Rogers GN, Paulson JC, Daniels RS, Skehel JJ, Wilson IA, et al. (1983) Single amino acid substitutions in influenza haemagglutinin change receptor binding specificity. Nature 304: 76–78.
2. Amonsen M, Smith DF, Cummings RD, Air GM (2007) Human parainfluenza viruses hPIV1 and hPIV3 bind oligosaccharides with alpha2–3-linked sialic acids that are distinct from those bound by H5 avian influenza virus hemagglutinin. J Virol 81: 8341–8345.
3. Tappert MM, Smith DF, Air GM (2011) Fixation of oligosaccharides to a surface may increase the susceptibility to human parainfluenza virus 1, 2, or 3 hemagglutinin-neuraminidase. J Virol 85: 12146–12159.
4. Gulati S, Smith DF, Air GM (2009) Deletions of neuraminidase and resistance to oseltamivir may be a consequence of restricted receptor specificity in recent H3N2 influenza viruses. Virol J 6: 22.
5. Kumari K, Gulati S, Smith DF, Gulati U, Cummings RD, et al. (2007) Receptor binding specificity of recent human H3N2 influenza viruses. Virol J 4: 42. 6. Meisen I, Dzudzek T, Ehrhardt C, Ludwig S, Mormann M, et al. (2012) The
human H3N2 influenza viruses A/Victoria/3/75 and A/Hiroshima/52/2005 preferentially bind to alpha2–3-sialylated monosialogangliosides with fucosylated poly-N-acetyllactosaminyl chains. Glycobiology 22: 1055–1076.
7. Nycholat CM, McBride R, Ekiert DC, Xu R, Rangarajan J, et al. (2012) Recognition of sialylated poly-N-acetyllactosamine chains on N- and O-linked glycans by human and avian influenza A virus hemagglutinins. Angew Chem Int Ed Engl 51: 4860–4863.
8. Stevens J, Chen LM, Carney PJ, Garten R, Foust A, et al. (2010) Receptor specificity of influenza A H3N2 viruses isolated in mammalian cells and embryonated chicken eggs. J Virol 84: 8287–8299.
9. Ito T, Suzuki Y, Mitnaul L, Vines A, Kida H, et al. (1997) Receptor specificity of influenza A viruses correlates with the agglutination of erythrocytes from different animal species. Virology 227: 493–499.
10. Lin YP, Xiong X, Wharton SA, Martin SR, Coombs PJ, et al. (2012) Evolution of the receptor binding properties of the influenza A(H3N2) hemagglutinin. Proc Natl Acad Sci U S A 109: 21474–21479.
11. Lin YP, Gregory V, Collins P, Kloess J, Wharton S, et al. (2010) Neuraminidase receptor binding variants of human influenza A(H3N2) viruses resulting from
substitution of aspartic acid 151 in the catalytic site: a role in virus attachment? J Virol 84: 6769–6781.
12. Zhu X, McBride R, Nycholat CM, Yu W, Paulson JC, et al. (2012) Influenza virus neuraminidases with reduced enzymatic activity that avidly bind sialic acid receptors. J Virol 86: 13371–13383.
13. Squires RB, Noronha J, Hunt V, Garcia-Sastre A, Macken C, et al. (2012) Influenza research database: an integrated bioinformatics resource for influenza research and surveillance. Influenza Other Respi Viruses 6: 404–416. 14. Rocha EP, Xu X, Hall HE, Allen JR, Regnery HL, et al. (1993) Comparison of
10 influenza A (H1N1 and H3N2) haemagglutinin sequences obtained directly from clinical specimens to those of MDCK cell- and egg-grown viruses. J Gen Virol 74: 2513–2518.
15. Katz JM, Wang M, Webster RG (1990) Direct sequencing of the HA gene of influenza (H3N2) virus in original clinical samples reveals sequence identity with mammalian cell-grown virus. J Virol 64: 1808–1811.
16. Li D, Saito R, Suzuki Y, Sato I, Zaraket H, et al. (2009) In vivo and in vitro alterations in influenza A/H3N2 virus M2 and hemagglutinin genes: effect of passage in MDCK-SIAT1 cells and conventional MDCK cells. J Clin Microbiol 47: 466–468.
17. Oh DY, Barr IG, Mosse JA, Laurie KL (2008) MDCK-SIAT1 cells show improved isolation rates for recent human influenza viruses compared to conventional MDCK cells. J Clin Microbiol 46: 2189–2194.
18. Asaoka N, Tanaka Y, Sakai T, Fujii Y, Ohuchi R, et al. (2006) Low growth ability of recent influenza clinical isolates in MDCK cells is due to their low receptor binding affinities. Microbes Infect 8: 511–519.
19. Guindon S, Gascuel O (2003) A simple, fast, and accurate algorithm to estimate large phylogenies by maximum likelihood. Syst Biol 52: 696–704.
20. Sauter NK, Hanson JE, Glick GD, Brown JH, Crowther RL, et al. (1992) Binding of influenza virus hemagglutinin to analogs of its cell-surface receptor, sialic acid: analysis by proton nuclear magnetic resonance spectroscopy and X-ray crystallography. Biochemistry 31: 9609–9621.
21. Stevens J, Blixt O, Glaser L, Taubenberger JK, Palese P, et al. (2006) Glycan microarray analysis of the hemagglutinins from modern and pandemic influenza viruses reveals different receptor specificities. J Mol Biol 355: 1143–1155.
Receptor Specificity of H3N2 Influenza 1968-2012
PLOS ONE | www.plosone.org 10 June 2013 | Volume 8 | Issue 6 | e66325
22. Shaw ML, Stone KL, Colangelo CM, Gulcicek EE, Palese P (2008) Cellular proteins in influenza virus particles. PLoS Pathog 4: e1000085.
23. Arinaminpathy N, Grenfell B (2010) Dynamics of glycoprotein charge in the evolutionary history of human influenza. PLoS One 5: e15674.
24. Kobayashi Y, Suzuki Y (2012) Compensatory evolution of net-charge in influenza A virus hemagglutinin. PLoS One 7: e40422.
25. Rice P, Longden I, Bleasby A (2000) EMBOSS: The European Molecular Biology Open Software Suite (2000) Trends in Genetics 16: 276–277. 26. Gulati S, Lasanajak Y, Smith DF, Cummings RD, Air GM. Glycan array
analysis of influenza H1N1 binding and release. Disease Markers in press. 27. Laver WG, Air GM, Webster RG (1981) Antigenicity of influenza virus
hemagglutinin following chemical modification. Virology 111: 538–548. 28. Prieto PA, Smith DF (1985) A new ganglioside in human meconium detected by
antiserum against the human milk sialyloligosaccharide, LS-tetrasaccharide b. Arch Biochem Biophys 241: 281–289.
29. Lee EU, Roth J, Paulson JC (1989) Alteration of terminal glycosylation sequences on N-linked oligosaccharides of Chinese hamster ovary cells by expression of beta-galactoside alpha 2,6-sialyltransferase. J Biol Chem 264: 13848–13855.
30. Medeiros R, Escriou N, Naffakh N, Manuguerra JC, van der Werf S (2001) Hemagglutinin residues of recent human A(H3N2) influenza viruses that contribute to the inability to agglutinate chicken erythrocytes. Virology 289: 74– 85.
31. Nobusawa E, Ishihara H, Morishita T, Sato K, Nakajima K (2000) Change in receptor-binding specificity of recent human influenza A viruses (H3N2): a single amino acid change in hemagglutinin altered its recognition of sialyloligosacchar-ides. Virology 278: 587–596.
32. Aich U, Beckley N, Shriver Z, Raman R, Viswanathan K, et al. (2011) Glycomics-based analysis of chicken red blood cells provides insight into the selectivity of the viral agglutination assay. FEBS J 278: 1699–1712. 33. Ghate AA, Air GM (1998) Site-directed mutagenesis of catalytic residues of
influenza virus neuraminidase as an aid to drug design. Eur J Biochem 258: 320– 331.
34. Fazekas de St Groth S (1977) Antigenic, adaptive and adsorptive variants of the influenza haemagglutinin. In: Laver WG, Bachmayer H, Weil R, editors. The influenza hemagglutinin (Symposium, Baden near Vienna, March 21–23, 1977). Wien: Springer-Verlag.
35. Hensley SE, Das SR, Bailey AL, Schmidt LM, Hickman HD, et al. (2009) Hemagglutinin receptor binding avidity drives influenza A virus antigenic drift. Science 326: 734–736.
36. Nobusawa E, Omagari K, Nakajima S, Nakajima K (2012) Reactivity of human convalescent sera with influenza virus hemagglutinin protein mutants at antigenic site A. Microbiol Immunol 56: 99–106.
37. Laver WG, Air GM, Webster RG (1981) Mechanism of antigenic drift in influenza virus. Amino acid sequence changes in an antigenically active region of Hong Kong (H3N2) influenza virus hemagglutinin. J Mol Biol 145: 339–361. 38. Sato K, Morishita T, Nobusawa E, Tonegawa K, Sakae K, et al. (2004)
Amino-acid change on the antigenic region B1 of H3 haemagglutinin may be a trigger for the emergence of drift strain of influenza A virus. Epidemiol Infect 132: 399– 406.
39. Popova L, Smith K, West AH, Wilson PC, James JA, et al. (2012) Immunodominance of antigenic site B over site A of hemagglutinin of recent H3N2 influenza viruses. PLoS One 7: e41895.
40. Walther T, Karamanska R, Chan RW, Chan MC, Jia N, et al. (2013) Glycomic analysis of human respiratory tract tissues and correlation with influenza virus infection. PLoS Pathog 9: e1003223.
41. Heimburg-Molinaro J, Tappert M, Song X, Lasanajak Y, Air G, et al. (2012) Probing virus-glycan interactions using glycan microarrays. Methods Mol Biol 808: 251–267.
42. Cholleti SR, Agravat S, Morris T, Saltz JH, Song X, et al. (2012) Automated motif discovery from glycan array data. OMICS 16: 497–512.
43. Macken C, Lu H, Goodman J, Boykin L (2001) The value of a database in surveillance and vaccine selection. In: Osterhaus ADME, Cox NJ, Hampson AW, editors. Options for the Control of Influenza IV. Amsterdam: Elsevier. 103–106.
Receptor Specificity of H3N2 Influenza 1968-2012