Methodological Framework for World Health
Organization Estimates of the Global Burden
of Foodborne Disease
Brecht Devleesschauwer1,2,3,4*, Juanita A. Haagsma5, Frederick J. Angulo6, David C. Bellinger7,8, Dana Cole6, Dörte Döpfer9, Aamir Fazil10, Eric M. Fèvre11,12, Herman J. Gibb13, Tine Hald14, Martyn D. Kirk15, Robin J. Lake16, Charline Maertens de Noordhout2, Colin D. Mathers17, Scott A. McDonald18, Sara M. Pires14, Niko Speybroeck2, M.
Kate Thomas10, Paul R. Torgerson19, Felicia Wu20, Arie H. Havelaar4,21,22, Nicolas Praet3
1Department of Virology, Parasitology and Immunology, Faculty of Veterinary Medicine, Ghent University, Merelbeke, Belgium,2Insitute of Health and Society (IRSS), Université catholique de Louvain, Brussels, Belgium,3Department of Biomedical Sciences, Institute of Tropical Medicine, Antwerp, Belgium, 4Department of Animal Sciences and Emerging Pathogens Institute, University of Florida, Gainesville, FL, United States of America,5Department of Public Health, Erasmus University Medical Center, Rotterdam, The Netherlands,6Centers for Disease Control and Prevention, Atlanta, GA, United States of America, 7Department of Neurology, Boston Children's Hospital, Harvard Medical School, Boston, MA, United States of America,8Department of Environmental Health, Harvard School of Public Health, Boston, MA, United States of America,9Department of Medical Sciences, School of Veterinary Medicine, University of Wisconsin in Madison, Wisconsin, United States of America,10Public Health Agency of Canada, Guelph, Ontario, Canada,11 Institute of Infection and Global Health, University of Liverpool, Leahurst Campus, Neston, United Kingdom,12 International Livestock Research Institute, Nairobi, Kenya,13 Gibb Epidemiology Consulting, Arlington, VA, United States of America,14 National Food Institute, Danish Technical University, Lyngby, Denmark,15National Centre for Epidemiology and Population Health, Research School of Population Health, The Australian National University, Canberra, Australia,16Institute of Environmental Science and Research, Christchurch, New Zealand,17Department of Health Statistics and Information Systems, World Health Organization, Geneva, Switzerland,18Centre for Infectious Disease Control, National Institute for Public Health and the Environment (RIVM), Bilthoven, The Netherlands, 19Section of Epidemiology, Vetsuisse Faculty, University of Zurich, Zurich, Switzerland,20Department of Food Science and Human Nutrition, Department of Agricultural, Food, and Resource Economics, Michigan State University, East Lansing, MI, United States of America,21 National Institute for Public Health and the Environment (RIVM), Bilthoven, the Netherlands,22 Utrecht University, Utrecht, Netherlands
Abstract
Background
The Foodborne Disease Burden Epidemiology Reference Group (FERG) was established in 2007 by the World Health Organization to estimate the global burden of foodborne dis-eases (FBDs). This paper describes the methodological framework developed by FERG's Computational Task Force to transform epidemiological information into FBD burden estimates.
Methods and Findings
The global and regional burden of 31 FBDs was quantified, along with limited estimates for 5 other FBDs, using Disability-Adjusted Life Years in a hazard- and incidence-based OPEN ACCESS
Citation:Devleesschauwer B, Haagsma JA, Angulo FJ, Bellinger DC, Cole D, Döpfer D, et al. (2015) Methodological Framework for World Health Organization Estimates of the Global Burden of Foodborne Disease. PLoS ONE 10(12): e0142498. doi:10.1371/journal.pone.0142498
Editor:Mirjam E. E. Kretzschmar, The National Institute for Public Health and the Environment, NETHERLANDS
Received:July 20, 2015
Accepted:October 22, 2015
Published:December 3, 2015
Copyright:© 2015 World Health Organization. This is an open access article distributed under the Creative Commons Attribution IGO License, which permits unrestricted use, distribution, and reproduction in any medium, provided the original work is properly cited.http://creativecommons.org/ licenses/by/3.0/igo/, This article should not be reproduced for use in association with the promotion of commercial products, services or any legal entity..
Data Availability Statement:All relevant data are within the paper and its Supporting Information files. The R source code is also available fromhttps:// github.com/brechtdv/FERG.
approach. To accomplish this task, the following workflow was defined: outline of disease models and collection of epidemiological data; design and completion of a database tem-plate; development of an imputation model; identification of disability weights; probabilistic burden assessment; and estimating the proportion of the disease burden by each hazard that is attributable to exposure by food (i.e., source attribution). All computations were per-formed in R and the different functions were compiled in the R package 'FERG'. Traceability and transparency were ensured by sharing results and methods in an interactive way with all FERG members throughout the process.
Conclusions
We developed a comprehensive framework for estimating the global burden of FBDs, in which methodological simplicity and transparency were key elements. All the tools devel-oped have been made available and can be translated into a user-friendly national toolkit for studying and monitoring food safety at the local level.
Introduction
The Foodborne Disease Burden Epidemiology Reference Group (FERG) was established in 2007 by the World Health Organization (WHO) to estimate the global burden of foodborne diseases (FBDs) [1]. In 2012, FERG established a Computational Task Force (CTF) to derive FBD burden estimates using epidemiological information generated by the hazard-based and source attribution task forces [2]. The aim of this paper is to describe the methodological framework developed by the CTF for this task.
Variation in methodological choices has been identified both in general and in foodborne-specific burden of disease studies, impeding comparability of burden estimates across studies [3,4]. To ensure accuracy, utility and comparability with other existing health metric initiatives, FERG decided to quantify the burden of FBDs in terms of Disability-Adjusted Life Years (DALYs), a health gap measure expressing the number of healthy life years lost due to reduc-tion of health and death. Further methodological choices were discussed during the fourth for-mal meeting of FERG in 2010 [5], and confirmed at the FERG Strategic Planning Meeting in 2011 and at the fifth FERG meeting in 2013 [6,7]. The main methodological decision was that DALYs were to be calculated in a hazard- and incidence-based approach [8].
Building on the FERG approach, the CTF tasks were (1) to develop the necessary tools for DALY calculation and (2) to implement these tools for estimating the burden of 36 FBDs, including 21 enteric diseases caused by bacteria, viruses and protozoa, 11 non-enteric parasitic diseases, and 4 diseases caused by chemicals and toxins.
In this paper, we (1) describe the approach taken for quantifying the burden of FBD; (2) describe the steps and methodological choices to calculate DALYs resulting from FBDs; (3) describe traceability and transparency during the process; and (4) discuss limitations and future directions. All tools that were developed by the CTF are available as Supporting Infor-mation, allowing the reader to access, explore and use these different tools.
Hazard- and Incidence-Based DALY Approach
Strong and reliable burden of disease estimates are crucial for setting priorities in public health and biomedical research [9,10]. Ranking disease impact may be based on disease occurrence
permission to publish this article. Gibb Epidemiology Consulting, LLC, provided support in the form of salaries for author [HJG], but did not have any additional role in the study design, data collection and analysis, decision to publish, or preparation of the manuscript. The specific roles of this author are articulated in the‘author contributions’section.
(prevalence or incidence) or on the number of deaths (mortality). However, these simple mea-sures of population health do not provide a full picture of the impact of specific diseases on human health. Indeed, while certain diseases may be very common, their clinical impact may be limited. Infection with a highly prevalent parasite such asEnterobius vermicularis(also known as pinworm or threadworm) for instance has a very low burden because most of the cases are mild to asymptomatic and self-limiting [11]. Likewise, ignoring the age at which peo-ple die, and thus not considering how many years of healthy life might be lost due to a prema-ture death does not fairly capprema-ture the impact of mortality. Disease severity, defined by the health impact and duration of the concerned symptoms and the life expectancy at the age of death, should thus also be taken into account when quantifying burden of disease. Further-more, simple measures of population health do not combine the impacts of morbidity and mortality. This prohibits a comparative ranking of highly morbid, but not necessarily fatal dis-eases such as chorioretinitis and highly lethal disdis-eases such as liver cancer, complicating deci-sions on resource allocation priorities.
To overcome the limitations of simple measures of population health, summary measures of population health (SMPHs) have been developed as an additional source of information for measuring disease burden. Among these SMPHs, the Disability-Adjusted Life Year (DALY) is currently the most widely used in public health research. Originally developed to quantify and compare the burden of diseases, injuries and risk factors across countries, the DALY summa-rizes the occurrence and impact of morbidity and mortality in a single measure [12,13]. The DALY is the key measure in the Global Burden of Disease (GBD) studies and is officially adopted by WHO for reporting on health information [14,15].
The DALY is a health gap measure. It measures the healthy life years lost due to a disease or injury. DALYs are calculated by adding the adjusted number of years lived with disability (YLDs) and the number of years of life lost due to premature mortality (YLLs):
YLD = Number of incident cases x Duration until remission or death x Disability Weight YLL = Number of deaths x Residual life expectancy at the age of death
Different approaches can be taken for calculating DALYs, depending on whether the inter-est lies in quantifying the burden of a health outcome (such as diarrhea), a hazard (as defined by the Codex Alimentarius Commission, e.g. a biological agent that may cause illness in humans such asSalmonella enterica), or a risk factor (e.g. an exposure that increases the likeli-hood of illness such as unsafe water) [16]. Since FERG is concerned with the burden of FBDs, which are caused by a wide range of hazards (bacteria, viruses, parasites, chemicals, and tox-ins), a natural choice is the hazard-based approach. This approach defines the burden of a spe-cific foodborne hazard as that resulting from the health states, i.e., symptoms and sequelae, including death, that are causally related to the concerned hazard transmitted through food, and which may become manifest at different time scales or have different severity levels [8]. This approach thus allows for a comprehensive estimate of the burden of disease due to a cer-tain hazard, including sequelae, which may have a higher burden than acute illness alone [17–
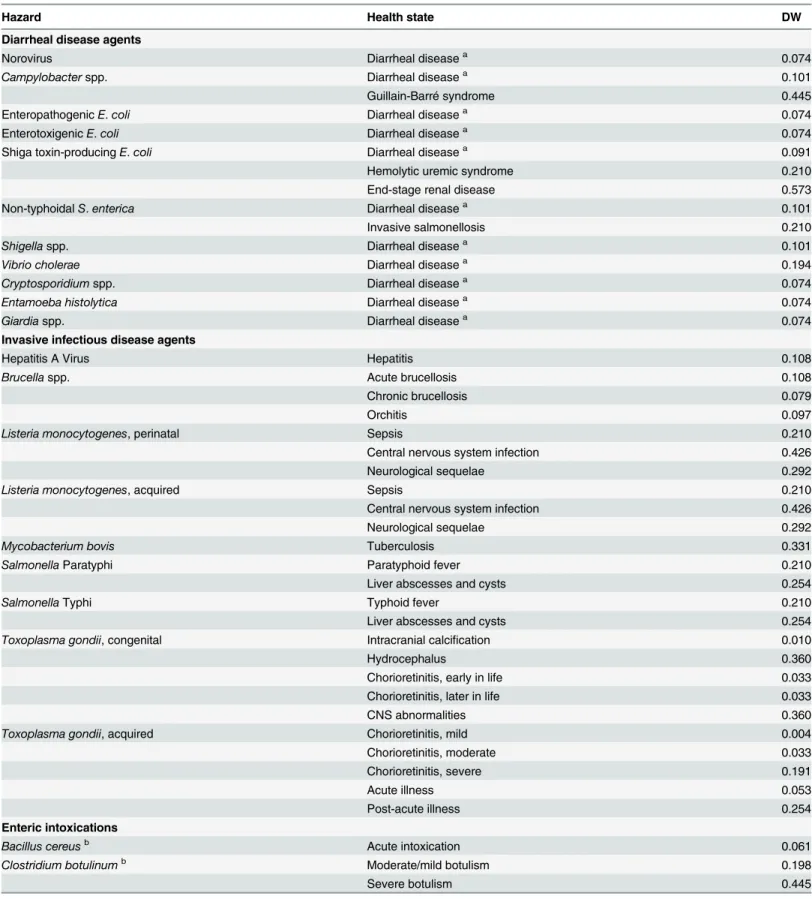
19].Table 1shows the hazards and related health states that were included in FERG's global burden of FBD estimates.
Table 1. FERG hazards, causally related health states and corresponding disability weights (DWs).Details on the derivation of the DWs are provided inS2 Table.
Hazard Health state DW
Diarrheal disease agents
Norovirus Diarrheal diseasea 0.074
Campylobacterspp. Diarrheal diseasea 0.101
Guillain-Barré syndrome 0.445
EnteropathogenicE.coli Diarrheal diseasea 0.074
EnterotoxigenicE.coli Diarrheal diseasea 0.074
Shiga toxin-producingE.coli Diarrheal diseasea 0.091
Hemolytic uremic syndrome 0.210
End-stage renal disease 0.573
Non-typhoidalS.enterica Diarrheal diseasea 0.101
Invasive salmonellosis 0.210
Shigellaspp. Diarrheal diseasea 0.101
Vibrio cholerae Diarrheal diseasea 0.194
Cryptosporidiumspp. Diarrheal diseasea 0.074
Entamoeba histolytica Diarrheal diseasea 0.074
Giardiaspp. Diarrheal diseasea 0.074
Invasive infectious disease agents
Hepatitis A Virus Hepatitis 0.108
Brucellaspp. Acute brucellosis 0.108
Chronic brucellosis 0.079
Orchitis 0.097
Listeria monocytogenes, perinatal Sepsis 0.210
Central nervous system infection 0.426
Neurological sequelae 0.292
Listeria monocytogenes, acquired Sepsis 0.210
Central nervous system infection 0.426
Neurological sequelae 0.292
Mycobacterium bovis Tuberculosis 0.331
SalmonellaParatyphi Paratyphoid fever 0.210
Liver abscesses and cysts 0.254
SalmonellaTyphi Typhoid fever 0.210
Liver abscesses and cysts 0.254
Toxoplasma gondii, congenital Intracranial calcification 0.010
Hydrocephalus 0.360
Chorioretinitis, early in life 0.033
Chorioretinitis, later in life 0.033
CNS abnormalities 0.360
Toxoplasma gondii, acquired Chorioretinitis, mild 0.004
Chorioretinitis, moderate 0.033
Chorioretinitis, severe 0.191
Acute illness 0.053
Post-acute illness 0.254
Enteric intoxications
Bacillus cereusb Acute intoxication 0.061
Clostridium botulinumb Moderate/mild botulism 0.198
Severe botulism 0.445
at a specific point in time, and prevalent diseases are attributed to initial events that happened in the past. This approach therefore reflects the current burden of disease resulting from previ-ous events. For burden of FBD studies, the incidence-based YLD approach was deemed the most appropriate approach, because (1) this approach is more sensitive to current
Table 1. (Continued)
Hazard Health state DW
Clostridium perfringensb Acute intoxication 0.061
Staphylococcus aureusb Acute intoxication 0.061
Cestodes
Echinococcus granulosus, cases seeking treatment Pulmonary cystic echinococcosis 0.192
Hepatic cystic echinococcosis 0.123
Central nervous system cystic echinococcosis 0.221 Echinococcus granulosus, cases not seeking treatment Pulmonary cystic echinococcosis 0.015
Hepatic cystic echinococcosis 0.012
Central nervous system cystic echinococcosis 0.054
Echinococcus multilocularis Alveolar echinococcosis 0.123
Taenia solium Epilepsy: treated, seizure free 0.072
Epilepsy: treated, with recent seizures 0.319
Epilepsy: severe 0.657
Epilepsy: untreated 0.420
Nematodes
Ascarisspp. Ascariasis infestation 0.030
Mild abdominopelvic problems due to ascariasis 0.012
Severe wasting due to ascariasis 0.127
Trichinellaspp. Acute clinical trichinellosis 0.637
Trematodes
Clonorchis sinensis Abdominopelvic problems due to heavy clonorchiosis 0.123 Fasciolaspp. Abdominopelvic problems due to heavy fasciolosis 0.123
Intestinalflukesc Abdominopelvic problems due to heavy intestinalfluke infections 0.123
Opisthorchisspp. Abdominopelvic problems due to heavy opisthorchiosis 0.123 Paragonimusspp. Central nervous system problems due to heavy paragonimosis 0.420 Pulmonary problems due to heavy paragonimosis 0.132 Organic pollutants
Dioxin Infertility 0.056
Hypothyroidy due to prenatal exposure 0.019
Hypothyroidy due postnatal exposure 0.019
Toxins and allergens
Aflatoxin Hepatocellular carcinoma: diagnosis and primary therapy 0.294
Hepatocellular carcinoma: metastatic 0.484
Hepatocellular carcinoma: terminal phase with medication 0.508 Hepatocellular carcinoma: terminal phase without medication 0.519
Cyanide in cassava Konzo 0.065
Peanut allergensb Living with peanut-induced allergy 0.012
aThe disability weights for diarrheal disease were defined as a weighted average of the disability weights for mild, moderate and severe diarrhea, with
different relative contributions of these severity levels leading to different weighted averages for different diarrheal disease agents.
bExcluded from global burden assessments.
cIncludesEchinostomaspp.,Fasciolopsis buski,Heterophyesspp.,Metagonimusspp. and other foodborne intestinal trematode species.
epidemiological trends [20]; (2) is more consistent with the hazard-based approach, since it has the point of infection (or primary health effect from exposure) as starting point for the cal-culations; and (3) is more consistent with the estimation of YLLs, which by definition follows an incidence-based approach, as mortality can be seen as the incidence of death [21]. Neverthe-less, the prevalence- and incidence-based approaches yield similar overall results if the epide-miology of disabilities and the population age-structure are constant over time [20]. However, burden estimates for specific age groups will always differ between the prevalence- and inci-dence-based approaches, because the former assigns the burden to the age at which the burden is experienced, while the latter assigns the burden to the age of disease onset [15].
CTF Structure and Workflow
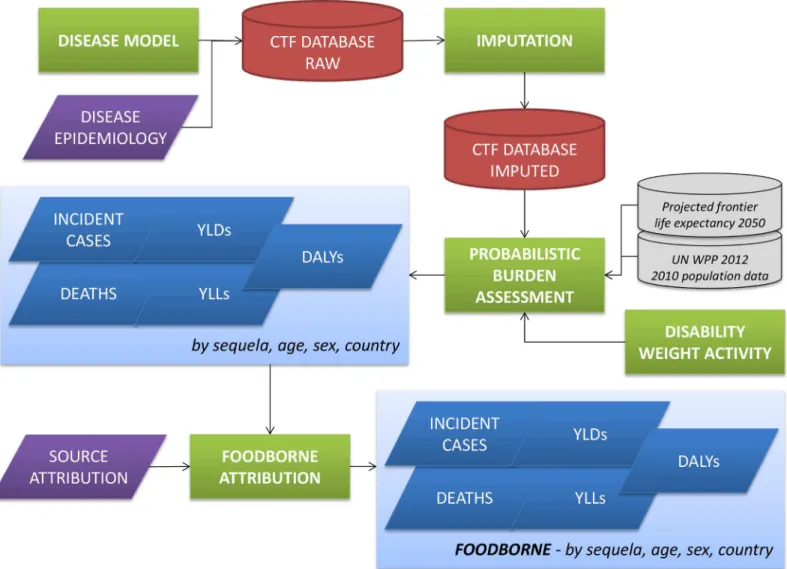
Fig 1shows a schematic overview of the CTF workflow. The CTF structure is defined around the six distinctive components of this workflow, i.e., outline of disease models and collection of epidemiological data; design of a database template; development of an imputation model; identification of disability weights; probabilistic burden assessment; and source attribution of
Fig 1. Computational Task Force workflow.CTF = Computational Task Force; YLDs = Years Lived with Disability; YLLs = Years of Life Lost due to mortality; DALYs = Disability-Adjusted Life Years; UN WPP 2012 = United Nations World Population Prospects 2012 Revision.
the disease burden. All computations were implemented in R version 3.2.0 [22], and the vari-ous functions were compiled in the R package 'FERG', which is available as Supporting Infor-mation to this manuscript (S1 File) and online athttps://github.com/brechtdv/FERG.
Disease models and epidemiological data
The starting point of the CTF workflow was the outline of disease models for each of the included hazards (as chosen by the hazard-based task forces), and the epidemiological data inputs that parameterized these disease models. To obtain this information, systematic reviews were commissioned and managed by three hazard-based task forces, i.e., the Enteric Diseases Task Force (EDTF), the Parasitic Diseases Task Force (PDTF), and the Chemicals and Toxins Task Force (CTTF). Details are therefore provided elsewhere [23–25].
The course of disease is characterized by various health states (e.g. acute or chronic phases, short-term or long-term sequelae), possibly having different severity levels [8]. A disease model, also referred to as an outcome tree, is a schematic representation of the various health states associated with the concerned hazard, and the possible transitions between these states. A disease model for each hazard was defined by the members and commissioned experts of each hazard-based task force, considering relevant health outcomes supported by evidence identified in the respective reviews. Discussions of the choices and uncertainties in deriving the disease models for specific hazards are provided elsewhere [23–25].
In the context of the CTF, disease models were defined ascomputationaldisease models, and not merely asbiologicaldisease models. While biological disease models merely reflect the natural history of disease, computational disease models also reflect the input parameters needed to calculate incidence and mortality of each of the concerned health states. As such, computational disease models are a combination of disease biology and data availability.
Computational disease models may be represented as directed acyclic graphs, defined by parent and child nodes and directed edges (arrows) defining the relationships between nodes. In the CTF framework, parent nodes were either incidence, mortality, YLD or YLL rates, while child nodes were multiplicative elements, such as proportions or ratios (reflecting e.g. the prob-ability of developing a specific symptom following infection, or the proportion of illnesses attributable to the concerned hazard). A specific disease model "language" was developed to denote the relationship and contribution of the different nodes. Rectangles defined parent nodes, and rounded rectangles defined child nodes. Grey nodes did not contribute directly to the DALYs, green nodes contributed YLDs, and red nodes contributed YLLs. Nodes that con-tributed to the incidence of the index disease were identified by a thick border.S1 Figgives the disease models for all 36 FERG hazards.
In general, three main approaches can be distinguished for estimating the burden due to a specific hazard in food, i.e., categorical attribution, counterfactual analysis, and risk assessment.
S1 Tablegives an overview of the modelling strategy applied for each included hazard. As the choice of the modelling strategy was mainly driven by the type of data available, no sensitivity analyses could be performed to triangulate different modelling approaches. Modelling choices were further driven by a strive for consistency with existing WHO Global Health Estimates.
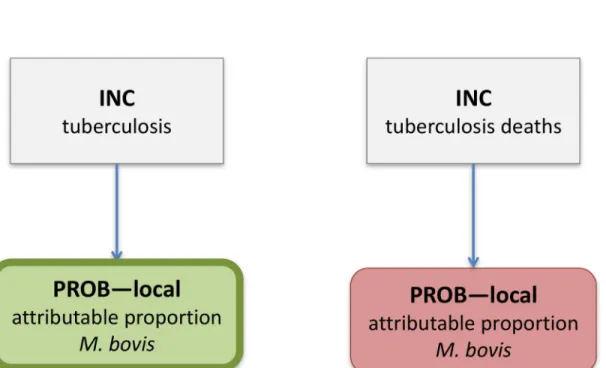
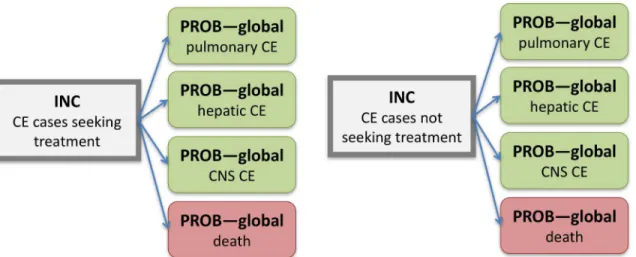
parasitic hazards, and for cyanide in cassava and peanut allergens, and was therefore the stan-dard method used by FERG.Fig 2shows the computational disease model forMycobacterium bovis, which is characteristic for the attributional models. In this model, the overall incidence and mortality of tuberculosis is multiplied with the proportion attributable toM.bovis, result-ing in the incidence and mortality ofM.bovistuberculosis.Fig 3shows the computational dis-ease model forEchinococcus granulosus, which is characteristic for the transitional models. In this model, the overall incidence of infection by this parasite was multiplied with child nodes reflecting the probability of developing the concerned health states, resulting in the incidences of the specific health states.
When the hazard elevates the risk of a disease or disability outcome that occurs in the popu-lation from other causes as well, causal attribution can only be made statistically, and not on an individual basis. This is the case for many chemicals, including aflatoxin and dioxin. Aflatoxin for instance may increase the risk of hepatocellular carcinoma, but it is not possible to specify that a specific liver cancer case was caused by aflatoxin. In this situation, the standard approach for calculating the burden of environmental exposures is to use acounterfactual analysisin which the current disease outcomes with current exposure are compared to the disease out-comes under an alternate exposure (a minimum risk exposure which could be zero, or some
Fig 2. Computational disease model forMycobacterium bovis.Rectangles define parent nodes, while rounded rectangles defined child nodes. Green nodes contribute Years Lived with Disability, and red nodes contribute Years of Life Lost. Nodes contributing to the incidence of the index disease are identified by a thick border. INC = country-specific incidence; PROB–local = country-specific probability.
accepted background level) [27]. This allows calculation of a population attributable fraction (PAF) that can be applied to the all-cause burden estimates for the relevant disease outcome (the so-called burden envelope), leading to a special case of the attributional model [16]. In the context of FERG, counterfactual analysis was used to estimate the burden of aflatoxin-related hepatocellular carcinoma.
In addition to categorical attribution and counterfactual analysis, which can be considered top-down approaches, FBD burden can also be estimated by arisk assessmentapproach, which can be considered a bottom-up approach. In this approach, the incidences of the specific health states (e.g. impaired male fertility due to prenatal dioxin exposure) are estimated by combining exposure and dose-response data. The dose-response model may for instance define the proba-bility of illness at a given exposure level, which can then be translated into an estimate of the number of incident or prevalent cases expected to occur in the exposed population [25,27]. As this approach does not involve burden attribution, it does not necessarily ensure consistency with existing health statistics. However, risk assessment may be a valid alternative when no burden envelopes exist or when it can be demonstrated that the estimated excess risk is additive to the background risk. In the context of FERG, risk assessment was used to estimate the bur-den of dioxin-related hypothyroidy and impaired fertility.
CTF database template
A database template was developed in Excel (Microsoft Corp., Redmond, Washington, USA) to collect the data resulting from the systematic reviews in a standardized way (S2 File). The structure of the database was based on the disease models, with one sheet per node. Three generic sheets were defined: (1) a "RATE" sheet, for rates by country; (2) a "PROB-local" sheet,
Fig 3. Computational disease model forEchinococcus granulosus.Rectangles define parent nodes, while rounded rectangles defined child nodes. Grey nodes do not contribute directly to the DALYs, green nodes contribute YLDs, and red nodes contribute YLLs. Nodes contributing to the incidence of the index disease are identified by a thick border. INC = country-specific incidence; PROB–global = probability applied to all countries; CE = cystic echinococcosis;
CNS = central nervous system.
for proportions or ratios by country; and (3) a "PROB-global" sheet, for a single proportion or ratio that applied to all countries.
Each sheet consisted of four tables for entering (1) the rate or proportion/ratio data; (2) the age distribution; (3) the sex distribution; and (4), if applicable, the duration. Using a drop-down menu, different formats could be selected for entering the input parameters, including a mean and 95% confidence interval; a minimum, most likely and maximum; different percen-tiles; the shape and rate of a Gamma distribution (for rates); and the shape parameters of a Beta distribution (for proportions). Gamma and Beta distributions were chosen because their domains correspond to those of rates and proportions, respectively, and because their parame-ters have an intuitive interpretation (i.e., number of cases and sample size or observation time, respectively, number of positives and number of negatives). Likewise, different levels of stratifi-cation could be selected for the duration parameters (i.e., none, by age only, by sex only, by age and sex). Age distribution, sex distribution and duration were allowed to vary by country, by defining different "groups" and assigning countries to "groups". Full details on the parameters used for quantifying the burden of the different hazards is available in the appendices to the EDTF, PDTF and CTTF manuscripts [23–25].
Imputation
Extrapolation or imputation models may be needed when literature searches cannot provide essential epidemiological data such as incidence or mortality rates [28]. These models estimate parameters based on data of neighboring regions or other time periods. The external data used must thus be representative of the selected population, region and time. The CTF developed, tested and evaluated several possible approaches to impute missing incidence data at the coun-try level [29]. This exercise identified several pitfalls in the use of explanatory covariates, such as the potential for overfitting and the arbitrariness in the selection of covariates. Therefore, and further motivated by a strive for parsimony and transparency, we decided to use a log-Nor-mal random effects model as the default model for imputing missing country-level incidence data. We used the subregions as defined inTable 2as the random effect or cluster variable. This model assumes that the log-transformed incidence rate in countryjbelonging to subre-gioniarises from a Normal distribution with subregion specific meanμiand a within-region
(= between-country) variances2
w. Each subregion specific meanμiis in turn assumed to arise from a Normal distribution with meanμ0and a between-region variances2b:
logðyijÞ Normalðmi;s 2 wÞ
miNormalðm0;s 2 bÞ
After fitting this hierarchical random effects model to the available data, incidence values for countries with no data were imputed based on the resulting posterior predictive distribu-tions. In other words, we represented missing incidence data by log-Normal distributions based on the fitted mean and variance parameters. For countries in a subregion where none of the countries had data, the log-incidence was imputed as multiple random draws from a Nor-mal distribution with mean equal to the fitted global interceptμ0and variance equal to the sum
of the fitted between-region variances2
band thefitted within-region variances 2
uncertainty interval describing the variability between and within subregions):
logðyijÞ Normalðm0;s 2
bþs
2 wÞ
For countries in a subregion where at least one of the other countries had data, the log-inci-dence was imputed as multiple random draws from a Normal distribution with mean equal to the fitted region-specific interceptμiand variance equal to the fitted within-region variances
2 w
Table 2. World Health Organization (WHO) Member States by subregion.
Subregiona WHO member states
AFR D Algeria; Angola; Benin; Burkina Faso; Cameroon; Cape Verde; Chad; Comoros; Equatorial Guinea; Gabon; Gambia; Ghana; Guinea; Guinea-Bissau; Liberia; Madagascar; Mali; Mauritania; Mauritius; Niger; Nigeria; Sao Tome and Principe; Senegal; Seychelles; Sierra Leone; Togo.
AFR E Botswana; Burundi; Central African Republic; Congo; Côte d'Ivoire; Democratic Republic of the Congo; Eritrea; Ethiopia; Kenya; Lesotho; Malawi; Mozambique; Namibia; Rwanda; South Africa; Swaziland; Uganda; United Republic of Tanzania; Zambia; Zimbabwe. AMR A Canada; Cuba; United States of America.
AMR B Antigua and Barbuda; Argentina; Bahamas; Barbados; Belize; Brazil; Chile; Colombia; Costa Rica; Dominica; Dominican Republic; El Salvador; Grenada; Guyana; Honduras; Jamaica; Mexico; Panama; Paraguay; Saint Kitts and Nevis; Saint Lucia; Saint Vincent and the Grenadines; Suriname; Trinidad and Tobago; Uruguay; Venezuela (Bolivarian Republic of). AMR D Bolivia (Plurinational State of); Ecuador; Guatemala; Haiti; Nicaragua; Peru.
EMR B Bahrain; Iran (Islamic Republic of); Jordan; Kuwait; Lebanon; Libyan Arab Jamahiriya; Oman; Qatar; Saudi Arabia; Syrian Arab Republic; Tunisia; United Arab Emirates. EMR D Afghanistan; Djibouti; Egypt; Iraq; Morocco; Pakistan; Somalia; South Sudanb; Sudan;
Yemen.
EUR A Andorra; Austria; Belgium; Croatia; Cyprus; Czech Republic; Denmark; Finland; France; Germany; Greece; Iceland; Ireland; Israel; Italy; Luxembourg; Malta; Monaco; Netherlands; Norway; Portugal; San Marino; Slovenia; Spain; Sweden; Switzerland; United Kingdom. EUR B Albania; Armenia; Azerbaijan; Bosnia and Herzegovina; Bulgaria; Georgia; Kyrgyzstan;
Montenegro; Poland; Romania; Serbia; Slovakia; Tajikistan; The Former Yugoslav Republic of Macedonia; Turkey; Turkmenistan; Uzbekistan.
EUR C Belarus; Estonia; Hungary; Kazakhstan; Latvia; Lithuania; Republic of Moldova; Russian Federation; Ukraine.
SEAR B Indonesia; Sri Lanka; Thailand.
SEAR D Bangladesh; Bhutan; Democratic People's Republic of Korea; India; Maldives; Myanmar; Nepal; Timor-Leste.
WPR A Australia; Brunei Darussalam; Japan; New Zealand; Singapore.
WPR B Cambodia; China; Cook Islands; Fiji; Kiribati; Lao People's Democratic Republic; Malaysia; Marshall Islands; Micronesia (Federated States of); Mongolia; Nauru; Niue; Palau; Papua New Guinea; Philippines; Republic of Korea; Samoa; Solomon Islands; Tonga; Tuvalu; Vanuatu; Viet Nam.
aThe subregions are de
fined on the basis of child and adult mortality as described by Ezzati et al. [49]. Stratum A: very low child and adult mortality, Stratum B: low child mortality and very low adult mortality, Stratum C: low child mortality and high adult mortality, Stratum D: high child and adult mortality, and Stratum E: high child mortality and very high adult mortality. The use of the term“subregion”here and
throughout the text does not identify an official grouping of WHO Member States, and the“subregions”are
not related to the six official regions. AFR = African Region; AMR = Region of the Americas; EMR = Eastern Mediterranean Region; EUR = European Region; SEAR = South-East Asia Region; WPR = Western Pacific Region.
bSouth Sudan was reassigned to the African Region in May 2013. As this study relates to time periods
prior to this date, estimates for South Sudan were included in the Eastern Mediterranean Region.
(thus imputing the log-incidence as that of a“random”country within the concerned subre-gion, with the uncertainty interval describing the variability within subregions):
logðy
ijÞ Normalðmi;s 2 wÞ
When countries were considered free from exposure through the food chain, they were excluded from the imputation model and thus did not contribute to the subregional estimates. This was the case forBrucellaspp., as discussed in [23], andEchinococcus granulosus, as dis-cussed in [24]. For countries with available incidence data, no imputation was performed. The incidence data used in the probabilistic burden assessments were thus a combination of actual data and imputed estimates. No additional step was included to correct incidence data for potential underreporting, as this was already captured by the previous steps of the framework. Indeed, for the hazards that used an attributional model, disease envelopes were used that had already been corrected for underreporting, while for other hazards we directly drew on GBD 2010 estimates (S1 Table). For the remaining hazards, either epidemiological data were used that did not need (further) correction, or the underreporting factor was included in the disease model (which was the case forTrichinellaspp. and cyanide in cassava).
For aflatoxin, the same random effects model was used to extrapolate PAFs, but now using logit-transformed instead of log-transformed values.
The model was implemented in a Bayesian framework, using independent Normal(0, 1e5) priors forμ0and allμi; a Uniform(0, 10) prior forσw; and a Folded-t(1) prior forσb, as sug-gested by Gelman [30]. Sensitivity analyses using Gamma priors for the variance parameters did not yield meaningful differences. The model was run in JAGS [31] through the 'rjags' pack-age in R [32]. After a burn-in of 5000 iterations, another 5000 iterations were retained for infer-ence. Two chains were run, and convergence was ascertained through density and trace plots, and the multivariate potential scale reduction factor (or Brooks-Gelman-Rubin diagnostic). The applied JAGS code is given inS1 Code.
A crucial assumption made by this imputation model is that missing data were considered "missing at random" (MAR), meaning that missingness was independent of the unobserved data, given the observed data [33,34]. In our case, this assumption implied that, within each subregion, countries with data provided unbiased information on those without data, and that, across subregions, subregions with data provided unbiased information on those without data. For five hazards (Bacillus cereus,Clostridium perfringens,Clostridium botulinum, Staphylococ-cus aureus, and peanut allergens), however, only data from high-income subregions, i.e., subre-gions A or B, could be retrieved. In those instances, the assumption of MAR was clearly violated, and it was decided not to extrapolate those data to the rest of the world. As a result, those hazards were excluded from the global burden of disease estimates [35].
Disability weights
DALYs incorporate the severity of health states through the DW, reflecting the corresponding relative reduction in health on a scale from zero to one. DWs for several health states have been derived for the GBD studies and for various national burden of disease studies [40]. To ensure comparability, the CTF adopted the DWs that were used for WHO's Global Health Esti-mates [15]. These DWs were based on those derived for the GBD 2010 study [41], but with an alternative value for primary infertility (i.e., 0.056 instead of 0.011). The latter revision was motivated by an analysis showing that the GBD 2010 weights undervalued the health states associated with infertility [15]. For dioxin-induced hypothyroidy, we adopted the GBD 2013 DW for hypothyroidy, as this health state was not included in the GBD 2010 DW study [42].
Several FBDs present with unique clinical signs for which no DWs have been derived. Acute trichinellosis, for instance, typically presents with myalgia and facial edema, for which no spe-cific DWs are available [39]. When DWs were missing, proxy health states were selected by a medical expert and DW expert in the CTF and confirmed by disease experts in the hazard spe-cific task forces. In other instances, DWs were available for severity levels that were not explic-itly considered in the disease models. For diarrhea, for instance, DWs were available for mild, moderate and severe diarrhea, although the disease models only included diarrhea as such. In those cases, weighted averages were calculated based on published reviews of severity distribu-tions, avoiding an over- or underestimation of YLDs that would occur if only one DW would have been selected.Table 1lists the DWs used for the different FERG health states;S2 Table
provides further details on their derivation.
Probabilistic burden assessment
For each hazard, incidence, mortality, YLD, YLL and DALY rates were calculated for 11 age groups (<1; 1–4; 5–14; 15–24; 25–34; 35–44; 45–54; 55–64; 65–74; 75–84;85) and both
sexes. When necessary, age and sex specific rates were obtained by multiplying the overall rates with outcome specific age and sex distributions. The reference year for the calculation of abso-lute numbers was 2010, with population estimates obtained from the 2012 revision of the United Nations World Population Prospects [43]. All estimates were generated per country, and subsequently aggregated per subregion, per region, and globally (Table 2). The resulting estimates are presented in three hazard-specific papers [23–25] and in a summary paper [35]. The results may also be accessed and explored through an online tool (https://extranet.who. int/sree/Reports?op=vs&path=/WHO_HQ_Reports/G36/PROD/EXT/
FoodborneDiseaseBurden), which shows the breadth and flexibility of our framework in terms of aggregating and reporting estimates.
while acknowledging that it may still not represent the ultimate achievable human life span [15]. In line with current global burden of disease assessments, no age weighting or time dis-counting was applied [14,15]. HIV infected invasive salmonellosis cases and deaths, and HIV infectedM.bovisdeaths, were excluded from the burden estimates. No further corrections were made for possible co-morbidities.
Parameter uncertainty was taken into account by performing the burden assessments in a probabilistic framework. Ten thousand Monte Carlo (parametric bootstrap) simulations of the input parameters were generated to calculate 10,000 estimates of incidence, mortality, YLD, YLL and DALY rates. These 10,000 estimates were then summarized by their median and a 95% uncertainty interval defined as the 2.5thand 97.5thpercentile of the distribution of esti-mates. Special care was taken to deal with correlated uncertainties, for instance when the dis-ease model included "global" probabilities (e.g. when it was assumed that the probability of developing a certain health state following infection was the same for each country). In such cases, a vector of random probabilities was simulated only once and applied to the different countries, instead of incorrectly simulating a new, independent vector of random probabilities for each country.
Source attribution
The main aim of FERG was to quantify the disease burden resulting from foodborne exposure to potentially foodborne hazards. However, many of the hazards considered are not transmit-ted solely by food, but have several potential exposure routes (e.g. direct contact with animals, human-to-human transmission, and waterborne transmission). For certain hazards, it was therefore necessary to attribute a proportion of their overall burden to foodborne exposure (S1 Table).
Some hazards were considered 100% foodborne, i.e.,Listeria monocytogenes,M.bovis, all foodborne trematodes,T.solium,Trichinellaspp., aflatoxin, cyanide in cassava, dioxin and peanut allergens.
For the remaining hazards, a structured expert elicitation using Cooke's Classical Method was conducted to attribute burden to different exposure routes, providing hazards-specific esti-mates for each exposure route per subregion [44]. This process yielded a probabilistic estimate of the proportion foodborne, in the form of an empirical cumulative density function from which random samples could be drawn. Foodborne cases, deaths, YLDs, YLLs and DALYs were then obtained by multiplying the vectors of random values for these parameters with a vector of random values for the proportion foodborne. As before, the perfect correlation of uncertainty was dealt with by simulating only one vector of random foodborne proportions per subregion, and by applying this vector to all parameters of all countries within the con-cerned subregion.
Traceability and Transparency
Discussion
This paper reviewed the methodological framework developed to generate the first systematic quantification of the global burden of FBDs. Details are provided on the underlying methods and assumptions, and tools have been made available for the reader to explore and use. Burden of foodborne disease estimates from these calculations are provided in the papers from the haz-ard-based task forces.
Although our framework is the first framework for quantifying the global burden of FBDs, other methodological frameworks for estimating global burden have been developed, most notably the Global Burden of Cancer study [45] and the Global Burden of Disease study 2010 and 2013 [14,46]. Compared with these efforts, we present a framework that is centered on the quantification of input parameter uncertainty, and in which modelling plays a minimal role. By retaining the link between the input data (and their uncertainties) and the outputs, our framework provides the opportunity to identify regions and hazards with the most uncertain data, highlighting areas for further research in order to produce more accurate and precise bur-den data. As such, the FERG philosophy builds on that of the Dutch burbur-den of foodborne dis-ease studies [18] and the Burden of Communicable Diseases in Europe (BCoDE) study [8,19], but expands the scope by being more comprehensive in terms of hazards and geographical cov-erage, and by adding data imputation and source attribution to the framework.
To overcome the inevitable problem of missing data, we imputed missing data using a hier-archical random effects model as a default. Although the use of explanatory covariates such as eating habits or income levels is often considered in these exercises, we decided not to pursue such models driven by our earlier model evaluations and comparisons [29]. The choice of our default imputation model was further motivated by a strive for parsimony and transparency, while recognizing that other approaches could be used for stand-alone studies. Our imputation model furthermore assumed that missing data were MAR, i.e., that, across subregions and within each specific subregion, disease incidence and missingness were not associated [33,34]. This is a strong assumption, and led to the exclusion of five hazards for which the assumption was clearly violated, i.e.,Bacillus cereus,Clostridium perfringens,Clostridium botulinum, Staph-ylococcus aureus, and peanut allergens. For the remaining hazards, it is difficult to evaluate the validity of this assumption, as this would require a comparison of incidence data in countries with data versus countries without data, which per definition is not possible [29]. As a result, this assumption is made in all global burden of disease studies, even though this is not always explicitly mentioned.
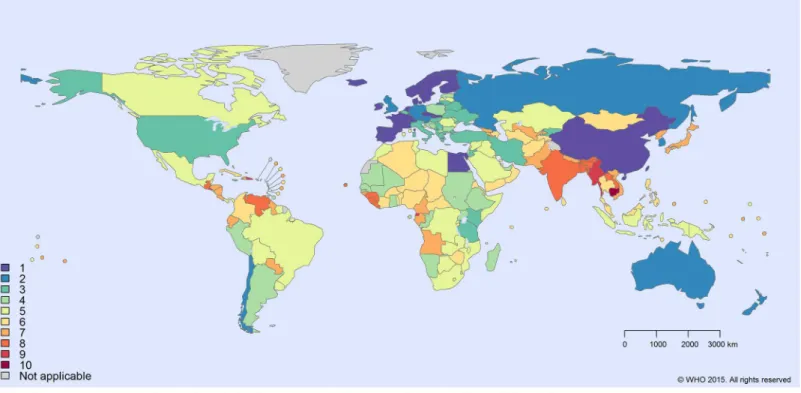
For countries in subregions without any data, our model resulted in relatively large uncer-tainty intervals, as these took into account both variability between and within subregions. Of the 14 hazards that used the random effects imputation model, SEAR B was the subregion for which most often no data could be identified (i.e., for 4 hazards), followed by AMR A, AMR D and SEAR D (for 2 hazards each) (S3 Table). At a country-level, Cambodia was the country with the highest number of data gaps (i.e., for 10 hazards) (Fig 4).
A major limitation of the current framework is that it does not provide for modelling time trends in disease burden. However, the main objective of FERG was to estimate, for the first time, the global burden of FBDs. This sets a baseline against which future trends can be evaluated.
between disease prevalences and a multiplicative model for combining DWs [48]. Similar methods have not yet been described for incidence-based YLDs.
No DWs were available for some FBD outcomes; these had to be mapped to proxy health states for which DWs were available. When DWs were available for distinct severity levels, over- or underestimation of the burden was avoided by using weighted averages based on pub-lished reviews of severity distributions.
By quantifying the burden of 36 foodborne hazards in a single framework, we generated comparable estimates and avoided overestimation which is typical for single-cause burden studies [3]. For diarrheal hazards, we avoided overestimation by using multi-cause studies to derive etiological fractions and by applying an established diarrhea envelope [36]. Attributional models were also used for tuberculosis due toM.bovis, epilepsy due toT.soliumand hepatocel-lular carcinoma due to aflatoxin, ensuring consistency with the respective burden envelopes. For the burden due toAscarisspp., hepatitis A virus,SalmonellaTyphi, andSalmonella Paraty-phi, we directly drew on GBD 2010 estimates. For the remaining hazards, however, in absence of well-accepted envelopes or sufficient scientific evidence on etiological fractions, attributional models could not be applied. Instead, either a transitional model or a risk assessment approach was applied, using the best possible data available (S1 Table). Inevitably, however, this might have led to over- or underestimations compared to attributional models.
Conclusion
We developed a unique methodological framework for estimating the global burden of FBDs, in which methodological simplicity and transparency are key elements. It would be
Fig 4. Number of imputed hazards by WHO member state.
recommended to transform the current tools into a user-friendly national toolkit for estimating and monitoring food safety at the local level. Such a toolkit could incorporate FERG estimates such as source attribution, so that countries lacking such data can still estimate the burden of foodborne diseases.
Supporting Information
S1 Code. JAGS code for Bayesian log-Normal Random Effects Model. (DOC)
S1 Fig. Disease models for all FERG hazards. (PDF)
S1 File. FERG: DALY Calculation Framework for WHO/FERG.R package version 0.1.0. (GZ)
S2 File. FERG database template. (XLSX)
S1 Table. Modelling strategies for the hazards included in the WHO global burden of food-borne disease estimates.
(PDF)
S2 Table. FERG hazards, causally related health states and corresponding disability weights (DWs).The fourth column describes how the various DWs were derived. The source for the DWs is the Global Burden of Disease 2010 Study, unless stated otherwise.
(PDF)
S3 Table. Availability of data for estimating the global and regional burden of foodborne disease.
(XLSX)
Acknowledgments
We would like to acknowledge the assistance of the WHO Secretariat over the life of the FERG initiative, particularly Claudia Stein, Tanja Kuchenmüller, Amy Cawthorne, Yuki Minato, Tim Corrigan, Kurt Straif (IARC), Philippe Verger, Arve Lee Willingham and Danilo Lo Fo Wong. We acknowledge the Institute for Health Metrics and Evaluation (Seattle, WA, USA) for pro-viding data on the global burden of selected diseases. The European Centre for Disease Control and Prevention (Solna, Sweden) supported the work by providing their outcome trees and sponsoring a study on disability weights. The findings and conclusions of this report are those of the authors and do not necessarily represent the official views, decisions or policies of the World Health Organization, US Centers for Disease Control and Prevention, the US Govern-ment or other institutions listed. FJA and DC are employees of the US GovernGovern-ment. This work was part of their official duties.
Author Contributions
References
1. Kuchenmüller T, Hird S, Stein C, Kramarz P, Nanda A, Havelaar AH (2009) Estimating the global bur-den of foodborne diseases—a collaborative effort. Euro Surveill 14.
2. Kuchenmüller T, Abela-Ridder B, Corrigan T, Tritscher A (2013) World Health Organization initiative to estimate the global burden of foodborne diseases. Rev Sci Tech 32: 459–467. PMID:24547649 3. Polinder S, Haagsma JA, Stein C, Havelaar AH (2012) Systematic review of general burden of disease
studies using disability-adjusted life years. Popul Health Metr 10(1): 21. doi:10.1186/1478-7954-10-21 PMID:23113929
4. Haagsma JA, Polinder S, Stein CE, Havelaar AH (2013) Systematic review of foodborne burden of dis-ease studies: quality assessment of data and methodology. Int J Food Microbiol 166(1): 34–47. doi: 10.1016/j.ijfoodmicro.2013.05.029PMID:23827806
5. WHO initiative to estimate the global burden of foodborne diseases: fourth formal meeting of the Food-borne Disease Burden Epidemiology Reference Group (FERG): sharing new results, making future plans, and preparing ground for the countries, 8–12 November 2010. Available:http://www.who.int/ foodsafety/publications/ferg4/en/. Accessed 18 July 2015.
6. WHO initiative to estimate the global burden of foodborne diseases: Strategic planning meeting of the Foodborne Disease Burden Epidemiology Reference Group (FERG), 7–10 November 2011. 7. WHO initiative to estimate the global burden of foodborne diseases: fifth formal meeting of the
Food-borne Disease Burden Epidemiology Reference Group (FERG), 8–12 April 2013, Geneva, Switzerland. Available:http://www.who.int/foodsafety/publications/ferg5/en/. Accessed 18 July 2015.
8. Mangen MJ, Plass D, Havelaar AH, Gibbons CL, Cassini A, Mühlberger N, et al. (2013) The pathogen-and incidence-based DALY approach: an appropriate [corrected] methodology for estimating the bur-den of infectious diseases. PLoS One 8(11): e79740. doi:10.1371/journal.pone.0079740PMID: 24278167
9. Viergever RF, Olifson S, Ghaffar A, Terry RF (2010) A checklist for health research priority setting: nine common themes of good practice. Health Res Policy Syst 8: 36. PMID:21159163
10. Devleesschauwer B, Maertens de Noordhout C, Smit GS, Duchateau L, Dorny P, Stein C, et al. (2014) Quantifying burden of disease to support public health policy in Belgium: opportunities and constraints. BMC Public Health 14: 1196. doi:10.1186/1471-2458-14-1196PMID:25416547
11. Knopp S, Steinmann P, Keiser J, Utzinger J (2012) Nematode infections: soil-transmitted helminths andTrichinella. Infect Dis Clin North Am 26(2): 341–358. doi:10.1016/j.idc.2012.02.006PMID: 22632643
12. Murray CJ, Lopez AD (2013) Measuring the global burden of disease. N Engl J Med 369: 448–457. doi:10.1056/NEJMra1201534PMID:23902484
13. Devleesschauwer B, Havelaar AH, Maertens de Noordhout C, Haagsma JA, Praet N, Dorny P, et al. (2014) Calculating disability-adjusted life years to quantify burden of disease. Int J Public Health 59(3): 565–569. doi:10.1007/s00038-014-0552-zPMID:24752429
14. Murray CJ, Ezzati M, Flaxman AD, Lim S, Lozano R, Michaud C, et al. (2012) GBD 2010: design, defini-tions, and metrics. Lancet 380(9859): 2063–2066. doi:10.1016/S0140-6736(12)61899-6PMID: 23245602
15. World Health Organization (2013) WHO methods and data sources for global burden of disease esti-mates 2000–2011. Global Health Estimates Technical Paper. WHO/HIS/HSI/GHE/2013.4. Available: http://www.who.int/healthinfo/statistics/GlobalDALYmethods_2000_2011.pdf. Accessed 18 July 2015. 16. Devleesschauwer B, Havelaar AH, Maertens de Noordhout C, Haagsma JA, Praet N, Dorny P, et al.
(2014) DALY calculation in practice: a stepwise approach. Int J Public Health 59(3): 571–574. doi:10. 1007/s00038-014-0553-yPMID:24748107
17. Haagsma JA, Siersema PD, De Wit NJ, Havelaar AH (2010) Disease burden of post-infectious irritable bowel syndrome in The Netherlands. Epidemiol Infect 138: 1650–1656. doi:10.1017/
S0950268810000531PMID:20223049
18. Havelaar AH, Haagsma JA, Mangen MJ, Kemmeren JM, Verhoef LP, Vijgen SM, et al. (2012) Disease burden of foodborne pathogens in the Netherlands, 2009. Int J Food Microbiol 156(3): 231–238. doi: 10.1016/j.ijfoodmicro.2012.03.029PMID:22541392
19. Kretzschmar M, Mangen MJ, Pinheiro P, Jahn B, Fèvre EM, Longhi S, et al. (2012) New methodology for estimating the burden of infectious diseases in Europe. PLoS Med 9(4): e1001205. doi:10.1371/ journal.pmed.1001205PMID:22529750
21. Schroeder SA (2012) Incidence, prevalence, and hybrid approaches to calculating disability-adjusted life years. Popul Health Metr 10(1): 19. doi:10.1186/1478-7954-10-19PMID:22967055
22. R Core Team (2015) R: A language and environment for statistical computing. R Foundation for Statis-tical Computing, Vienna, Austria. Available:http://www.R-project.org/.
23. Kirk MD, Pires SM, Black RE, Caipo M, Devleesschauwer B, Döpfer D, et al. (in press) World Health Organization estimates of the global and regional disease burden of 22 foodborne bacterial, protozoal and viral diseases, 2010.
24. Torgerson P, Devleesschauwer B, Praet N, Speybroeck N, Willingham AL, Kasuga F, et al. (in press) World Health Organization estimates of the global and regional disease burden of 11 foodborne para-sitic diseases, 2010.
25. Gibb HJ, Devleesschauwer B, Bolger PM, Wu F, Ezendam J, Cliff J, et al. (submitted) World Health Organization estimates of the global and regional disease burden of 4 foodborne chemicals and toxins, 2010.
26. Murray CJ, Salomon JA, Mathers C (2000) A critical examination of summary measures of population health. Bull World Health Organ 78(8): 981–994. PMID:10994282
27. Prüss-Üstün A, Mathers C, Corvalán C, Woodward A (2003) Assessing the environmental burden of disease at national and local levels. Introduction and methods. In: Prüss-Üstün A, Campbell-Lendrum D, Corvalán C, Woodward A, editors. Environmental Burden of Disease Series. Geneva: World Health Organization.
28. Murray CJ (2007) Towards good practice for health statistics: lessons from the Millennium Develop-ment Goal health indicators. Lancet 369(9564): 862–873. PMID:17350457
29. McDonald SA, Devleesschauwer B, Speybroeck N, Hens N, Praet N, Torgerson PR, et al. (2015) Data-driven methods for imputing national-level incidence rates in global burden of disease studies. Bull World Health Organ 93: 228–236. doi:10.2471/BLT.14.139972PMID:26229187
30. Gelman A (2006) Prior distributions for variance parameters in hierarchical models (comment on article by Browne and Draper). Bayesian analysis 1(3): 515–534.
31. Plummer M (2003). JAGS: A program for analysis of Bayesian graphical models using Gibbs sampling. In Hornik K and Leisch F, editors, DSC 2003. Proceedings of the 3rd International Workshop on Distrib-uted Statistical Computing, March 2003. (pp. 20–22).
32. Plummer M (2014). rjags: Bayesian graphical models using MCMC. R package version 3–12. Avail-able:http://CRAN.R-project.org/package = rjags.
33. Rubin DB (1976). Inference and missing data. Biometrika 63(3): 581–592.
34. Bhaskaran K, Smeeth L (2014). What is the difference between missing completely at random and missing at random? Int J Epidemiol, 43(4): 1336–1339. doi:10.1093/ije/dyu080PMID:24706730 35. Havelaar AH, Kirk MD, Torgerson PR, Gibb HJ, Hald T, Lake RJ, et al. (submitted) World Health
Orga-nization estimates of the global and regional disease burden of foodborne disease, 2010.
36. Pires SM, Fischer-Walker CL, Lanata CF, Devleesschauwer B, Hall AJ, Kirk MD, et al. (submitted) Aeti-ology-specific estimates of the global and regional incidence and mortality of diarrhoeal diseases com-monly transmitted through food.
37. Lanata CF, Fischer-Walker CL, Olascoaga AC, Torres CX, Aryee MJ, Black RE. (2013) Global causes of diarrheal disease mortality in children<5 years of age: a systematic review. PLoS ONE 8(9): e72788. doi:10.1371/journal.pone.0072788PMID:24023773
38. World Health Organization (2014) Global tuberculosis report 2013. WHO/HTM/TB/201311. Geneva: The World Health Organization.
39. Devleesschauwer B, Praet N, Speybroeck N, Torgerson PR, Haagsma JA, De Smet K, et al. (2014) The low global burden of trichinellosis: evidence and implications. Int J Parasitol. doi:10.1016/j.ijpara. 2014.05.006
40. Haagsma JA, Polinder S, Cassini A, Colzani E, Havelaar AH (2014) Review of disability weight studies: comparison of methodological choices and values. Population Health Metrics 12:20. doi:10.1186/ s12963-014-0020-2PMID:26019690
41. Salomon JA, Vos T, Hogan DR, Gagnon M, Naghavi M, Mokdad A, et al. (2012) Common values in assessing health outcomes from disease and injury: disability weights measurement study for the Global Burden of Disease Study 2010. Lancet 380(9859): 2129–2143. doi:10.1016/S0140-6736(12) 61680-8PMID:23245605
43. United Nations Population Division (2013). World population prospects—the 2012 revision. New York: United Nations.
44. Hald T, Aspinall W, Devleesschauwer B, Cooke R, Corrigan T, Havelaar AH, et al. (submitted) Esti-mates of the relative contributions to the burden of disease due to selected foodborne hazards: a World Health Organization expert elicitation.
45. Bray F, Ren JS, Masuyer E, Ferlay J (2013) Global estimates of cancer prevalence for 27 sites in the adult population in 2008. Int J Cancer 132: 1133–1145. doi:10.1002/ijc.27711PMID:22752881 46. Wang H, Liddell CA, Coates MM, Mooney MD, Levitz CE, Schumacher AE, et al. (2014) Global,
regional, and national levels of neonatal, infant, and under-5 mortality during 1990–2013: a systematic analysis for the Global Burden of Disease Study 2013. Lancet 384(9947): 957–979. doi:10.1016/ S0140-6736(14)60497-9PMID:24797572
47. Maertens de Noordhout C, Devleesschauwer B, Angulo FJ, Verbeke G, Haagsma J, Kirk M, et al. (2014) The global burden of listeriosis: a systematic review and meta-analysis. Lancet Infect Dis. doi: 10.1016/S1473-3099(14)70870-9
48. Vos T, Flaxman AD, Naghavi M, Lozano R, Michaud C, Ezzati M, et al. (2012) Years lived with disability (YLDs) for 1160 sequelae of 289 diseases and injuries 1990–2010: a systematic analysis for the Global Burden of Disease Study 2010. Lancet 380(9859): 2163–2196. doi:10.1016/S0140-6736(12)61729-2 PMID:23245607