Plot size and experimental precision for sunflower production
Leandro Homrich Lorentz
1; Alexandra Augusti Boligon
2; Lindolfo Storck
2*; Alessandro
Dal’Col Lúcio
21
UNIPAMPA – Campus Itaqui, R. Luiz Joaquim de Sá Britto, s/n – 97650-000 – Itaqui, RS – Brasil. 2
UFSM – Depto. de Fitotecnia, Av. Roraima, 1000 – 97105-900 – Santa Maria, RS – Brasil. *Corresponding author <lindolfo@pq.cnpq.br>
ABSTRACT: In order for sunflower cultivation to be economically sustainable, research should be based upon suitable experimental techniques. Since this kind of information is not readily available, the aim of this study was to estimate the seed production heterogeneity index and the optimal experimental plot size, and to verify experimental precision in sunflower experiments. Sunflower seed yield figures for plots of 1-meter rows (0.4 m spacing) were collected. The experiments were carried out in the 2004/05 and 2005/06 growing seasons in a 1-ha area, by marking out 12 randomized blocks (12 uniformity trials) of two rows 48 plots long on land used for commercial production of sunflowers in Bossoroca, state of Rio Grande do Sul, Brazil. Plots of different sizes were simulated and estimates made for the mean, variance and coefficient of variance for each plot size, and the production heterogeneity index, optimal plot size and experimental precision estimated. The sunflower seed production heterogeneity index was high, the plots should be large and the rows are the blocks. The optimal plot size is two 3-meter rows (2.4 m2
).
Key words: Helianthus annuus L., experimental techniques, number of replications, experimental design
Tamanho de parcela e precisão experimental para produção de girassol
RESUMO: Para sustentar a expressão econômica da cultura do girassol, a pesquisa deve dispor de técnicas experimentais adequadas. Pela falta desta informação, o trabalho tem como objetivo estimar o índice de heterogeneidade da produção de grãos, o tamanho ótimo de parcela experimental e verificar a precisão experimental em experimentos com girassol. Foi obtida a produção de grãos de girassol em parcelas de uma fila (espaçadas em 0,4 m) de 1 m de comprimento. Nas safras de 2004 e 2005, 2 blocos (12 ensaios em branco) constituídos por duas filas com 48 parcelas de comprimento foram casualizados, numa área de 1 ha com produção comercial de girassol em Bossoroca, RS. Foram planejadas parcelas de diferentes tamanhos, estimadas a média, variância e coeficiente de variação para cada tamanho de parcela, sendo estimados o índice de heterogeneidade da produção, o tamanho ótimo de parcela e a precisão experimental. O índice de heterogeneidade da produção de grãos de girassol é alto, as parcelas devem ser grandes e as filas devem ser os blocos. O tamanho ótimo de parcela é igual a duas filas de 3 m de comprimento (2,4 m2
).
Palavras-chave: Helianthus annuus L., técnicas experimental, número de repetições, delineamento experimental
Introduction
Sunflower (Helianthus annuus L.) is one of the five most grown oil crops in the world (Fagundes, 2007). In Brazil, the most productive regions are in the Center Brazil (states of Mato Grosso - MT, Mato Grosso do Sul - MS, Goiás – GO and Brasília - DF), the Southeast (São Paulo - SP) and the South (Rio Grande do Sul - RS and Paraná - PR), and oil of excellent industrial and nutri-tional quality is produced (Leite et al., 2005).
Due to the importance of the crop, research has been conducted to study sunflower seed productivity as a function of nitrogen fertilization (Castro et al., 1999), weed-control (Brighenti et al., 2006), irrigation (Santos et al., 2002), agronomic and morphological characteris-tics and forage potential (Tomich, 2003). Stability and adaptability have also been analyzed (Porto, 2007).
There are many studies relating to sources of experi-mental error and the use of experiexperi-mental techniques to eliminate error (Banzatto and Kronka, 1996; Gomez and
Gomez, 1984; Ramalho et al., 2005; Steel et al., 1997; Storck et al., 2006a). Rossetti (2002), Viana et al. (2002), Neto et al. (2004), Lopes et al. (2005), Martin et al. (2005), Oliveira et al. (2005), Oliveira et al. (2006) and Storck et al. (2006b) described applications of methods for deter-mining optimal experimental techniques for a variety of crops. The experimental design to be used depends on the crop, the response under study, crop management, environment and other factors, such as the actual method used to determine the best design.
Material and Methods
The study was carried out in a sunflower produc-tion area in Bossoroca, Rio Grande do Sul, (28º45’ S, 54º55’ W and 210 m alt.), over two consecutive grow-ing seasons (2004/05 and 2005/06). In each crop, a 1-ha area was marked out for collecting data. Approxi-mately 75,000 plants ha–1 (three seeds per linear meter)
with row spacing of 0.4 m were drilled on a field of dissecated white oats (Quercus alba L.) during the first two weeks of August each year. Fertilizer (200 kg ha–1 of the fertilizer NPK 5-20-30 (5% N, 20% P2O5, 30% K2O) was applied on the row ten days after emergence, and 60 kg of urea was also applied 25 days after emer-gence. In the selected area, 12 blocks 48-m long and two rows wide were sampled (48 × 0.8 = 38.4 m2 per block).
Each block, considered as a uniform section, was sub-divided into 96 basic units (BU) 1 m long and 0.4 m wide. The flower heads from each BU were harvested, dried, threshed and the seeds produced weighed on precision scales (0.1 g). The number of plants in each BU was also counted.
To test the homogeneity assumption for the 12 blocks, analysis of variance was conducted based on a fully randomized design, with 12 blocks and 96 plots for each crop. To test the homogeneity assumption for the two crops, analysis of variance was also carried out based on a fully randomized design, with two treatments (crops) and 1152 plots.
Based on the values obtained from the 96 BUs in each of the 12 blocks and for the two crops, different plot sizes were simulated. The plots were X1 BUs long (tabular column) and X2 rows wide (tabular row). Plot sizes were simulated by combining adjacent BUs, such that X1*X2=X, where X is the plot size expressed as the number of BUs. The 12 plot sizes (X1*X2) simu-lated were: 1*1, 2*1, 3*1, 4*1, 6*1, 8*1, 1*2, 2*2, 3*2, 4*2, 6*2 and 8*2. Thus, for plots of X BUs, the num-ber of replications is limited to N(x)=96/X. Taking
i
)
x
(
Y
as the total seed yield in the simulated plot consisting of X BUs, for replication i (varying from 1 to N(x)) the following statistics were calculated:) x ( N / ) x ( Y )
x (
M N(x)
i i
∑
= , average of plots with X BUs; V(x) N(x)[Y(x) M(x)]2 /[N(x) 1]
i i − −
=
∑
,vari-ance of plots with X BUs; VU(x) = V(x) / X2, calculated
variance per BU between the plots of X BUs; and,
/M(x) V(x) 100
VC(x)= , variation coefficient between
the plots of X BUs.
For each of the 24 blocks (12 blocks × 2 crops), the heterogeneity index “b” was calculated in accordance with Smith’s empirical formula VU(x)=V1/Xb for
sun-flower seed yield. The value of “b” was estimated as a coefficient of linear regression, using the logarithmic transform of function VU(x)=V1/Xb. The estimate of the parameters (V1 and b) was weighted by degrees of free-dom (DF=N(x)-1), associated with each of the 12 simu-lated plot sizes, since the number of replications or DF depends on the plot size (Steel et al., 1997). In this model,
V1 is the parameter for estimating the variance among plots of one BU (0.4 m2). Similarly, using the
logarith-mic transform and the DF weighting, the parameters of function VC(x) = A/XB were estimated. In this model,
A is the parameter for estimating the VC between the plots of one BU and B=b/2.
The estimates for the parameters of functions VU(x)=V1/Xb and VC(x)=A/XB were used to estimate
optimal plot size (number of BUs) by the modified maxi-mum curvature method (Meier and Lessman, 1971), Xo
= [A2B2 (2B + 1) / (B + 2)]1/(B+2)
. The significant differ-ence between treatment means, expressed as a percent-age of the averpercent-age (D), was estimated by the Hatheway (1961) method using the experimental precision formula
b o 2 2 2
1 t ) A /rX
t ( 2
D= + . In this formula, r is the number of replications, Xo is the optimal plot size expressed as number of BUs; A and b are the mean estimates ob-tained for the functions VC(x)=A/XB and VU(x)=V1/
Xb, t
1 is the tabulated value of t for significance tests
(two-sided at 5% significance) and t2 is the tabulated value of t corresponding to an error of 2(1-P), using p = 0.80 as the probability of obtaining significant results. The tabu-lated values of t-student distribution were obtained with DF degrees of freedom, considering the randomized block design, ie. DF = (I-1)(r-1). The number of treat-ments (I) was set at 4, 8, 12, 16 and 20 combined with 3, 4, 5 and 6 replications (r) per treatment. The values t1 and t2 are 2.131 and 0.866 respectively for a designed ex-periment with, for instance, four treatments (I = 4) and six replications (r = 6).
Results and Discussion
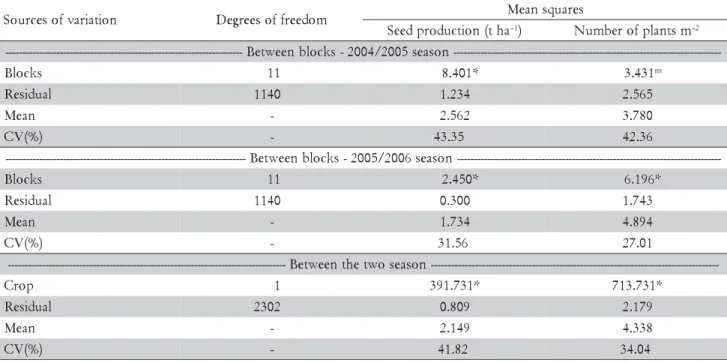
The average seed productivity of the two crops (2.15 t ha–1) is much higher than the historic average (1.5 t ha–1)
for the region (CONAB, 2006), with a significantly higher yield for the 2004/05 season in comparison to the 2005/06 season (Table 1). In addition to environmental factors (excess irradiance, precipitation, etc.) affecting seed production, the correlation analysis between plant density and seed yield could explain the difference be-tween the two years. For all the blocks and both years (Table 2), seed productivity was higher than the historic average and therefore the 24 uniformity trials (blocks) are suitable for the proposed study, taking into account the wide variety of environmental conditions within a larger experimental area. In the 2004/05 season, there was greater variation in seed production between the basic units (Table 2), reflected in the variation coefficients of-ten higher than 40% (average = 43.6%). This variation in production and the high productivity may be related to the lower plant stand quality caused by emergence heterogeneity, resulting in higher production for some blocks in comparison to locations with higher plant den-sity. This explanation does not apply for the following year (2005/06) when the density was higher but produc-tion was lower, due in part to excessive rainfall during flowering, leading to a higher number of unfertilized flowers.
Pearson coefficients, correlating seed production and plant density in the 12 blocks, were 0.22 and 0.84 respec-tively for the of 2004/05 and 2005/06 seasons. These data indicate that the relationship between plant density and production is significant at high densities. Considering that the key variable in the experiments was seed pro-duction, and that this may be related to plant density,
one way of reducing experimental error for seed pro-duction is to ensure uniform, suitable plant density in the experimental units; a similar conclusion was also reached for corn crops (Cargnelutti Filho et al., 2006).
The data obtained from VC(x) and VU(x) were well-adjusted for functions VU(x) = V1/Xb and VC
(x)=A/X B
(Table 2) because, although there are variations in the estimates of V1, b, A and B, the determination coefficient was high for all the blocks in both years. There is a math-ematical similarity between the two functions such that the determination coefficient is the same and B is half of b.
The lower plant density and the higher density varia-tion within blocks in the 2004/2005 season could have resulted in higher estimated heterogeneity indexes (b) (Table 2), showing variations between 0.670 and 1.672 (average = 1.065). In the 2005/2006 season, the index var-ied from 0.271 to 1.100 (average = 0.770) and there was higher variability between blocks (higher VC). Consid-ering that the production heterogeneity index is directly related to the soil heterogeneity index, the soil is too het-erogeneous for conducting the experiments, requiring larger plots for a given level of precision. When b is lower than 0.2, experiments should be designed with a higher number of replications for smaller plots, and when b is higher than 0.7, as in this study, experiments should be designed with larger plots and fewer replica-tions (Lin and Binns, 1986). Thus, as all the blocks in the 2004/2005 season (block 9 is extreme) and nine of the 12 blocks of the 2005/2006 season, have a b value higher than 0.7, we have to design experiments with larger plots and modify the number of replications to obtain the precision required.
Table 1 – Analysis of variance between 12 blocks of the 2004/2005 and 2005/2006 growing seasons and between the two crops for sunflower seed production and plant density.
*Significant for F-test with 1% error probability. cv = coefficient of variation.
n o i t a i r a v f o s e c r u o
S Degreesoffreedom Meansquares a h t ( n o i t c u d o r p d e e
S –1) Numberofplantsm–2
-n o s a e s 5 0 0 2 / 4 0 0 2 -s k c o l b n e e w t e B --s k c o l
B 11 8.401* 3.431ns
l a u d i s e
R 1140 1.234 2.565 n
a e
M - 2.562 3.780
) % ( V
C - 43.35 42.36
--n o s a e s 6 0 0 2 / 5 0 0 2 -s k c o l b n e e w t e B -s k c o l
B 11 2.450* 6.196* l a u d i s e
R 1140 0.300 1.743 n
a e
M - 1.734 4.894
) % ( V
C - 31.56 27.01
-n o s a e s o w t e h t n e e w t e B --p o r
C 1 391.731* 713.731* l a u d i s e
R 2302 0.809 2.179 n
a e
M - 2.149 4.338
) % ( V
There were variations in the estimated optimal plot size (X0) in relation to the blocks and between the two crops, with average figures of 6.95 and 5.34 BUs (BU = 0.4 m2) for the 2004/05 and 2005/06 crops, respectively. A
difference between X0 averages of less than two BUs (0.8 m2) and the similarity of the variation coefficients (17.9%
and 20.4%) for X0 values for the blocks in both years, even when differences in the plant densities and environmen-tal conditions are taken into account, shows that the re-sults are consistent for an average plot size of around 24 blocks. In this case, plots of six basic units (2.40 m2) are
adequate for designing sunflower experiments in the evalu-ated region. Based on seed productivity variations among the blocks and between the crops, due to the influence of
environmental factors, management techniques and plant density, we can infer that the estimated plot size (2.4 m2) is suitable for most of the environments in which the sun-flower is grown. This inference is supported by the method adopted in this study, i,e., a sample of 12 blocks (12 uniformity trials), over a much larger or more repre-sentative experimental area (one hectare) and in two suc-cessive growing seasons. Variations between blocks in a given season could be compared to variations between years, and in this case the results could have much greater relevance when a randomized block design is used.
Experimental precision (D), the difference between two treatment averages, increases (D-value drops, see Table 3) as the number of treatments, the number of
rep-Table 2 – Number of plants per hectare (1,000, Dens) and seed production (average, t ha–1), coefficient of variation (CV%), estimated parameters for equations VU(x)=V1/Xb and VC
(x)=A/X
B and respective determination coefficients
(r2), estimated optimal plot size (Xo, number of basic units) in two successive growing seasons in Bossoroca, RS, Brazil.
k c o l
B Dens Average CV(%) V1 b A B r2 Xo
5 0 0 2 / 4 0 0 2
1 37.500 2.153 51.6 0.950 0.964 45.291 0.482 0.92 7.40
2 34.115 2.167 53.9 2.367 1.531 70.994 0.766 0.67 9.37
3 37.240 2.655 53.2 1.308 0.838 43.65 0.419 0.93 6.97
4 39.323 2.305 55.7 1.336 1.079 50.149 0.540 0.83 7.98
5 37.760 2.438 45.5 1.287 0.981 46.553 0.490 0.42 7.55
6 38.542 2.691 35.4 0.702 1.027 31.140 0.514 0.95 5.82
7 39.323 2.743 36.3 1.154 1.168 39.162 0.584 0.88 6.82
8 39.844 2.969 37.1 1.022 1.102 34.052 0.552 0.93 6.22
9 35.156 2.743 42.4 0.866 0.670 33.913 0.335 0.67 5.44
0
1 39.323 2.190 39.9 1.732 1.672 60.093 0.836 0.86 8.31
1
1 39.583 2.865 36.1 1.117 0.935 36.881 0.467 0.83 6.41
2
1 35.938 2.828 36.1 1.597 0.811 27.989 0.406 0.83 5.09
n a e
M 37.804 2.562 43.6 1.287 1.065 43.274 0.532 0.81 6.95
) % ( V
C 5.0 11.5 18.3 34.8 26.9 28.9 26.9 18.9 17.9
6 0 0 2 / 5 0 0 2
1 46.094 1.573 33.1 0.284 0.802 33.896 0.400 0.97 5.81
2 47.135 1.585 34.0 0.286 0.866 33.747 0.433 0.89 5.92
3 50.260 1.778 31.0 0.408 0.880 35.938 0.440 0.90 6.21
4 48.958 1.648 32.2 0.338 0.833 35.276 0.416 0.70 6.05
5 52.865 1.883 28.5 0.292 0.814 28.720 0.407 0.86 5.19
6 48.438 1.730 27.6 0.313 1.100 32.353 0.550 0.73 6.02
7 51.563 1.943 34.2 0.412 0.379 33.036 0.189 0.93 3.85
8 50.000 1.998 31.4 0.316 0.784 28.157 0.392 0.84 5.05
9 49.219 1.802 26.0 0.345 0.931 32.603 0.465 0.89 5.89
0
1 43.750 1.475 30.7 0.208 0.639 30.932 0.320 0.95 4.98
1
1 51.302 1.754 31.0 0.424 0.946 37.122 0.473 0.56 6.45
2
1 47.656 1.682 34.0 0.252 0.271 29.850 0.136 0.84 2.72
n a e
M 48.937 1.738 31.1 0.323 0.770 32.636 0.385 0.83 5.34
) % ( V
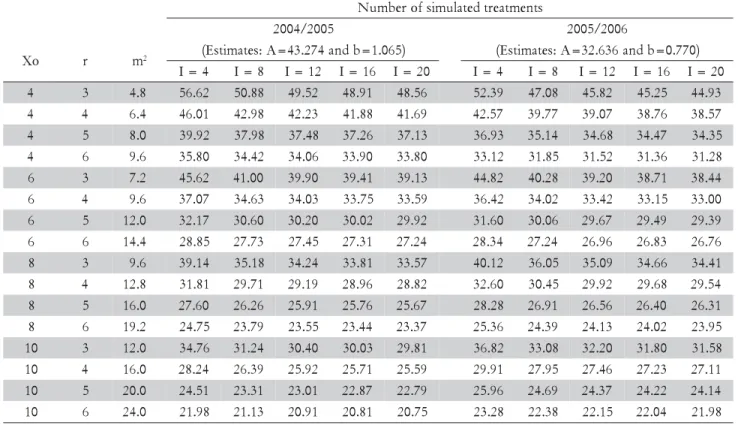
Table 3 – Significant difference between two treatment averages, expressed as a percentage of the average (D) for different plot sizes (Xo) and number of replications (r) with respective area (m2), the number of treatments varying (I) in two sunflower growing seasons.
s t n e m t a e r t d e t a l u m i s f o r e b m u N 5 0 0 2 / 4 0 0
2 2005/2006
o
X r m2 (Estimates:A=43.274andb=1.065) (Estimates:A=32.636andb=0.770)
4 =
I I=8 I=12 I=16 I=20 I=4 I=8 I=12 I=16 I=20 4 3 4.8 56.62 50.88 49.52 48.91 48.56 52.39 47.08 45.82 45.25 44.93 4 4 6.4 46.01 42.98 42.23 41.88 41.69 42.57 39.77 39.07 38.76 38.57 4 5 8.0 39.92 37.98 37.48 37.26 37.13 36.93 35.14 34.68 34.47 34.35 4 6 9.6 35.80 34.42 34.06 33.90 33.80 33.12 31.85 31.52 31.36 31.28 6 3 7.2 45.62 41.00 39.90 39.41 39.13 44.82 40.28 39.20 38.71 38.44 6 4 9.6 37.07 34.63 34.03 33.75 33.59 36.42 34.02 33.42 33.15 33.00 6 5 12.0 32.17 30.60 30.20 30.02 29.92 31.60 30.06 29.67 29.49 29.39 6 6 14.4 28.85 27.73 27.45 27.31 27.24 28.34 27.24 26.96 26.83 26.76 8 3 9.6 39.14 35.18 34.24 33.81 33.57 40.12 36.05 35.09 34.66 34.41 8 4 12.8 31.81 29.71 29.19 28.96 28.82 32.60 30.45 29.92 29.68 29.54 8 5 16.0 27.60 26.26 25.91 25.76 25.67 28.28 26.91 26.56 26.40 26.31 8 6 19.2 24.75 23.79 23.55 23.44 23.37 25.36 24.39 24.13 24.02 23.95
0
1 3 12.0 34.76 31.24 30.40 30.03 29.81 36.82 33.08 32.20 31.80 31.58 0
1 4 16.0 28.24 26.39 25.92 25.71 25.59 29.91 27.95 27.46 27.23 27.11 0
1 5 20.0 24.51 23.31 23.01 22.87 22.79 25.96 24.69 24.37 24.22 24.14 0
1 6 24.0 21.98 21.13 20.91 20.81 20.75 23.28 22.38 22.15 22.04 21.98
lications and the plot size is increased. In practice, since the values of b are high (Lin and Binns, 1986), experimen-tal precision is increased more effectively by increasing plot size rather than the number of replications, assum-ing the area per treatment to be the same. For an experi-ment with eight treatexperi-ments, for example, it is reasonable to design experiments with plots of eight BUs (3.2 m2) and
four replications per treatment, for a total experimental area of 102.4 m2, which would result in a minimum
sig-nificant difference of 29.71% in average seed yield. Although the variation coefficients for the estimates of parameters V1, b, A, B were relatively different, the D-values did not differ in magnitude for the two seasons. For instance, with Xo, r and I values of 10, 3 and 12 re-spectively, we obtained a D-value of 30.4% for the ex-periment on the 2004/05 crop, whereas for the 2005/06 experiment, it was 32.2%.
Conclusion
A randomized block design (“blocks” understood to mean “rows”) is suitable for evaluating sunflower seed productivity. The optimal plot size for sunflower experi-ments was found to be two rows (0.4 m spacing) three meters long (area 2.4 m2). Finally, for experiments
de-signed with 2.4 m2 plots, the minimum significant
dif-ference between the two treatment means was between 24.24% and 45.62%, depending on the number of repli-cations and treatments considered.
References
Banzatto, D.A.; Kronka, S.N. 1996. Agricultural experimentation. 2 ed. FUNEP, Jaboticabal, SP, Brazil. (in Portuguese). Brighenti, A.M.; Castro, C.; Menezes, C.C.; Oliveira, F.A.;
Fernandes, P.B. 2006. Simultaneous application of desiccants and boron for weed control and mineral nutrition of soybean and sunflower. Planta Daninha 24: 797-804 (in Portuguese, with abstract in English).
Cargnelutti Filho, A.; Storck, L.; Lopes, S.J.; Lúcio, A.D. 2006. Population variability and its effect on experimental precision. Ciência Rural 36: 42-50 (in Portuguese, with abstract in English). Castro, C.; Balla, A.; Castiglioni, V.B.R.; Sfredo, G.J. 1999. Levels and methods of nitrogen supply for sunflower. Scientia Agricola 56: 827-833.
Companhia Nacional de Abastecimento [CONAB]. 2006. Sunflower: comparative of the area, productivity and production. Available at: http://www.conab.gov.br/conabweb/ d o w n l o a d / c a s / s e m a n a i s / s e m a n a 1 5 a 1 9 0 5 2 0 0 6 / conj_girassol_11_a_15_09_06.pdf. [Accessed Feb. 02, 2010]. (in Portuguese).
Cruz, C.D.; Carneiro, P.C.S. 2003. Biometrics models applied to genetic improvement. 2 ed. UFV, Viçosa, MG, Brazil (in Portuguese).
Fagundes, M.H. 2007. Seeds of sunflower: some commentaries. Available at: http://www.conab.gov.br/conabweb/download/ cas/especiais/semente_de_girassol.pdf [Accessed Feb. 02, 2010]. (in Portuguese).
Gomez, K.A.; Gomez, A.A. 1984. Statistical Procedures for Agricultural Research. 2 ed. John Wiley, New York, NY, USA. Hatheway, W.H. 1961. Convenient plot size. Agronomy Journal
53: 279-280.
Lin, C.S.; Binns, M.R. 1986. Relative efficiency of two randomized block designs having different plot size and numbers of replications and of plots per block. Agronomy Journal 78: 531-534.
Lopes, S.J.; Storck, L.; Lúcio, A.D.; Lorentz, L.H.; Lovato, C.; Dias, V.O. 2005. Experimental plot size in grain sorghum in different plant densities. Pesquisa Agropecuária Brasileira 40: 525-530. (in Portuguese, with abstract in English).
Martin, T.N.; Dutra, L.M.C.; Jauer, A.; Storck, L. 2005. Optimal plot size and number of replications in soybeans (Glycine max (L.) Merril). Ciência Rural 35: 271-276. (in Portuguese, with abstract in English).
Meier, V.D.; Lessman, K.J. 1971. Estimation of optimal field plot shape and size for testing yied in Crambe abyssinica Hochst. Crop Science 11: 648-650.
Neto, D.H.; Sediyama, T.; Souza, M.A.S.; Cecon, P.R.; Yamanaka, C.H.; Sediyama, M.A.N.; Viana, A.E.S. 2004. Plot size in experiments with wheat irrigated under no-tillage and conventional tillage. Pesquisa Agropecuária Brasileira 39: 517-524. (in Portuguese, with abstract in English).
Oliveira, S.J.R.; Storck, L.; Lopes, S.J.; Lúcio, A.D.; Feijó, S.; Damo, H.P. 2005. Plot size and experimental unit relationship in exploratory experiments. Scientia Agrícola 62: 585-589. Oliveira, S.J.R.; Storck, L.; Lúcio, A.D.; Lopes, S.J.; Martini, L.F.D.
2006. Heterogeneity index, variation coefficient and optimal potato plot size. Ciência Rural 36: 1710-1716. (in Portuguese, with abstract in English).
Porto, W.S.; Carvalho, C.G.P.; Pinto, R.J.B. 2007. Adaptability and stability as selection criteria for sunflower genotypes. Pesquisa Agropecuária Brasileira 42: 419-499. (in Portuguese, with abstract in English).
Ramalho, M.A.P.; Ferreira, D.F.; Oliveira, A.C. 2005. Experimentation in genetics and improvement of plants. 2 ed. UFLA, Lavras, MG, Brazil. (in Portuguese).
Rossetti, A.G. 2002. Influence of the plot size and number of replicates on the precision of perennial arboreal plant trials. Pesquisa Agropecuária Brasileira 37: 433-438. (in Portuguese, with abstract in English).
Santos, A.C.; Andrade, A.P.; Lima, J.R.S.; Silva, I.F.S.; Cavalcante, V.R. 2002. Temporal variability of the pluvial precipitation: nitrogen amount in the soil over sunflower income. Ciência Rural 32: 757-764 (in Portuguese, with abstract in English). Steel, R.G.D.; Torrie, J.H.; Dickey, D.A. 1997. Principles and
Procedures of Statistics: A Biometrical Approach. McGraw-Hill, New York, NY,USA.
Storck, L.; Bisognin, D.A.; Oliveira, S.J.R. 2006a. Potato trial dimensions and optimal plot size estimations. Pesquisa Agropecuária Brasileira 41: 903-909. (in Portuguese, with abstract in English).
Storck, L.; Garcia, D.C.; Lopes, S.J.; Estefanel, V. 2006b. Vegetal experimentation. 2 ed. UFSM, Santa Maria, RS, Brazil. (in Portuguese).
Tomich, T.R.; Rodrigues, J.A.S.; Gonçalves, L.C.; Tomich, R.G.P.; Carvalho, A.U. 2003. Forage potential of sunflower cultivars produced in double-cropping system for silage. Arquivo Brasileiro de Medicina Veterinária e Zootecnia 55: 756-762. (in Portuguese, with abstract in English).
Viana, A.E.S.; Sediyama, T.; Cecon, P.R.; Lopes, S.C.; Sediyama, M.A.N. 2002. Estimates of plot sizes in experiments with cassava. Horticultura Brasileira 20: 58-63. (in Portuguese, with abstract in English).