ABSTRACT: The capacity of soils to sequestrate carbon (C) is mainly related to the formation of organo-mineral complexes. In this study, we investigated the influence of soil management systems on the C retention capacity of soil with an emphasis on the silt and clay fractions of two subtropical soils with different mineralogy and climate. Samples from a Humic Hapludox and a Rhodic Hapludox, clayey soils cultivated for approximately 30 years under no-tillage (NT) and conventional tillage (CT) were collected from six layers distributed within 100-cm soil depth from each site and from an adjacent native forest. After the removal of particulate organic mat-ter (POM), the suspension (<53 µm) was sonicated, the silt and clay fractions were separated in accordance with Stokes' law and the carbon content of whole soil and physical fractions was determined. In the Humic Hapludox, the clay and silt fractions under NT showed a higher maximum C retention (72 and 52 g kg−1, respectively) in comparison to those under CT (54
and 38 g kg−1, respectively). Moreover, the C concentration increase in both fractions under
NT occurred mainly in the topsoil (up to 5 cm). The C retention in physical fractions of Rhodic Hapludox varied from 25 to 32 g kg−1, and no difference was observed whether under an NT or
a CT management system. The predominance of goethite and gibbsite in the Humic Hapludox, as well as its exposure to a colder climate, may have contributed to its greater C retention capacity. In addition to the organo-mineral interaction, a mechanism of organic matter self-assemblage, enhanced by longer periods of soil non-disturbance, seems to have contributed to the carbon stabilization in both soils.
Keywords: carbon saturation, mineralogy, physical fractionation, soil organic matter, soil profile
Introduction
Studies providing evidence of the impact of con-servation management systems on the improvement of carbon (C) stocks in tropical and subtropical soils have been conducted mostly in soil depths down to 30 cm. However, a number of recent studies have indicated the importance of deeper layers of Oxisols in storing C (Bod-dey et al., 2010; Dieckow et al., 2005). An approximately 59 % greater potential for C storage has been observed for the 0 to 100 cm layer in comparison to that of soil depths of 30 cm in South Brazilian Oxisols under no-tillage (NT) (Boddey et al., 2010).
As regards the C storage capacity, the results ob-tained with surface layers of temperate soils indicated that saturation of the C retention capacity may occur in some soils, as shown by a discrete and asymptotic in-crease in C stocks with an inin-crease in photosynthesized C inputs to the soil (Six et al., 2002; Stewart et al., 2009). This behavior was observed mainly in soils that had a high pre-existing soil C concentration (Carrington et al., 2012; Stewart et al., 2007, 2008, 2009). In addition to the C concentration, soil texture also affects the maximum capacity of C retention (Six et al., 2002). Fine-textured soils usually present a higher value for maximum C re-tention capacity than sandy soils (Angers et al., 2011). This behavior is attributed to a greater available surface area for the organo-mineral interactions shown by the clay and silt fractions (Stewart et al., 2008).
Despite a large number of studies regarding the effect of conservative soil management systems on soil C sequestration, data relating to the role of the clay and silt fraction in retaining C in subtropical Oxisols are scarce. Some results obtained with temperate soils indi-cated that for a given soil, maximum C retention under NT may be greater than under conventional tillage (CT) (Stewart et al., 2007).
In addition to land use and soil parameters, climate was also proven to affect the potential for soil C storage in French soils, where, in colder regions, the C reten-tion capacity tends to be greater (Angers et al., 2011). In Brazilian soils, a study about C sequestration in physical fractions collected up to 17.5 cm from an agriculture Ac-risol, have indicated that the clay fraction tends to show a finite capacity for storing C (Diekow et al., 2005). This study aimed to investigate the relationship between soil management systems and soil type with regard to the potential for soil C retention at depth of two subtropical soils by focusing on the role of the clay and silt fractions in the C stabilization process.
Materials and Methods
Experimental sites and soil sampling
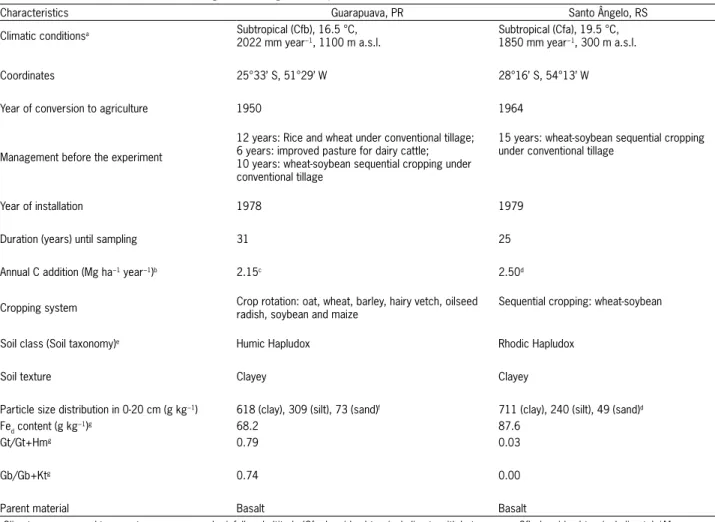
The soils investigated in this study belong to long-term experiments located in Guarapuava (Paraná State) and in Santo Ângelo (Rio Grande do Sul State) in southern Brazil (Table 1). The experiments consisted of
Received July 18, 2013 Accepted February 10, 2014
1Federal University of Rio Grande do Sul/Faculty of
Agricultural and Life Sciences – Soil Science Dept., Av. Bento Gonçalves, 7712, C.P. 15100 − 91540-000 − Porto Alegre, RS − Brazil.
2Federal University of Rio Grande do Sul/Institute of
Chemistry − Physicochemical Dept.
*Corresponding author <ceciliasacramento@gmail.com> Edited by: Tairone Paiva Leão
Carbon sequestration in clay and silt fractions of Brazilian soils under conventional
Cecília Estima Sacramento dos Reis1*, Deborah Pinheiro Dick2, Jennifer da Silva Caldas1, Cimélio Bayer1
two soil management systems (NT and CT) that were arranged in a randomized complete block design, with three field replications for each management system in Guarapuava and two field replications for each manage-ment system in Santo Ângelo (Table 1). The selected soils are both clayey and differ in the mineralogy of the clay fraction and environmental conditions (Table 1).
Soil samples were collected from the 0-2.5, 2.5-5, 5-10, 10-20, 20-30, 30-40, 40-60, 60-80 and 80-100 cm layers under CT and under NT, in all field replications. The samples from an adjacent area (native forest, NF) of each experiment were collected from three random plots, approximately 5 m apart at the same soil depths to represent the natural soil conditions. The soil samples were air-dried and passed through a 2-mm sieve.
Soil physical fractionation and carbon concentra-tion analysis
Sand (>53 µm), silt (53-2 µm) and clay (<2 µm) fractions were obtained by particle size fractionation. Five grams of soil sample from each field replication
were weighed in a 100-mL glass tube, and 50 mL dis-tilled water was added. In preliminary dispersion tests, the mechanical agitation of the soil sample in distilled water was proven to be inefficient in breaking down the aggregates causing the sieve to clog. Thereafter, 7.5 g of commercial sand (previously treated with concentrated hydrochloric acid (HCl) to remove possible contaminants and dried at 105 °C) were added to the tube.
The suspension was mechanically stirred for 16 h and passed through a 53-µm sieve to separate the par-ticulate organic matter (POM). The fraction > 53 µm contained the POM, the soil sand fraction and the added commercial sand particles. Thereafter, the suspension containing the fraction <53 µm was sonicated with the energy needed to attain 95 % dispersion in the Humic Hapludox (1500 J mL−1) and 99 % dispersion in the Rhodic Hapludox (420 J mL−1) to separate the clay and silt fractions. The respective energy levels were deter-mined in previous testing of each soil separately. The sonicated suspension was transferred to a glass tube, and the volume was completed to 1 L with distilled water.
Table 1 −Main characteristics of each long-term management experiment and soil.
Characteristics Guarapuava, PR Santo Ângelo, RS
Climatic conditionsa Subtropical (Cfb), 16.5 °C,
2022 mm year−1, 1100 m a.s.l.
Subtropical (Cfa), 19.5 °C, 1850 mm year−1, 300 m a.s.l.
Coordinates 25°33’ S, 51°29’ W 28°16’ S, 54°13’ W
Year of conversion to agriculture 1950 1964
Management before the experiment
12 years: Rice and wheat under conventional tillage; 6 years: improved pasture for dairy cattle; 10 years: wheat-soybean sequential cropping under conventional tillage
15 years: wheat-soybean sequential cropping under conventional tillage
Year of installation 1978 1979
Duration (years) until sampling 31 25
Annual C addition (Mg ha−1 year−1)b 2.15c 2.50d
Cropping system Crop rotation: oat, wheat, barley, hairy vetch, oilseed radish, soybean and maize
Sequential cropping: wheat-soybean
Soil class (Soil taxonomy)e Humic Hapludox Rhodic Hapludox
Soil texture Clayey Clayey
Particle size distribution in 0-20 cm (g kg−1) 618 (clay), 309 (silt), 73 (sand)f 711 (clay), 240 (silt), 49 (sand)d
Fed content (g kg
−1)g 68.2 87.6
Gt/Gt+Hmg 0.79 0.03
Gb/Gb+Ktg 0.74 0.00
Parent material Basalt Basalt
aClimate, mean annual temperature, mean annual rainfall and altitude (Cfa: humid subtropical climate with hot summer; Cfb: humid subtropical climate); bMean annual
C addition to soil between no-tillage and conventional tillage systems; cCosta et al, 2004; dDieckow et al., 2009; eSoil Survey Staff (2010); fCosta et al. (2003); gFe d:
The clay fraction was separated according to Stokes’ law. This fraction was collected successively until its com-plete removal, leaving behind in the glass tube distilled water and the silt fraction only. Both fractions were floc-culated with 1 mol L−1 HCl solution, dried at 60 °C and finally crushed in a mortar. The proportion of the silt and of the clay fractions was determined gravimetrically. The proportion of the sand fraction (that contains the POM) was obtained by difference of 100 %, after dis-counting the mass of the added commercial sand. The layers 20-30 cm, 30-40 cm and 60-80 cm were not includ-ed in this approach, since their C content was similar to that of the adjacent soil layers.
In order to verify the presence of light fraction (LF) in the silt fraction (Diekow et al., 2005), a composite silt sample of the field replications was further submitted to density fractionation with sodium polytungstate solution (SPT) at d = 2.0 g cm−3. In a glass centrifuge tube, 30 mL SPT solution and 0.5 g silt were added, and the suspen-sion was stirred manually five times and submitted to centrifugation for 90 min at 2000 x g. The supernatant
containing the LF was filtered, and the excess SPT solu-tion was removed by washing the LF with 100 mL dis-tilled water and 100 mL 0.01 mol L−1 CaCl
2 solution. The silt fraction remaining in the tube was centrifuged two times with 80 mL distilled water for 40 min at 2000 x g.
The third centrifugation was performed with 80 mL 0.01 mol L−1 CaCl
2 solution for 20 min at 2000 x g, resulting in LF-free silt.
The C concentration of the whole soil (Csoil), LF, silt (Csilt) and clay (Cclay) fractions was analyzed by dry com-bustion. The C concentration of the sand fraction (Csand) was obtained from the difference between the Csoil and that of Csilt+Cclay. The C concentration of the LF-free silt (LF-free Csilt) was calculated from the difference between the Csilt and that of the separated LF. The ratio Cfraction/ Csoil that identifies the contribution of each fraction to the C of the whole soil was calculated based on the C concentration and the respective weight proportion of each fraction.
The Csilt, LF-free Csilt and Cclay were related to Csoil for each system studied to investigate the C distribution in each physical fraction, as well as their C retention ca-pacity. The exponential data were best fitted to the equa-tions as follows:
Cfraction= a+b(1–e-cCsoil) (Eq. 1) (NF system)
Cfraction= a+(b/Csoil) (Eq. 2) (agricultural systems)
where a, b and c are constants and Cfraction and Csoil are the C concentrations (g kg−1). The maximum C retention (Cretention) in the clay and silt fractions was calculated from the respective equations assuming Csoil tending to infinity.
The C saturation deficit (Csd) of a given system and of a given fraction was calculated for each layer (Clayer) by the equation Csd=Cretention-Clayer (Eq.3), using the re-sulting curve to estimate the Clayer in each layer for a
given Csoil value. The Csd represents the soil potential for further C sequestration as a stable form in each system (Angers et al., 2011).
Carbon stock (Cstock) in the physical fractions and in the whole soil was calculated by the equivalent soil mass approach (Ellert and Bettany, 1995), taking the soil mass of the NF as a reference.
Carbon resistance and resilience indexes in soil and in physical fractions
The resistance index (Cstock in CT/Cstock in NF) and the resilience index ((Cstock in NT - Cstock in CT) / (Cstock in NF - Cstock in CT)) were calculated (Dieckow et al., 2009). The first index describes the capacity of the soil to main-tain the Cstock throughout the disturbances caused by CT implementation, while the second describes the capac-ity of the soil to recover the Cstock by the adoption of NT after soil cultivation under CT.
Data analysis
The experimental data (C concentration and ratio Cfraction/Csoil) were subjected to analysis of variance and to the Tukey test (p < 0.10) to evaluate the significance
of the effects of management systems on each soil. The data from native soils were not included in the statistical analysis.
Results and Discussion
Organic carbon concentration in soil and in physi-cal fractions
In the Humic Hapludox profiles, the clay content varied between 415 and 526 g kg−1 and that of silt be-tween 219 and 325 g kg−1 under native forest (data not shown). Under the agricultural soil systems the clay content varied between 393 and 513 g kg−1 and that of silt between 153 and 299 g kg−1. In the Rhodic Haplu-dox profiles, the clay content ranged from 568 to 706 g kg−1 and that of silt from 235 to 307 g kg−1 under native forest. Under the agricultural systems, the clay content ranged from 484 to 694 g kg−1 and that of silt between 186 to 304 g kg−1 (data not shown).
Differences in the C concentration of whole soil between tillage systems occurred up to 5 cm depth in the Humic Hapludox (Table 2) and up to 2.5 cm depth in the Rhodic Hapludox (Table 3) (p < 0.10). In both
Compared to the NF, the C concentration under NT management in the Humic Hapludox was lower only in the first 2.5 cm of depth; this is most likely due to the thick layer of litter found under native forests (Potes et al., 2012). In contrast, in the Rhodic Hapludox, the NF had greater C values than those of the agricultural areas up to a depth of 20 cm, indicating that the adverse ef-fects of 15 years under CT management on the soil C retention had not been overcome after 25 years of NT management (Table 3).
The higher resistance of the Humic Hapludox in losing C due to the introduction of agriculture cannot be attributed in this study to the texture, as was proposed by Dieckow et al. (2009), because the two soils inves-tigated are clayey (Table 1). More likely, in our study, the higher temperature in the summer in the Santo Ân-gelo region (where it can reach 35 °C) in comparison to that of Guarapuava enhances the mineralization of the residues in the Rhodic Hapludox, causing not only lower soil C concentrations under NF but also lower C con-centrations under NT management. An additional fac-tor that may explain the different behavior observed in both soils may be their different mineralogy. The Humic Hapludox, richer in goethite and gibbsite than the Rhod-ic Hapludox (Table 1), presents a high density of reac-tive sorpreac-tive sites (Kaiser and Guggenberger, 2000) and, thus, stabilizes the soil organic matter (SOM) through more effective organo-mineral interactions. In addition to its lower surface area, the denser structure of hema-tite in comparison to goethite leads to lower reactivity of
the surface hydroxyl groups (Schwertmann and Taylor, 1977).
In the Humic Hapludox, the C concentration in the clay fraction (Cclay) ranged between 10 and 60 g kg−1 with the exception of the 0-2.5 cm layer from NF, and it was always greater than the values observed for the respective silt fraction (Csilt) (Table 2), regardless of the soil use. After the removal of the LF, the C concentra-tion of the silt fracconcentra-tion (LF-free Csilt) decreased down to 100 cm in all three sites of the Humic Hapludox, demonstrating the contribution of SOM particulate in deeper layers. In the specific case of the 0-2.5 cm layer from NF, the greater LF-free Csilt concentration com-pared to that of NT is attributable to the POM derived from the forest litter.
The higher values of Cclay compared to those ob-served for the LF-free silt fraction are attributable to the greater surface area available for the organo-mineral in-teractions in the clay fraction. Regarding the two man-agement systems, Cclay and mineral-associated silt SOM (LF-free Csilt) under NT management were greater than that under CT management up to a depth of 2.5 cm (Ta-ble 2).
Carbon concentration in the sand fraction (Csand) of the Humic Hapludox was greater than the Csilt at all depths under NF that were analyzed (Table 2), indicat-ing that throughout this long period of undisturbed land use, the POM (that occurs in the sand fraction) had also accumulated in deeper layers. Under NT management, the Csand was greater than the Csilt up to a depth of 10 cm,
Table 2 − Carbon concentration of soil, carbon concentration and Cfraction/Csoil ratio in the fractions clay, silt, silt free of light fraction soil organic matter (SOM) and sand in Humic Hapludox under native forest (NF), no-tillage (NT) and conventional tillage (CT).
System Depth Csoil Clay Silt LF-free silt
a Sand
C Cclay/Csoil C Csilt/Csoil C CLF-free silt/Csoil C Csand/Csoil
cm g kgsoil
−1 g kg
fraction
−1 % g kg
fraction
−1 % g kg
fraction
−1 % g kg
fraction
−1 %
NF 0 - 2.5 102.4 60.3 34 76.3 19 46.9b 8b 191.4 (25.2) 47
2.5 - 5 56.9 55.5 46 42.0 23 27.5 11 62.5 32
5 - 10 45.9 49.2 57 31.2 18 23.6 13 58.2 25
10 - 20 39.9 42.6 44 22.6 16 17.5 12 52.6 40
40 - 60 23.2 29.7 54 11.6 16 9.2 13 34.2 30
80 - 100 26.1 24.4 61 5.3 15 4.7 6 17.3 34
NT 0 - 2.5 58.5 a 56.3 a 39 a 51.0 a 25 a 41.9 19 69.3 a 37 a
2.5 - 5 56.8 a 57.0 a 42 b 47.8 a 26 a 41.6 21 61.3 a 41 a
5 - 10 45.7 a 50.9 a 50 a 38.6 a 25 a 33.6 22 46.1 a 32 a
10 - 20 40.4 a 44.3 a 52 a 31.2 a 19 a 27.8 17 41.7 a 29 a
40 - 60 25.4 a 30.4 a 48 a 23.2 a 16 a 18.4 15 22.6 a 36 a
80 - 100 18.3 a 18.9 a 41 a 11.7 a 10 a 8.7 10 32.2 a 48 a
CT 0 - 2.5 38.6 b 45.0 a 57 a 34.2 b 23 a 29.8 20 27.2 b 28 b
2.5 - 5 40.0 b 44.4 b 49 a 34.2 b 22 a 30.4 19 38.0 b 29 b
5 - 10 39.3 a 45.1 a 50 a 33.8 a 23 a 29.1 19 35.8 b 27 a
10 - 20 38.6 a 44.4 a 51 a 33.7 a 21 a 29.1 18 34.1 a 28 a
40 - 60 22.3 a 31.0 a 60 a 19.4 b 11 b 17.1 10 19.7 a 30 a
80 - 100 9.3 b 10.4 b 50 a 4.5 b 14 a 3.6 9 10.3 a 45 a
while under CT management, no difference in C concen-tration between the two fractions was observed (Table 2). This contrasting behavior between the soil manage-ment systems highlights the surface and sub-surface accumulation of POM under NT management after 25 years, due to the lack of revolvement of the soil at the ploughing depth of 20 cm.
Rhodic Hapludox had a different behavior regard-ing the C concentration in the fractions among the land uses. Under NF, the Csilt was greater than the Cclay only in the first 2.5 cm, and this difference faded after the removal of the LF fraction from the silt (Table 3). The Csand values were greater than in the other fractions up to a depth of 5 cm under NF and in the 2.5-5 cm layer under NT and CT managements. At layers deeper than 5 cm, the Csand values were smaller than those of the Cclay and Csilt, indicating that in contrast to the Humic Hapludox, no accumulation of light-free SOM along the profile occurred in this soil. The greater precipitation in the region of Guarapuava (Table 1) compared to the Santo Ângelo region may promote the translocation of light-free SOM through deeper layers. Additionally, in the Rhodic Hapludox under NT and CT managements, the LF-free Csilt tended to surpass the Cclay up to depths of 2.5 cm and 5 cm, respectively, showing unexpected behavior considering the greater surface area of the clay fraction. From 20 cm downwards, the opposite trend was observed (Table 3).
In general, in the Humic Hapludox, the propor-tions of Cclay/Csoil, LF-freeCsilt/Csoil and Csand/Csoil varied
from 30 to 60 %, 6 to 22 % and 25 to 48 %, respectively (Table 2). In the Rhodic Hapludox, the proportion of Cclay/Csoil was greater (34 to 78 %) than that in the Hu-mic Hapludox and increased steadily with depth (Table 3). The LF-free Csilt/Csoil and Csand/Csoil proportions in the Rhodic Hapludox were always smaller than Cclay/Csoil.
Predicted capacity of carbon retention and carbon saturation deficit in silt and clay fractions
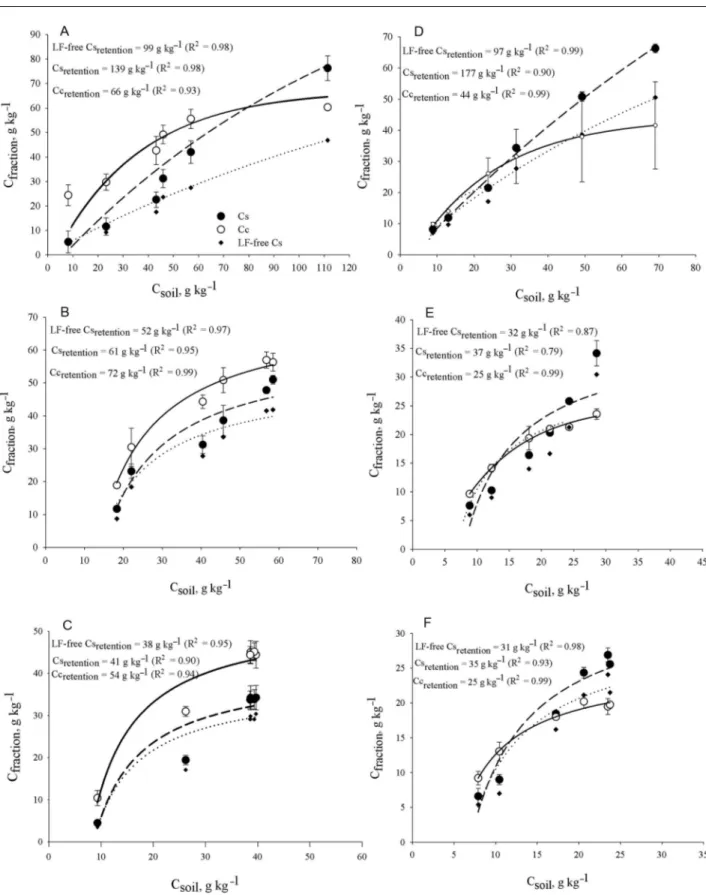
The determination coefficients obtained for the re-lationship between the Cfraction and Csoil (Figure 1) varied between 0.93 to 0.99 for the clay fraction, 0.79 to 0.95 for the silt fraction and 0.87 to 0.99 for the LF-free silt fraction. In general, the curves obtained from the experi-mental data tended to a saturation plateau for the agricul-tural uses, while under NF, the curves for the clay and silt fractions presented a steady increase. Although some curves showed also a linear relationship (NF curves and Figures 1c and 1e), for the following discussion of the pre-dicted capacity of maximum C retention, the parameters obtained from either exponential or inverse first order polynomial fitting will be used. In this way we assume that all fractions will present a C saturation level.
In the Humic Hapludox, the predicted capacity for the maximum C retention (Cretention) in the clay frac-tion, estimated from the mathematical model applied, varied from 54 to 72 g kg−1 and increased in the order CT<NF<NT (Figure 1). Under NF, the maximum C
re-tention for the silt fraction was greater than that for the clay fraction; this trend remained even after the removal
Table 3− Carbon concentration of soil, carbon concentration and Cfraction/Csoil ratio in the fractions clay, silt, silt free of light fraction soil organic matter (SOM) and sand in Rhodic Hapludox under native forest (NF), no-tillage (NT) and conventional tillage (CT).
System Depth Csoil Clay Silt LF-free silt
a Sand
C Cclay/Csoil C Csilt/Csoil C CLF-free silt/Csoil C Csand/Csoil
cm g kgsoil−1 g kg fraction
−1 % g kg
fraction
−1 % g kg
fraction
−1 % g kg
fraction
−1 %
NF 0 - 2.5 71.4 41.6 34 66.3 30 50.6b 20b 198.2 36
2.5 - 5 47.9 37.9 46 50.8 31 38.5 23 104.4 24
5 - 10 32.0 31.6 58 34.3 30 27.7 23 24.1 12
10 - 20 22.7 26.1 68 21.5 27 17.1 22 14.9 5
40 - 60 12.1 14.0 76 11.9 22 9.7 19 6.0 2
80 - 100 8.2 9.9 76 8.2 22 6.9 20 3.5 5
NT 0 - 2.5 30.0 a 23.6 a 43 a 34.2 a 36 a 30.5 30 32.6 a 22 b
2.5 - 5 24.5 a 21.3 a 50 a 25.8 a 31 a 21.3 25 34.0 a 19 a
5 - 10 20.2 a 21.0 a 57 a 20.3 b 28 a 16.7 24 26.4 a 15 a
10 - 20 17.4 a 19.4 a 65 a 16.4 a 26 a 13.7 22 12.3 a 15 a
40 - 60 11.8 a 14.2 a 78 a 10.3 a 20 a 8.7 18 6.2 a 4 a
80 - 100 8.4 a 9.7 a 76 a 7.6 a 18 a 5.7 14 12.2 a 13 a
CT 0 - 2.5 23.1 b 19.5 b 40 a 26.9 b 34 a 24.1 30 27.5 a 26 a
2.5 - 5 22.1 a 19.8 a 46 a 25.6 a 33 a 21.5 29 34.8 a 22 a
5 - 10 20.9 a 20.2 a 56 a 24.4 a 35 a 21.1 30 13.7 a 9 b
10 - 20 17.1 a 18.0 a 60 a 18.5 a 31 a 16.2 27 16.0 a 13 a
40 - 60 10.9 a 13.1 a 77 a 9.0 a 21 a 6.4 14 7.1 a 10 a
80 - 100 7.5 a 9.2 a 76 a 6.6 a 16 a 5.4 13 7.0 b 14 a
of the LF fraction (Figure 1). For agricultural uses, the maximum Cretention for the clay fraction was greater than that for the silt and for the LF-free silt, as expected. However, the value of the maximum Cretention obtained for a given C fraction under NT management was always greater than that found for the respective fraction under CT management in this soil. Because the density of the mineral sorptive sites of a given fraction depends on its mineralogy and not on the management system, similar values for the Cretention for a given fraction were expected, regardless of the soil use.
The Cretention obtained for the C fractions under NF of the Rhodic Hapludox decreased in the order LF-free silt>silt>clay (Figure 1), showing the same trend ob-served for the NF of the Humic Hapludox. However, in contrast to the soil from Guarapuava, the Cretention for the C fractions under agricultural use had the same trend as under NF, and no difference was observed between management systems (Figure 1).
Two mechanisms of SOM stabilization can be pro-posed, based on the following results: the greater C
reten-tion values found for the NF systems compared to their respective agricultural use, the greater Cretention values found for the C fractions under NT management com-pared to those under CT management for the Humic Hapludox, and the higher capacity of LF-free silt in re-taining SOM than the clay fraction under NF and under NT and CT managements in the Rhodic Hapludox. It seems that the accumulation of C in a given fraction is not solely governed by a surface phenomenon; i.e., it does not only depend on the available sorptive sites and their affinity for the SOM. Most likely a mechanism of self assemblage, as proposed by Kleber et al. (2007), con-tributes to the retention of C in the fractions of the two soils studied. In that model, three zones for the SOM are proposed. In the first zone, the SOM is directly sorbed on the mineral surface via its hydrophilic groups. In the second zone, the hydrophobic groups of the sorbed SOM constitute a new sorbing surface for the rest of the SOM via hydrophobic and hydrophilic groups, resulting in a self-assemblage of the SOM. The third zone, located at the most external part of this organo-mineral assem-blage, is called the kinetic zone and interacts with cat-ions via hydrophilic groups.
Our hypothesis is that in the two soils under NF management, the long period of non-disturbance of the soil enables the establishment of such interactions, which seems to contribute mainly to the retention of C in the silt fraction regardless of the mineralogy, as in-dicated by the similarity of the Cretention obtained for the LF-free silt in the two soils (Figure 1). In the Humic Hap-ludox under NT management, the lack of disturbance of the soil also favors the retention of the SOM organized in self-assemblage, resulting in a greater value of Cretention in the silt and clay fractions under NT management com-pared to CT management. Conversely, the climatic con-ditions in the Rhodic Hapludox (i.e., the dryer and hotter summer) would enhance the oxidation of the SOM and
the formation of hydrophobic bonds would not be fa-vored; therefore, this mechanism would be less relevant than in the Guarapuava soil.
All maximum Cretention values for the C fractions under agricultural use obtained for the Rhodic Haplu-dox were always smaller than those calculated for the Humic Hapludox, indicating that the available surface for the organo-mineral interactions in the latter has a higher affinity for the sorption of the SOM. As discussed earlier, the higher content of goethite and the presence of gibbsite in the Humic Hapludox should probably ac-count for this result.
The effect of soil use and management on the dis-tribution of the light-free SOM in the silt fraction seems not to be affected by the soil type. In both soils, the con-tribution of the light SOM fraction to the Csilt was ap-proximately 40 to 50 % under NF, 20 % under NT and 10 % under CT managements.
Values of C saturation deficit (Csd), calculated as C concentration, were obtained for the NF environments and ranged from 2.8 to 38 g kg−1 in the clay fraction and from 45 to 89 g kg−1 in the LF-free silt fraction and did not differ between the two soils (Tables 4 and 5). A dif-ferent situation occurred with the agricultural systems. In the Humic Hapludox, Csd varied from 10 to 52 g kg−1 in the clay fraction and from 8 to 38 g kg−1 in the LF-free silt fraction, whereas for the Rhodic Hapludox, the range was narrower: 1.8 to 16 g kg−1 in the clay fraction and 8 to 27 g kg−1 in the LF-free silt fraction (Table 5). The values obtained for the Rhodic Hapludox are in the range of that estimated for French agricultural soils with similar clay + silt content, which reached up to approxi-mately 30 g kg−1 (Angers et al., 2011). In Brazilian soils, values such as 32 g C kgclay−1 and 48 g C kg
clay
−1 for C
saturation deficit were found for a Rhodic Hapludox and a Red Acrisol, respectively (Diekow et al., 2005; Roscoe et al., 2001).
of the management systems in relation to the difference between the existent C stock under NF and under NT or CT management systems for both fractions.
In the Humic Hapludox, the introduction of NT management after 28 years of agricultural use increased the Csd by approximately 13.2 Mg ha−1 in the clay frac-tion at depths from 0 to 100 cm, while in the LF-free silt fraction, it decreased by approximately 13.5 Mg ha−1. For the clay fraction, the negative values obtained for the 5 to 40 cm layers and the negative values obtained for LF-free silt indicate that these two fractions are stor-ing more C than under NF management. Because the mineralogy is the same at both sites, one possible expla-nation for this result is the SOM stabilization via an SOM self-assemblage mechanism, where the SOM structures are sorbed on the already-sorbed SOM by organo-organo interactions. The LF-free silt fraction from the Humic Hapludox may represent an important fraction for the
C storage. Under CT management, the Csd for the whole profile was much smaller in the clay fraction (4.9 Mg ha−1) than under NT management, and a negative value in the LF-free silt fraction was also observed (Table 4).
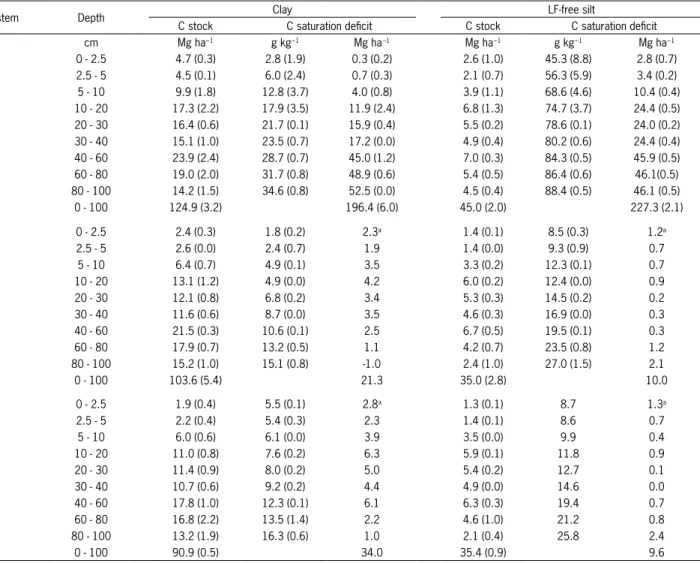
A different behavior was observed for the Rhodic Hapludox profile, where the Csd was positive and var-ied from 21.3 to 34.0 Mg ha−1 in the clay fractions and did not differ in the silt fraction (Table 5). The clay frac-tion under CT management has a higher potential for further storing labile C than under NT management or than the LF-free silt fraction. For the Humic Hapludox, this behavior was observed in the clay fraction under NT management.
The calculated resistance index was 0.78 for the whole soil (data not shown) in the 0-20 cm layer (plough-ing layer) of the Humic Hapludox. In this layer, the re-sistance indexes were 0.87 for the clay fraction and 1.09 for the LF-free silt fraction. The latter value, greater than
Table 4− Carbon stock and carbon saturation deficit in clay and LF-free silt fractions of a Humic Hapludox under native forest (NF), no-tillage (NT) and conventional tillage (CT) (values in parentheses refer to the standard deviation).
System Depth Clay LF-free silt
C stock C saturation deficit C stock C saturation deficit
Cm Mg ha−1 g kg−1 Mg ha−1 Mg ha−1 g kg−1 Mg ha−1
NF 0 - 2.5 5.3 (1.1) 4.8 (1.9) 0.4 (0.2) 1.6 (0.1) 53.0 (5.2) 2.0 (0.5)
2.5 – 5 5.2 (0.4) 13.9 (1.0) 1.4 (0.2) 1.6 (0.3) 69.7 (1.1) 3.7 (0.9) 5 – 10 10.1 (0.9) 18.5 (1.9) 3.9 (0.9) 2.6 (0.1) 74.6 (1.9) 8.1 (1.0) 10 – 20 15.6 (1.9) 21.6 (3.2) 7.8 (2.6) 5.2 (0.7) 77.4 (2.7) 19.0 (4.1) 20 – 30 14.7 (1.5) 25.6 (5.3) 9.4 (2.4) 4.6 (0.6) 80.5 (3.9) 20.6 (3.2) 30 – 40 13.3 (1.4) 29.4 (5.4) 10.8 (2.6) 3.9 (0.6) 83.3 (3.6) 21.3 (3.2) 40 – 60 25.3 (4.5) 33.0 (5.9) 25.6 (5.9) 7.0 (1.0) 85.7 (3.6) 46.6 (8.9) 60 – 80 21.5 (6.7) 38.3 (9.0) 30.0 (7.9) 5.0 (1.4) 86.0 (1.9) 38.8 (4.7) 80 – 100 17.5 (6.7) 45.1 (9.2) 38.4 (10.1) 3.7 (1.1) 79.6 (13.5) 35.2 (7.2)
0 – 100 137.9 (23.3) 127.9 (26.9) 35.3 (3.8) 195.2 (25.2)
NT 0 - 2.5 3.7 (0.4) 16.4 (0.4) 1.6a 1.9 (0.5) 12.1 (0.3) -0.2a
2.5 - 5 4.9 (0.7) 16.9 (1.2) 0.3 2.5 (0.5) 12.5 (0.9) -0.9
5 - 10 9.2 (1.2) 21.1 (1.9) 0.9 4.4 (1.1) 15.6 (1.4) -1.8
10 - 20 19.5 (1.6) 23.8 (0.4) -3.9 7.2 (0.1) 17.6 (0.3) -2.0 20 - 30 15.8 (2.7) 28.2 (2.3) -1.1 6.3 (0.7) 20.8 (2.7) -1.7 30 - 40 14.4 (2.2) 31.9 (3.3) -1.1 5.7 (0.8) 23.6 (2.5) -1.8 40 - 60 20.9 (3.1) 43.5 (1.8) 4.4 7.8 (2.0) 26.6 (6.5) -0.9 60 - 80 21.9 (3.3) 40.0 (0.8) -0.4 8.1 (2.1) 28.8 (0.8) -3.0 80 - 100 14.3 (0.8) 52.4 (1.7) 3.2 4.9 (1.0) 38.1 (1.1) -1.3
0 - 100 124.7 (13.6) 13.2 50.7 -13.5
CT 0 - 2.5 3.5 (0.6) 10.8 (0.8) 1.9a 1.3 (0.1) 8.2 (0.6) 0.4a
2.5 - 5 4.1 (0.9) 10.5 (1.0) 1.1 1.6 (0.1) 8.0 (0.8) -0.1
5 - 10 7.7 (0.7) 10.6 (0.6) 2.4 3.1 (0.2) 8.1 (0.5) -0.5
10 - 20 16.3 (1.8) 10.8 (0.7) -0.7 6.0 (0.4) 8.2 (0.6) -0.8 20 - 30 16.7 (1.8) 11.9 (1.2) -2.0 5.6 (1.0) 9.1 (0.9) -1.0 30 - 40 14.8 (3.0) 16.8 (4.8) -1.5 4.8 (0.8) 10.7 (0.0) -0.9 40 - 60 28.9 (8.9) 20.2 (7.5) -3.6 5.4 (0.8) 12.1 (1.0) 1.6 60 - 80 27.2 (3.4) 18.6 (0.7) -5.7 7.2 (2.7) 14.2 (0.8) -2.2 80 - 100 13.8 (6.8) 35.4 (4.7) 3.3 3.6 (1.5) 33.4 (5.4) 0.1
0 - 100 132.9 (24.1) 4.9 38.8 (3.1) -3.4
aCarbon saturation deficit calculated from the difference between the carbon stock in each physical fraction under native forest (NF) and under management systems
the unity, indicates clearly that CT management did not affect the carbon storage in this fraction. However, the resistance index in the whole soil, lower than in the clay and LF-free silt indicates that the effect of CT manage-ment in reducing C storage occurred mainly in the par-ticulate organic matter. In the Rhodic Hapludox, the re-sistance indexes in the 0-20 cm depths obtained for the whole soil (0.60) and fractions (0.58 for clay and 0.79 for LF-free silt) were smaller than the unity and lower than the values calculated for the Humic Hapludox. These results confirm that this soil is less resistant to the im-pact of CT management in comparison to the Humic Hapludox with respect to C storage, as already discussed regarding the C concentration. Furthermore, they show that the mineral-associated SOM is strongly affected by the change of land use in the Rhodic Hapludox.
The resilience index calculated was 0.63 in the 0-20 cm layer of the whole Humic Hapludox. In the clay
fraction of the first 20 cm of this soil, the resilience dex (1.26) greater than the unity indicates that the in-crease in the C stock resulting from the introduction of NT management surpassed the amount of C lost by the previous CT management. The C stock in LF-free silt in the 0-20 cm layer was greater under CT than under NT management (data not shown), resulting in a nega-tive value for the resilience index (-3.90) and confirming the value as >1.00 obtained for the resistance index. For the Rhodic Hapludox, the values for the resilience in-dexes for the whole soil (0.11), clay fraction (0.11) and LF-free silt (-0.03) suggest a low capacity for C recovery in the whole soil and fractions. These results, compared to those obtained for the Humic Hapludox, indicate that the latter is highly resilient; this fact may be due to the reactivity of the mineral surface and climatic conditions, both favorable for C sequestration in the Guarapuava region.
Table 5− Carbon stock and carbon saturation deficit in clay and LF-free silt fractions of a Rhodic Hapludox under native forest (NF), no-tillage (NT) and conventional tillage (CT) (values in parentheses refer to the standard deviation).
System Depth Clay LF-free silt
C stock C saturation deficit C stock C saturation deficit
cm Mg ha−1 g kg−1 Mg ha−1 Mg ha−1 g kg−1 Mg ha−1
NF 0 - 2.5 4.7 (0.3) 2.8 (1.9) 0.3 (0.2) 2.6 (1.0) 45.3 (8.8) 2.8 (0.7)
2.5 - 5 4.5 (0.1) 6.0 (2.4) 0.7 (0.3) 2.1 (0.7) 56.3 (5.9) 3.4 (0.2) 5 - 10 9.9 (1.8) 12.8 (3.7) 4.0 (0.8) 3.9 (1.1) 68.6 (4.6) 10.4 (0.4) 10 - 20 17.3 (2.2) 17.9 (3.5) 11.9 (2.4) 6.8 (1.3) 74.7 (3.7) 24.4 (0.5) 20 - 30 16.4 (0.6) 21.7 (0.1) 15.9 (0.4) 5.5 (0.2) 78.6 (0.1) 24.0 (0.2) 30 - 40 15.1 (1.0) 23.5 (0.7) 17.2 (0.0) 4.9 (0.4) 80.2 (0.6) 24.4 (0.4) 40 - 60 23.9 (2.4) 28.7 (0.7) 45.0 (1.2) 7.0 (0.3) 84.3 (0.5) 45.9 (0.5) 60 - 80 19.0 (2.0) 31.7 (0.8) 48.9 (0.6) 5.4 (0.5) 86.4 (0.6) 46.1(0.5) 80 - 100 14.2 (1.5) 34.6 (0.8) 52.5 (0.0) 4.5 (0.4) 88.4 (0.5) 46.1 (0.5)
0 - 100 124.9 (3.2) 196.4 (6.0) 45.0 (2.0) 227.3 (2.1)
NT 0 - 2.5 2.4 (0.3) 1.8 (0.2) 2.3a 1.4 (0.1) 8.5 (0.3) 1.2a
2.5 - 5 2.6 (0.0) 2.4 (0.7) 1.9 1.4 (0.0) 9.3 (0.9) 0.7
5 - 10 6.4 (0.7) 4.9 (0.1) 3.5 3.3 (0.2) 12.3 (0.1) 0.7
10 - 20 13.1 (1.2) 4.9 (0.0) 4.2 6.0 (0.2) 12.4 (0.0) 0.9
20 - 30 12.1 (0.8) 6.8 (0.2) 3.4 5.3 (0.3) 14.5 (0.2) 0.2
30 - 40 11.6 (0.6) 8.7 (0.0) 3.5 4.6 (0.3) 16.9 (0.0) 0.3
40 - 60 21.5 (0.3) 10.6 (0.1) 2.5 6.7 (0.5) 19.5 (0.1) 0.3
60 - 80 17.9 (0.7) 13.2 (0.5) 1.1 4.2 (0.7) 23.5 (0.8) 1.2
80 - 100 15.2 (1.0) 15.1 (0.8) -1.0 2.4 (1.0) 27.0 (1.5) 2.1
0 - 100 103.6 (5.4) 21.3 35.0 (2.8) 10.0
CT 0 - 2.5 1.9 (0.4) 5.5 (0.1) 2.8a 1.3 (0.1) 8.7 1.3a
2.5 - 5 2.2 (0.4) 5.4 (0.3) 2.3 1.4 (0.1) 8.6 0.7
5 - 10 6.0 (0.6) 6.1 (0.0) 3.9 3.5 (0.0) 9.9 0.4
10 - 20 11.0 (0.8) 7.6 (0.2) 6.3 5.9 (0.1) 11.8 0.9
20 - 30 11.4 (0.9) 8.0 (0.2) 5.0 5.4 (0.2) 12.7 0.1
30 - 40 10.7 (0.6) 9.2 (0.2) 4.4 4.9 (0.0) 14.6 0.0
40 - 60 17.8 (1.0) 12.3 (0.1) 6.1 6.3 (0.3) 19.4 0.7
60 - 80 16.8 (2.2) 13.5 (1.4) 2.2 4.6 (1.0) 21.2 0.8
80 - 100 13.2 (1.9) 16.3 (0.6) 1.0 2.1 (0.4) 25.8 2.4
0 - 100 90.9 (0.5) 34.0 35.4 (0.9) 9.6
aCarbon saturation deficit calculated from the difference between the carbon stock in each physical fraction under native forest (NF) and under management systems
Conclusions
The NT system promotes the increase of C reten-tion capacity in comparison to that under CT in the Hu-mic Hapludox. In contrast, the Rhodic Hapludox showed no difference in C retention capacity under both man-agement systems.
Possibly it is the cooler climate that slows down the residue mineralization and thus enables the stabili-zation of SOM through sorption mechanisms in the Hu-mic Hapludox leading to the higher capacity of physical fractions under NT to retain C by organo-mineral inter-actions and organo-organo associations. In the Rhodic Hapludox, no difference in C retention capacity in the physical fractions regarding the management system was observed possibly due to the faster mineralization of SOM promoted by the higher temperatures in this re-gion.
The greater C retention capacity of a given physical fraction of the Humic Hapludox might be explained by the predominance of goethite and gibbsite, which have a higher density of sorption sites for SOM in comparison to the Rhodic Hapludox which is composed mainly by hematite and kaolinite.
Acknowledgements
To the Coordination for the Improvement of High-er Level PHigh-ersonnel (CAPES), the Research Support Foun-dation of the State of Rio Grande do Sul (FAPERGS) and the Brazilian National Council for Scientific and Techno-logical Development (CNPq).
References
Angers, D.A.; Arrouays, D.; Saby, N.P.A.; Walter, C. 2011. Estimating and mapping the carbon saturation deficit of French agricultural topsoils. Soil Use and Management 27: 448-452.
Boddey, R.M.; Jantalia, C.P.; Conceição, P.C.; Zanatta, J.A.; Bayer, C.; Mielniczuk, J.; Dieckow, J.; Santos, H.P.; Denardin, J.E.; Aita, C.; Giacomini, S.J.; Alves, B.J.R.; Urquiaga, S. 2010. Carbon accumulation at depth in Ferralsols under zero-till subtropical agriculture. Global Change Biology 16: 784-795. Campos, B.H.C.; Amado, T.J.C.; Bayer, C.; Nicoloso, R.S.;
Fiorin, J.E. 2011. Carbon stocks and its compartiments in a subtropical oxisol under long-term tillage and a crop rotation systems. Revista Brasileira de Ciência do Solo 35: 805-817. Carrington, E.M.; Hernes, P.J.; Dyda, R.Y.; Plante, A.F.; Six,
J. 2012. Biochemical changes across a carbon saturation gradient: lignin, cutin, and suberin decomposition and stabilization in fractionated carbon fractions. Soil Biology and Biochemistry 47: 179-190.
Costa, F.S.; Albuquerque, J.A.; Bayer, C.; Fontoura, S.M.V.; Wobeto, C. 2003. Physical properties of a south Brazilian Oxisol as affected by no-tillage and conventional tillage. Revista Brasileira de Ciência do Solo 27: 527-535 (in Portuguese, with abstract in English).
Costa, F.S.; Bayer, C.; Albuquerque, J.A.; Fontoura, S.M.V. 2004. No-tillage increases soil organic matter in a south Brazilian Oxisol. Ciência Rural 34: 587-589 (in Portuguese, with abstract in English).
Dieckow, J.; Bayer, C.; Conceição, P.C.; Zanatta, J.A.; Martin-Neto, L.; Milori, D.M.B.P.; Salton, J.C.; Macedo, M.M.; Mielniczuk, J.; Hernani, L.C. 2009. Land use, tillage, texture and organic matter stock and composition in tropical and subtropical Brazilian soils. European Journal of Soil Science 60: 240-249. Diekow, J.; Mielniczuk, J.; Knicker, H.; Bayer, C.; Dick, D.P.;
Kögel-Knabner, I. 2005. Carbon and nitrogen stocks in physical fractions of a subtropical Acrisol as influenced by long-term no-till cropping systems and N fertilization. Plant and Soil 268: 319-328.
Ellert, B.H.; Bettany, J.R. 1995. Calculation of organic matter and nutrients stored in soils under contrasting management regimes. Canadian Journal of Soil Science 75: 529-538.
Inda Junior, A.V.; Bayer, C.; Conceição, P.C.; Boeni, M.; Salton, J.C.; Tonin, A.T. 2007. Selected soil-variables related to the stability of organo-minerals complexes in tropical and subtropical Brazilian soils. Ciência Rural 37: 1301-1307 (in Portuguese, with abstract in English).
Jagadamma, S.; Lal, R. 2010. Distribution of soil carbon in physical fractions of soils as affected by agricultural management. Biology and Fertility of Soils 46: 543-554.
Kaiser, K.; Guggenberger, G. 2000. The role of DOM sorption to mineral surfaces in the preservation of organic matter in soils. Organic Geochemistry 31: 711-725.
Kleber, M.; Sollins, P.; Sutton, R. 2007. A conceptual model of organo-mineral interactions in soils: self-assembly of organic molecular fragments into zonal structures on mineral surfaces. Biogeochemistry 85: 9-24.
Potes, M.L.; Dick, D.P.; Santana, G.S.; Tomazi, M.; Bayer, C. 2012. Soil organic matter in fire-affected pastures and in an Araucaria forest in south-Brazilian Leptosols. Pesquisa Agropecuária Brasileira 47: 707-715 (in Portuguese, with abstract in English).
Roscoe, R.; Buurman, P.; Velthorst, E.J.; Vasconcellos, C.A. 2001. Soil organic matter dynamics in density and particle-size fractions as revealed by the 13C/12C isotopic ratio in a Cerrado’s
Oxisol. Geoderma 104: 185-202.
Schwertmann, U.; Taylor, R.M. 1977. Iron oxides. p. 145-180. In: Dixon, J.B.; Weed, S.B., eds. Minerals in soil environments. Soil Science Society of America, Madison, MI, USA.
Six, J.; Conant, R.T.; Paul, E.A.; Paustian, K. 2002. Stabilization mechanisms of soil organic matter: implications for C saturation of soils. Plant and Soil 241: 155-176.
Soil Survey Staff. 2010. Keys to Soil Taxonomy. 11ed. USDA-NRCS, Washington, DC, USA.
Stewart, C.E.; Paustian, K.; Conant, R.T.; Plante, A.F.; Six, J. 2007. Soil carbon saturation: concept, evidence and evaluation. Biogeochemistry 86: 19-31.
Stewart, C.E.; Paustian, K.; Conant, R.T.; Plante, A.F.; Six, J. 2008. Soil carbon saturation: evaluation and corroboration by long-term incubations. Soil Biology and Biochemistry 40: 1741-1750. Stewart, C.E.; Paustian, K.; Conant, R.T.; Plante, A.F.; Six, J. 2009.