O R I G I N A L A R T I C L E
Towards a new classification of stable phase schizophrenia into
major and simple neuro
‐
cognitive psychosis: Results of
unsupervised machine learning analysis
Buranee Kanchanatawan M.D.
1|
Sira Sriswasdi PhD
2|
Supaksorn Thika MSci
1|
Drozdstoy Stoyanov MD, PhD
3|
Sunee Sirivichayakul PhD
4|
André F. Carvalho MD, PhD
5|
Michel Geffard MD
6,7|
Michael Maes MD, PhD
1,3,81Department of Psychiatry, Faculty of
Medicine, Chulalongkorn University, Bangkok, Thailand
2Research Affairs, Faculty of Medicine,
Chulalongkorn University, Bangkok, Thailand
3Department of Psychiatry, Medical
University of Plovdiv, Plovdiv, Bulgaria
4Faculty of Medicine, Chulalongkorn
University, Bangkok, Thailand
5Department of Clinical Medicine and
Translational Psychiatry Research Group, Faculty of Medicine, Federal University of Ceará, Fortaleza, CE, Brazil
6Research Department, IDRPHT, Talence,
France
7GEMAC, Saint Jean d'Illac, France
8IMPACT Strategic Research Center, Deakin
University, Geelong, Australia
Correspondence
Dr Michael Maes, MD, PhD, IMPACT Strategic Research Center, Barwon Health, Deakin University, Geelong, VIC, Australia. Email: [email protected]
Funding information
Asahi Glass Foundation, Chulalongkorn Uni-versity Centenary Academic Development Project, Grant/Award Number: na
Abstract
Rationale:
Deficit schizophrenia, as defined by the Schedule for Deficit Syndrome,
may represent a distinct diagnostic class defined by neurocognitive impairments
coupled with changes in IgA/IgM responses to tryptophan catabolites (TRYCATs).
Adequate classifications should be based on supervised and unsupervised learning
rather than on consensus criteria.
Methods:
This study used machine learning as means to provide a more accurate
classification of patients with stable phase schizophrenia.
Results:
We found that using negative symptoms as discriminatory variables,
schizophrenia patients may be divided into two distinct classes modelled by (A)
impairments in IgA/IgM responses to noxious and generally more protective
trypto-phan catabolites, (B) impairments in episodic and semantic memory, paired associative
learning and false memory creation, and (C) psychotic, excitation, hostility, mannerism,
negative, and affective symptoms. The first cluster shows increased negative,
psy-chotic, excitation, hostility, mannerism, depression and anxiety symptoms, and more
neuroimmune and cognitive disorders and is therefore called
“
major neurocognitive
psychosis
”
(MNP). The second cluster, called
“
simple neurocognitive psychosis
”
(SNP) is discriminated from normal controls by the same features although the
impair-ments are less well developed than in MNP. The latter is additionally externally
vali-dated by lowered quality of life, body mass (reflecting a leptosome body type), and
education (reflecting lower cognitive reserve).
Conclusions:
Previous distinctions including
“
type 1
”
(positive)/
“
type 2
”
(negative)
and DSM
‐
IV
‐
TR (eg, paranoid) schizophrenia could not be validated using machine
learning techniques. Previous names of the illness, including schizophrenia, are not
very adequate because they do not describe the features of the illness, namely,
inter-related neuroimmune, cognitive, and clinical features. Stable
‐
phase schizophrenia
consists of 2 relevant qualitatively distinct categories or nosological entities with
SNP being a less well
‐
developed phenotype, while MNP is the full blown phenotype
or core illness. Major neurocognitive psychosis and SNP should be added to the DSM
‐
5 and incorporated into the Research Domain Criteria project.
DOI: 10.1111/jep.12945
K E Y W O R D S
chronic fatigue, cytokines, depression, inflammation, neuroimmune, schizophrenia, tryptophan
1
|I N T RO D U C T I O N
Current psychiatric nosologies are heavily debated.1,2One
fundamen-tal problem is the classification of schizophrenia, which has long time
been subject to controversies. A subset of patients with schizophrenia
present with negative symptoms, including affective flattening, alogia,
anhedonia, avolition, and social inhibition. This symptomatic cluster
when present during both psychotic exacerbations and also during
interepisode clinically stable phases is referred to as deficit
schizo-phrenia.3,4This negative symptom cluster, previously conceptualized
within the concept of“dementia praecox,”was defined by Kraepelin
as an early type of “dementia” with memory and attention
impair-ments and deterioration in goal‐directed behaviours.5 Furthermore,
Bleuler described deficit schizophrenia as an organic disorder that is
accompanied by loss of thought processes and associative thought
processes.5
Negative symptoms are currently conceptualized as behaviours
and thought processes, which the individual has partially lost due to
the disorder.6This contrasts with positive symptoms that encompass
delusions, hallucinations, disorganized thinking, and hostile
behav-iours, which are considered to be new behaviours or thought
pro-cesses that were not present before the onset of this illness.6
Consequently, patients with schizophrenia were subdivided according
to the 2‐syndrome concept into those with positive symptoms as
acute or type 1 schizophrenia versus those with negative symptoms
as chronic or type 2 schizophrenia.7
Moreover, in addition to positive and negative symptoms,
individ-uals with schizophrenia exhibit neurocognitive, affective, and
physiosomatic symptoms. Firstly, objective neurocognitive deficits in
schizophrenia comprise impairments in planning, context processing,
working memory, conscious recollection, attention, and visual memory
deficits.8-10 Using the Consortium to Establish a Registry for
Alzheimer Disease (CERAD) and Cambridge Neuropsychological Test
Automated Battery (CANTAB) tests, it was shown that individuals
with deficit schizophrenia have more profound and a broader range
of cognitive impairments than patients with nondeficit forms of the
disorder, including impairments in emotional recognition, semantic
and working memory, sustained attention, and especially in episodic
memory, including recall and recognition.10
Secondly, many individuals with schizophrenia experience clinically
meaningful depression and anxiety symptoms.11Recent research
sug-gests that these mood symptoms are highly significantly associated
with neurocognitive impairments, including executive functions, visual
memory, attention and social cognition, and especially with the
nega-tive symptoms of schizophrenia.11Thirdly, up to 53.7% of patients with
schizophrenia may have increased levels of physiosomatic symptoms,
including subjective cognitive complaints (SCCs), chronic fatigue,
mus-cle pain, irritable bowel, tension, autonomic symptoms, and a flu‐like
malaise.11These symptoms, including SCCs, fatigue, and a flu‐like
mal-aise appear to aggregate with neurocognitive impairments, including
executive functions, sustained attention, paired association learning,
spatial planning, working memory, attention set shifting and emotional
recognition, and with mood but not the negative or positive symptoms
of schizophrenia.11
Accumulating evidence indicates that peripheral and central
immune aberrations significantly contribute to the development of
schizophrenia.12,13Thus, acute schizophrenia and first‐episode
psycho-sis are characterized by immune activation, including T helper (Th)‐1,
Th‐2, and T regulatory responses and a mild chronic inflammatory
pro-cess with M1 macrophagic activation, increased complement factors
and acute phase proteins and elevated interleukin‐6 trans‐signalling,
coupled with increased neuro‐oxidative pathways.12-14 Chronic
schizophrenia is also characterized by signs of immune activation and
neuro‐oxidative stress as indicated by elevated levels of macrophage
inflammatory protein, eotaxin, soluble tumour necrosis factor (TNF)
receptor p60/p80 (TNFR1 and TNFR2), and protein carbonyls.12-15
Th‐1 and M1 cytokines and oxidative stress may activate indoleamine
2,3‐dioxygenase driving tryptophan to increased synthesis of
trypto-phan catabolites (TRYCATs) some of which have neurotoxic,
excitotoxic, neuroimmune, neuro‐oxidative, and neuro‐nitrosative
effects.10,11We detected that deficit schizophrenia is accompanied
by very specific changes in IgA and IgM‐mediated responses directed
to TRYCATs.10Thus, deficit schizophrenia is accompanied by increased
IgA‐mediated immune responses directed to noxious TRYCATs,
including picolinic acid (PA), xanthurenic acid (XA), quinolinic acid
(QA), and 3‐hydroxykynurenin (3HK), and decreased IgM responses to
the same TRYCATs, indicating increased production and lowered
regu-lation of those TRYCATs.10 Importantly, negative, mood, and
physiosomatic symptoms, including SCCs, as well as objective cognitive
deficits as measured with CERAD and CANTAB, were significantly
associated with changes in IgA/IgM responses to TRYCATs, suggesting
that elevations in noxious TRYCATs or the antecedents of TRYCAT
pathway stimulation could specifically contribute to the development
of these specific psychopathological manifestations.10,11
Using supervised pattern recognition methods, including soft
independent modelling of class analogy (SIMCA), we found that deficit
schizophrenia is a qualitatively distinct class or nosological entity
modelled and defined by neuroimmune (IgA/IgM responses directed
to TRYCATs) and cognitive (episodic and semantic memory) features
coupled or not with negative symptoms.16While these findings
pro-vide further support to the notion that schizophrenia is not an unitary
disorder,3,17the status of nondeficit schizophrenia was not clear as it
showed a large overlap not only with healthy controls but also with
deficit patients. In this respect, Braff et al18ascertained that also latent
class and genetic studies support the deficit subtype of schizophrenia,
but that the DSM‐5 classification would not be enhanced by adding
this subtype without a valid definition of the nondeficit subtype.
Thus, the aims of the present study are to refine the criteria for
“deficit schizophrenia”and identify new phenotypic features
strategies: data computation and translation from neuroscience to
clinical psychopathology. Towards this end, we used unsupervised
pattern recognition methods, including clustering analysis and t‐SNE,
with the aim to detect categories in the data set of negative
symp-toms.16,19,20The cluster‐analytically generated classes were externally
validated against neuroimmune (TRYCAT pathway), cognitive
(CANTAB and CERAD), and clinical features that were not used to
generate the clusters.19,20 In addition, we used body mass index
(BMI) as another external validator as there is a significant association
between dementia praecox and leptosome built.21
2
|S U B J E C T S A ND M E T H O D S
2.1
|Participants
This is a cross‐sectional study recruiting patients with schizophrenia
and apparently healthy controls, namely, Thai nationals, ages 18 to
65 years and of both sexes. The schizophrenia patients were
consec-utively admitted at the outpatient clinic of the Department of
Psychi-atry, Faculty of Medicine, Chulalongkorn University, Bangkok,
Thailand. We recruited schizophrenia patients diagnosed according
to DSM‐IV‐TR criteria22 who were in a stable phase of illness as
defined by the absence of acute episodes for at least 1 year. DSM‐
IV‐TR diagnoses were made using Mini International Neuropsychiatric
Interview in a validated Thai translation.23The patients were divided
into those with deficit and nondeficit schizophrenia based on the
Schedule for the Deficit Syndrome (SDS).4The point criterion used
to make the diagnosis of deficit schizophrenia was the presence of 2
or more negative symptoms for the preceding year. These negative
symptoms comprise a diminished sense of purpose, curbing of
inter-est, diminished social drive, diminished emotional range, poverty of
speech, and restricted affect. Controls were recruited by word of
mouth and belonged to the same catchment area as the patients,
namely, the province Bangkok, Thailand.
We excluded patients with schizophrenia with other axis‐1 DSM‐
IV‐TR psychiatric disorders, such as major depression, bipolar
disor-der, schizoaffective disordisor-der, and substance use disorders. Also,
patients who presented acute exacerbations the year previous to
admission were excluded as were patients who presented with deficit
schizophrenia secondary to other conditions, including antipsychotic
drug‐induced extrapyramidal side effects. Healthy controls were
excluded when they had any axis‐1 DSM‐IV‐TR diagnosis or a
posi-tive family history (first degree) of major psychoses. We excluded
controls and patients with systemic immune and autoimmune
disor-ders, including chronic obstructive pulmonary disease, inflammatory
bowel disease, diabetes type 1 and 2, rheumatoid arthritis and
psori-asis, and neuroinflammatory illness, including multiple sclerosis,
stroke, and Parkinson disease. We also excluded patients and controls
who were taken immunomodulatory drugs and herbal, antioxidant, or
ω3‐polyunsaturated fatty acids supplements. After applying the
abovementioned inclusion and exclusion criteria, we recruited 40
healthy controls, 40 individuals with deficit, and 40 with nondeficit
schizophrenia. All controls and schizophrenia patients as well as the
guardians of patients, namely, their parents or other close family
members, gave written informed consent prior to participation in this
study. The study was conducted according to Thai and international
ethics and privacy laws. Approval for the study was obtained from
the Institutional Review Board of the Faculty of Medicine,
Chulalongkorn University, Bangkok, Thailand, which is in compliance
with the International Guideline for Human Research protection as
required by the Declaration of Helsinki, The Belmont Report, CIOMS
Guideline, and International Conference on Harmonization in Good
Clinical Practice.
2.2
|Methods
2.2.1
|Assessments
Both healthy controls and schizophrenia patients underwent a
semistructured interview, which was conducted by the principal
investigator of the study, a senior psychiatrist (B.K.). This interview
comprised sociodemographic data, lifetime history of psychiatric
and medical disorders, family history of psychiatric disorders, the
Mini International Neuropsychiatric Interview, and different rating
scales to measure severity of negative, positive, mood, and
physiosomatic symptoms. To measure negative symptoms, we
scored the SDS4 and the Scale for the Assessment of Negative
Symptoms (SANS).24 To measure positive, negative, general, mood,
and physio‐somatic symptoms, we scored the Positive and Negative
Syndrome Scale (PANSS),25 the Brief Psychiatric Rating Scale
(BPRS),26 the Fibromyalgia and Chronic Fatigue Syndrome Rating
Scale,27 the Hamilton Depression Rating Scale, and the Hamilton
Anxiety Rating Scale.28,29The diagnosis of nicotine dependence or
tobacco use disorder was made using DSM‐IV‐TR criteria. The same
day as the interviews, we measured body height (in meter) and
weight (in kg) and computed the BMI as weight (kg)/height (meter2).
In addition, we computed z unit‐weighted composite scores
reflecting severity of different symptomatic dimensions11(see Data
S1). Health‐related quality of life was measured using the World
Health Organization Quality of Life Instrument‐abbreviated
ver-sion.30 We also used the EQ‐5D to measure self‐care and usual
activities.31 The same day as the semistructured interview, a well‐
trained research assistant (S.T.), a master in mental health,
completed the CANTAB and CERAD tests.32,33The same research
assistant, blinded to the clinical diagnosis, performed all
neuropsy-chological tests in all patients and controls. Data S1 lists the CERAD
and CANTAB tests used in this study.
2.2.2
|TRYCAT pathway assays
The same day as the semistructured interview and neurocognitive
tests blood was sampled around 8:00 am and frozen at−80°C until
thawed for assay for IgM and IgA responses directed against 6
TRYCATs, namely, the noxious (NOX) TRYCATs QA, 3HK, PA, and
XA, and generally more protective (PRO) TRYCATs, namely,
kynurenic acid (KA) and anthranilic acid (AA). Previously, the assays
were described somewhere else34and detailed in Data S1. This file
also shows the relevant z‐unit weighted composite TRYCAT scores
2.2.3
|Statistics
Clustering analysis was the primary statistical approach used to
classify the individuals into relevant clusters using Forgy centroid
and theK‐means method.19,20These analyses detect classes of highly
similar entities and reorganize the data set into more homogeneous
groups. The main goals of our cluster‐analytic procedures were (A)
to develop a typology or classification of stable phase schizophrenia
based on negative symptoms; (B) to compare this new classification
with the SDS diagnosis of deficit schizophrenia in order to improve
the diagnostic criteria; and (C) to determine whether a nondeficit
phenotype can be detected in our data set. The variables to be
classified contained 11 negative symptoms as measured with the
SDS (n = 6) + SANS (n = 5) or the 6 first principal components (PCs)
used as dimension reduction method and explaining 94.8% of the
variance in these 11 variables. Two other unsupervised techniques
were used to visualize the data points of all participants on a 2‐
dimensional plane, namely, 2D and 3D t‐distributed stochastic
neighbour embedding (t‐SNE) and PC plots, 2 dimensionality reduction
techniques.
To interpret the data structure of the generated clusters, we
per-formed different statistical analyses. Analyses of variance and the
Kruskal‐Wallis test were used to assess differences between the
clus-ter‐analytically generated classes in scale variables, including
neuroimmune, cognitive, and clinical features. Analysis of contingency
tables (Χ2‐test) were used to assess associations between the
gener-ated clusters and nominal variables, including deficit diagnosis and
sex. Multivariate general linear model (GLM) analyses were used to
assess the effects of diagnosis on sets of neuroimmune, cognitive,
and symptomatic features, while controlling for sex, age, and years
of education as confounding variables. Subsequently, tests for
between‐subjects effects were used to check the effects of the
signif-icant explanatory variables on the dependent variables. The results of
multiple analyses were p corrected for false discovery rate according
to Benjamini and Hochberg.35 Automatic stepwise binary logistic
regression analyses were used to delineate the most significant
neuroimmune (TRYCAT ratios), cognitive (CERAD and CANTAB tests),
and clinical features (items of the different rating scales) predicting the
cluster‐analytically generated classes, while using Nagelkerke values
as effect size estimates. Data S1 shows the supervised techniques
used here. Automatic stepwise regression analyses with the zunit‐
weighted composite scores of the symptom dimensions as dependent
variables and the neuroimmune, cognitive, and negative symptoms as
explanatory variables were performed in order to delineate the most
important features. Statistical analyses were performed using IBM
SPSS Windows version 22, Statistica 8, Maes‐Stat and MatLab. Tests
were 2‐tailed, and an alpha level of 0.05 indicated a statistically
significant effect.
3
|R E S U L T S
3.1
|Clustering analysis
We examined 2 and 3 cluster solutions with both clustering
methods. The 2 cluster solution yielded the most interpretable
results, and there was a total agreement between both Forgy and
K‐mean clustering solutions. Moreover, entering the 11 negative
symptoms or the first 6 PCs subtracted from these 11 symptoms
yielded exactly the same results. Both clustering methods split the
schizophrenia group in 2 classes with 43 and 35 subjects.
Conse-quently, individuals were assigned to 3 categories, namely, (A)
healthy controls, (B) schizophrenic patients belonging to cluster 1
(n = 43), and (C) cluster 2 (n = 35). Figure S1 shows the
measure-ment of the negative SDS and SANS symptoms used to generate
cluster1, cluster2, and controls. Table S1 shows the demographic
data of the clusters. There were no significant differences in age,
sex, tobacco use disorder, number of psychoses, or duration of
ill-ness between both clusters. Subjects belonging to cluster 2 showed
a significantly lower education, less employment, and a lower BMI
than those belonging to cluster 1. There was a strong association
between the cluster‐analytically generated classes and the deficit
versus nondeficit distinction, although 7 cases were misclassified.
Binary logistic regression analysis showed that 3 SANS items were
the best predictors separating the 2 clusters, namely, anhedonia,
attention, and flattening (Nagelkerke = 1.000,χ2 = 107.31,df = 3,
P< .001). The sum of those 3 items >24 showed a sensitivity of
97.7% and a specificity of 97.1%.
3.2
|Clinical features of the clusters
Table S1 shows that all rating scale scores, except Fibromyalgia and
Chronic Fatigue Syndrome Rating, were significantly higher in cluster
2 than cluster 1. All contrasts remained significant afterPcorrections
were made. Multivariate GLM analysis showed that the severity of
the 4 symptom dimensions (psychosis, hostility, excitement, and
man-nerism) was significantly different between the 3 study groups
(F= 14.57,df= 8/218,P< .001; partial eta squared = 0.348). Table
S1 shows the model‐generated marginal means after adjusting for
age, sex, and education. Pairwise comparisons showed that psychosis,
hostility, excitement, and mannerism were all significantly higher in
cluster 2 than cluster 1 (allP< .001). Partial eta squared values were
psychotic symptoms: 0.441; hostility: 0.191; excitement: 0.544; and
mannerism: 0.279. Figure S2 shows the 4 dimensions (in zscores)
together with thez values of the total SDS and total SANS scores
in the 3 groups.
Table S1 also shows the scores on the WHOQOL in the 3 study
groups. Multivariate GLM analysis showed that there was a significant
effect of diagnosis on the 4 WHOLQOL and total WHOQOL
mea-surements (F= 9.29,df= 8/222,P< .001; partial eta squared = 0.285).
Tests for between‐subject effects showed significant effects of
diag-nosis on the 5 WHOQOL measurements with partial eta square values
for domain 1: 0.314; domain 2: 0.425; domain 3: 0.128; domain 4:
0.385; and total score: 0.404. Domain 3 scores were significantly
higher in cluster 2 patients than in controls (P= .001) and cluster 1
patients (P= .010). All other domain scores and the total score were
significantly different between the 3 study groups and decreased from
controls to cluster 1 patients and then to cluster 2 patients. Also, the
EQ‐5D item“problems in usual activities”was significantly higher in
3.3
|Neuroimmune features of both clusters
Figure S3 shows the TRYCAT ratios in the 3 study groups. MultivariateGLM analysis showed a highly significant effect of diagnosis on the 4
TRYCAT ratios (F = 8.69, df = 8/216, P < .001; partial eta
squared = 0.243), while tests for between‐subject effects showed
highly significant associations between diagnosis and IgA NOX_PRO
(F= 21.44,df= 2/111,P< .001) with higher values in both clusters
than in controls (P< .001) but no significant differences between both
clusters (P= .051). Tests for between‐subject effects showed highly
significant associations between diagnosis and Δ NOX_PRO
(F= 12.84,df= 2/111, P< .001),ΔIgA_IgM (F= 6.12,df= 2/111,
P= .003), and IgM KA_3HK (F= 13.92,df= 2/111,P< .001) with
higher values in cluster 2 than in controls (allP< .001) and cluster 1
(all P < .002). All contrasts remained significant after Pcorrections
were made.
3.4
|Neurocognitive features of both clusters
Figure S4 shows the 10 CANTAB tests in the 3 study groups.
Multivar-iate GLM analysis showed a highly significant effect of diagnosis on the
10 CANTAB tests (F = 3.27, df = 20/198, P < .001; partial eta
squared = 0.248), while tests for between‐subject effects showed
highly significant associations between diagnosis and all 10 key
CAN-TAB tests except IED_EDS and IED_TEA. Tests for between‐subject
effects showed significant differences between both clusters in RVP_A
(P= .037), PAL_TEA (P= .006), SWM_BE (P= .030), and OTS_SBOFC
(P= .030). RVP_A and PAL_TEA were significantly lower in cluster 2
patients than in controls (P= .001), while no significant differences
were found between cluster 1 and controls. There were highly
signifi-cant differences between both clusters and normal controls in RVP_BE
(P< .008), SWM_STR (P< .001), SWM_BE (P< .001), OTS_SBOFC
(P< .001), ERT_MORL (P= .005), and ERT_PC (P= .01).
Table S1 shows that there are significant differences in the
epi-sodic memory index between the 3 groups with increasing
impair-ments from controls to cluster 1 and from cluster 1 to cluster 2. The
semantic memory index showed significantly worse scores in both
schizophrenia clusters than in controls. Figure S5 shows the 7 CERAD
tests in the 3 study groups. Multivariate GLM analysis showed a highly
significant effect of diagnosis on the 7 CERAD tests (F= 5.21,df= 14/
206,P< .001; partial eta squared = 0.263), while tests for between‐
subject effects showed highly significant associations between
diag-nosis and all CERAD tests (atP< .001) except Boston Naming Test.
Cluster 2 patients showed significantly worse outcomes on Mini‐
Mental State Examination (MMSE) (P= .001), Word List Memory
(WLM) (P= .001), TrueRecall (P= .002), FalseRecall (P= .001), and
WordRecognition (P= .029) than cluster1 patients, while there were
no significant differences between both clusters in verbal fluency test
(VFT) (P= .201). Patients belonging to cluster 1 and cluster 2 showed
significantly worse outcomes on WLM (P= .008) than controls. There
were no significant differences in MMSE (P = .238), TrueRecall
(P= .096), FalseRecall (P= .132) and WordRecognition (P = .923)
between cluster 1 patients and controls. Based on these findings, we
have named cluster 2 as “major neurocognitive psychosis (MNP)”
and cluster 1 as“simple neurocognitive psychosis (SNP).”
3.5
|Best predictors of MNP (cluster 2) and SNP
(cluster 1)
Table 1 shows the results of different automatic stepwise binary
logis-tic regression analyses with MNP or SNP as dependent variables and
CANTAB and CERAD tests and TRYCAT ratios as explanatory
vari-ables. AllPvalues of the 15 regressions shown in Table 1 remained
sig-nificant afterPcorrections were made. Firstly, we have delineated the
predictors of MNP versus SNP. Major neurocognitive psychosis was
best predicted by a combination of 2 PANSS symptoms, namely, N1
(blunted affect) and N3 (poor rapport). Regression no. 2 shows that
MNP was also highly significantly predicted by 2 of the 6 symptoms
of the psychotic dimension, namely, BPRS12 (hallucinatory behaviour)
and BPRS15 (unusual thought content). Regression no. 3 shows that
MNP was highly significantly predicted by 2 symptoms belonging to
the excitation, hostility, and posturing dimensions, namely, P7
(hostil-ity) and BPRS17 (excitement). Major neurocognitive psychosis was
also predicted by MMSE combined with FalseRecall (regression no.
4), PAL‐TEA (regression no. 5), and a combination of 2 TRYCAT ratios
(regression no. 6) or WLM, MMSE coupled with 2 TRYCAT ratios
(regression no. 7).
Simple neurocognitive psychosis (with controls as reference
group) was significantly predicted by WLM and VFT (regression no.
1), SWM_BE and ERT_MORL (regression no. 2), IgA NOX_PRO and
IgM 3HK_KA (regression no. 3), and the combination IgA NOX_PRO
and VFT (after adjusting for sex). Major neurocognitive psychosis
was highly significantly discriminated from controls using WLM and
VFT (regression no. 1), RVP_ML and SWM_BE (regression no. 2), IgA
NOX_PRO and IgM 3HK_KA (regression no. 3), and the combination
IgA NOX_PRO, VFT, and WLM (regression no. 4).
3.6
|Results of SVM, random forest, and adaptive
boosting
Table S2 shows the 10‐fold cross‐validation performances of the
feature sets, namely, the TRYCAT ratios, CANTAB/CERAD measures,
and clinical variables. We have also introduced age, sex, and
educa-tion in the same supervised learning techniques and learned whether
the neuroimmune and cognitive features provided extra predictive
power over the confounding variables. This is important as there
are significant associations between neurocognitive tests and age,
sex, and education.10Using the CERAD, CANTAB, and TRYCAT
fea-tures separating MNP from SNP resulted in a modest 10‐fold cross‐
validation accuracy (51.8%‐69.3%). Using psychotic and excitation,
but not hostility and mannerism, symptoms yielded a much higher
cross‐validation accuracy (74.6%‐91.8%). Combining TRYCAT and
CERAD with the psychotic, hostility, excitation, and mannerism
(PHEM) symptoms yielded good accuracy segregating MNP from
SNP (79.1%‐86.1%), SNP from controls (77.5%‐85.0%), and MNP
from controls (93.8%‐97.1%).
Consequently, we have computed the predictive weights in the
above linear SVM models and the importances in the random forest
models using the combined features of TRYCATs and CERAD or
TRYCATs, CERAD, and PHEM symptoms. Table 2 shows that 4 of
both linear SVM and random forest agreed, namely, IgM KA_3HK, )
NOX_PRO, age, and MMSE. Of the PHEM symptoms, the top 1
fea-ture segregating MNP from SNP was BPRS item 17 (excitation). When
combining the 3 feature sets (which yielded a good accuracy; see Table
S2), BPRS item 17 (excitation) and PANSS item P7 (hostility) belonged
to the top‐5 features in both analyses, while random forest (which
yielded the best segregation in Table S2) additionally showed that
IgM KA_3HK, ) NOX_PRO, and MMSE are important for segregating
MNP from SNP. Comparing the results of binary regression analyses
(Table 1) with the feature weights and importances in Table 2 shows
that 6 features were relevant in all 3 types of analyses, namely, )
NOX_PRO, IgM KA_3HK, BPRS17 (excitation), P7 (hostility), MMSE,
and WLM.
Four of the top 5 features segregating SNP from controls agreed
between linear SVM and random forest, namely, BPRS12
(hallucina-tions), P1 (delusions), P4 (excitation), and IgA NOX_PRO. Two of the
top 5 features segregating MNP from controls agreed between linear
SVM and random forest, namely, BPRS15 (unusual thoughts), which
TABLE 1 Results of different automatic stepwise binary logistic regression analyses with MNP and SNP as dependent variables and CANTAB and CERAD tests, and TRYCAT ratios as explanatory variablesa
Entered as Explanatory
Variables MNP/SNP Nagelkerke
Significant Explanatory
Variables Wald df P OR 95% CI
SANS negative 0.841 N1 8.57 1 .003 9.75 2.12 to 44.77
77.30,df= 2,P< .001 N3 8.41 1 .004 8.48 2.00 to 35.94
Psychotic dimension 0.705 BPRS12 15.01 1 <.001 6.39 2.50 to 16.33
58.42,df= 2,P< .001 BPRS15 4.67 1 .031 2.73 1.10 to 6.80
Excitation, hostility, mannerism dimensions
0.820 P7 5.50 1 .018 2.18 1.14 to 4.16
74.02,df= 2,P< .001 BPRS17 16.12 1 <.001 47.72 7.23 to 314.92
CERAD 0.313 MMSE 6.40 1 .011 0.44 0.24 to 0.83
19.69,df= 2,P< .001 False recall 5.52 1 .019 2.17 1.14 to 4.15
CANTAB 0.128 PAL_TEA 6.69 1 .010 1.92 1.17 to 3.15
7.53,df= 1,P= .006
TRYCATs 0.342 ΔIgA_IgM 5.16 1 .023 1.97 1.10 to 3.52
22.71,df= 2,P< .001 IgM 3HK_KA 11.07 1 .001 2.99 1.57 to 5.71
CERAD + TRYCATs 0.594 ΔNOX/PRO 6.40 1 .011 2.17 1.19 to 4.00
63.46,df= 4,P< .001 IgM 3HK_KA 11.14 1 .001 3.12 1.60 to 6.09
WLM 4.51 1 .034 0.45 0.22 to 0.94
MMSE 9.77 1 .002 0.34 0.17 to 0.67
SNP/controls
CERAD 0.388 WLM 4.28 1 .039 0.49 0.25 to 0.96
28.18,df= 2,P< .001 VFT 11.27 1 .001 0.28 0.13 to 0.59
CANTAB 0.422 SWM_BE 11.56 1 .001 2.88 1.56 to−5.29
31.13,df= 2,P< .001 ERT_MORL 8.38 1 .004 3.04 1.43 to 6.46
TRYCAT 0.342 IgA NOX/PRO 16.20 1 <.001 5.08 2.30 to 11.20
24.33,df= 2,P< .001 ΔIgA_IgM 3.87 1 .049 0.54 0.29 to 0.99
CERAD + TRYCATs 0.601 IgA NOX/PRO 9.32 1 .002 3.49 1.56 to 7.79
48.58,df= 3,P< .001 VFT 12.02 1 .001 0.16 0.06 to 0.45
Sex (male) 10.03 1 .002 12.51 2.62 to 59.71
MNP/controls
CERAD 0.662 WLM 11.92 1 .001 0.15 0.05 to 0.43
49.12,df= 2P< .001 VFT 8.16 1 .001 0.23 0.09 to 0.63
CANTAB 0.634 RVP_ML 9.33 1 .002 5.11 1.79 to 14.51
44.19,df= 2,P< .001 SWM_BE 12.45 1 <.001 4.85 2.02 to 11.66
TRYCATs 0.575 IgA NOX_PRO 15.14 1 <.001 6.37 2.51 to 16.18
42.23,df= 1,P< .001 IgM 3HK_KA 4.15 1 .042 2.16 1.03 to 4.51
CERAD + TRYCATs 0.802 IgA NOX/PRO 10.22 1 .001 8.57 2.30 to 31.99
69.30,df= 3,P< .001 VFT 5.16 1 .023 0.23 0.06 to 0.82
WLM 8.54 1 .003 0.13 0.03 to 0.51
aPsychosis: PANSS P1 (delusion), P3 (hallucinations), P6 (suspiciousness), BPRS11 (suspiciousness), BPRS12 (hallucinatory behaviour), BPRS15 (unusual
was ranked first in both analyses, and IgA NOX_PRO, while also
BPRS11 (suspicious), WLM, and MMSE were relevant features in
random forest and IgM KA_3HK, P4 (excitation), and P7 (hostility) in
linear SVM.
3.7
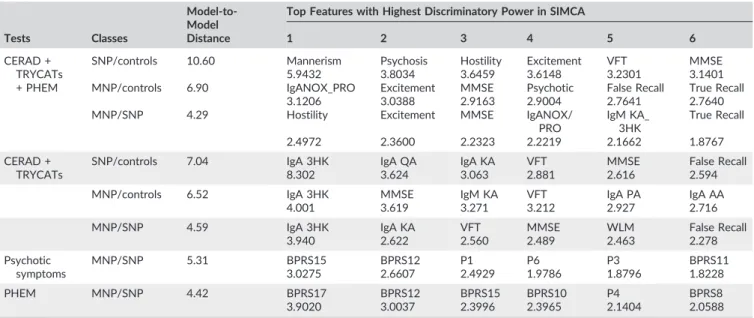
|Results of SIMCA analyses
Firstly, we examined possible differences between MNP, SNP, and
controls using TRYCAT ratios, CERAD, and the 4 composite
symptom-atic scores. Table 3 (SIMCA no. 1) shows that the combination of
TRYCATs, CERAD, and clinical features yielded a highly significant
modelling and discrimination of the 3 classes. Simple neurocognitive
psychosis was significantly separated from controls (model‐to‐model
distance = 10.60) using the 4 dimension scores, VFT, and MMSE
(top 6 features). Major neurocognitive psychosis was significantly
separated from controls (model‐to‐model distance = 6.90) with as
top 6 features IgA NOX_PRO, excitement, and psychotic scores,
MMSE, FalseRecall and TrueRecall. Major neurocognitive psychosis
was significantly separated from SNP (model‐to‐model distance = 4.29)
with as discriminatory features hostility and excitement scores, MMSE
and TrueRecall, IgA NOX_PRO, and IgM 3KA_3HK.
Consequently, we performed a SIMCA without the 4 symptomatic
dimension scores and with the separate TRYCATs (instead of ratios) as
modelling/discriminatory features. SIMCA no. 2 shows that the
model‐to‐model distances remained significant after removing the 4
symptomatic dimension scores and that IgA responses to 3HK, QA,
and KA together with VFT, MMSE, and FalseRecall were the top 6
fea-tures discriminating SNP from controls. Also, the distance between
MNP and controls was significant with IgA responses to 3HK, KA,
PA, and AA coupled with MMSE and VFT as modelling/discriminatory
TABLE 2 Predictive weights in linear SVM or importances in random forest models performed on different feature sets, namely, CANTAB measures, CERAD tests, IgM/IgA response ratios directed to TRYCATs, and symptom dimensions, including PHEMa
MNP/SNP
Linear SVM Random Forest
Top Features Feature Weights Top Features Feature Importance
CERAD + TRYCATs IgM KA_3HK 0.2989 IgM KA_3HK 0.3306
ΔNOX_PRO 0.2136 ΔNOX_PRO 0.1444
Age −0.1119 MMSE 0.1068
WLM −0.1294 BNT 0.1025
MMSE −0.3406 Age 0.0805
PHEM BPRS17 1.4213 BPRS17 0.5639
P7 0.6983 BPRS11 0.1126
G14 0.6210 Education 0.0612
PHEM + CERAD + TRYCATs BPRS17 1.3384 BPRS17 0.3116
P7 0.7677 IgM KA_3HK 0.1309
G14 0.4747 ΔNOX_PRO 0.1102
WLM 0.4651 P7 0.0782
BPRS11 0.4543 MMSE 0.0755
SNP/controls
CERAD + TRYCATs VFT −0.6005 WLM 0.1970
IgA NOX_PRO 0.5560 VFT 0.1802
WLM −0.4456 IgA NOX_PRO 0.1630
Sex −0.4385 Age 0.1369
IgM KA_3HK −0.3681 IgM KA_3HK 0.1007
PHEM + CERAD + TRYCATs BPRS12 0.8546 VFT 0.1604
P4 0.6875 BPRS12 0.1437
P1 0.6343 P4 0.1303
P5 0.3161 P1 0.0883
IgA NOX_PRO 0.3014 IgA NOX_PRO 0.0718
MNP/controls
CERAD + TRYCATs IgA NOX_PRO 0.5210 WLM 0.2482
Gender −0.6419 VFT 0.1636
MMSE −0.6798 MMSE 0.1561
WLM −0.9592 IgA NOX_PRO 0.1405
VFT −0.9742 IgM KA_3HK 0.1046
PHEM + CERAD + TRYCATs BPRS15 0.7843 BPRS15 0.2577
IgM KA_3HK 0.5899 BPRS11 0.1688
P7 0.5610 IgA NOX_PRO 0.1315
IgA NOX_PRO 0.2981 WLM 0.1165
P4 0.2462 MMSE 0.0781
aPHEM: items of different symptomatic dimensions: psychosis, hostility, excitation and mannerism. Psychosis: PANSS P1 (delusion), P3 (hallucinations), P6
variables. Finally, there was also a significant distance between MNP
and SNP using IgA responses to 3HK and KA together with VFT,
WLM, MMSE, and FalseRecall as modelling/discriminatory variables.
Secondly, we have also investigated whether PHEM and
psy-chotic symptoms alone may model and discriminate the MNP and
SNP classes. SIMCAs no. 3 shows that psychotic symptoms alone
sig-nificantly modelled and discriminated both classes, and that all 6
fea-tures contributed to the discrimination. Also, PHEM feafea-tures (SIMCA
no. 4) significantly modelled and discriminated both classes (model‐
top‐model distance = 4.42), while the top 6 features were BPRS17
(excitation), BPRS12 (hallucinations), BPRS15 (unusual thoughts),
BPRS10 (hostility), P4 (excitation), and BPRS8 (grandiosity).
3.8
|Results of t
‐
SNE and PC plots
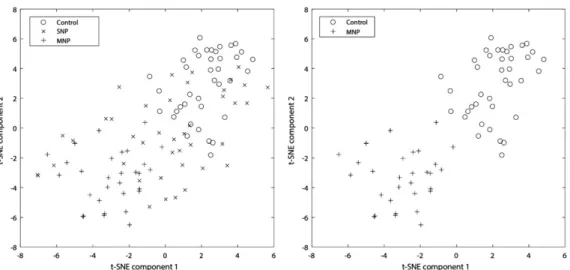
Finally, we used t‐SNE to visualize the underlying data structure of the
TRYCAT, CERAD, and PHEM features in a 2‐dimensional plane.
Figure 1 shows the distribution of all data points of the subjects and
the MNP, SNP, and control classes (left panel) or only MNP and
con-trol classes (right panel). The right panel shows that the 3 sets of
fea-tures strongly demarcate MNP from controls with clear boundaries
between the 2 groups. This is in accordance with the results obtained
by SIMCA, linear and RBF SVM, random forest, and adaptive boosting,
which all showed a significant segregation/discrimination of both
groups. The left panel shows that when also the data points of the
SNP class are included in the same plot, they filled the street between
MNP and controls and overlapped with both other classes.
Nevertheless, it can be seen that the“distribution”of the SNP data
points may take a different shape than that of the MNP and control
classes. Principal component plots, namely, PC1 versus PC2, PC3,
PC4, and PC5, or especially the 3‐dimensional (3D) plot of PC1, PC2,
and PC3 shows that the 3 classes are well separated in the 3D space.
In Figure 2, we visualize the distribution of the SNP data points and
the model that contains these data points, showing that the model
constructed around the SNP data points may be different from the
models that surround MNP and control data points, although there
may be some overlap.
3.9
|Prediction of PHEM dimensions by TRYCATs,
cognitive function, and negative symptoms
Table S3 (regression nos. 1‐4) shows the associations between the 4
symptomatic dimensions and TRYCAT ratios, CERAD tests scores
and clinical features. All Pvalues of the 12 regressions shown in
Table S3 remained significant after P corrections were made. We
found that a part of the variance in psychotic, excitement, and
man-nerism symptoms were associated with the TRYCAT ratios, especially
the IgA NOX_PRO ratio. All 4 dimensions were associated with
educa-tion (protective) and male sex (risk factor).
In a second set of analyses (regression nos. 5‐8), we found that
the psychotic and excitement dimensions are for a larger part
(35.7%‐44.4% of the variance) predicted by the combined effects of
TRYCAT and CERAD features with or without male sex. Also, hostility
TABLE 3 Results of SIMCA analyses performed with CANTAB tests, CERAD tests, IgM/IgA responses directed to TRYCATs, and symptom dimensions, including PHEM as modelling/discriminatory features and MNP, SNP, and healthy controls (C) as classesa
Tests Classes
Model‐to‐ Model Distance
Top Features with Highest Discriminatory Power in SIMCA
1 2 3 4 5 6
CERAD + TRYCATs + PHEM
SNP/controls 10.60 Mannerism Psychosis Hostility Excitement VFT MMSE
5.9432 3.8034 3.6459 3.6148 3.2301 3.1401
MNP/controls 6.90 IgANOX_PRO Excitement MMSE Psychotic False Recall True Recall
3.1206 3.0388 2.9163 2.9004 2.7641 2.7640
MNP/SNP 4.29 Hostility Excitement MMSE IgANOX/
PRO
IgM KA_ 3HK
True Recall
2.4972 2.3600 2.2323 2.2219 2.1662 1.8767
CERAD + TRYCATs
SNP/controls 7.04 IgA 3HK IgA QA IgA KA VFT MMSE False Recall
8.302 3.624 3.063 2.881 2.616 2.594
MNP/controls 6.52 IgA 3HK MMSE IgM KA VFT IgA PA IgA AA
4.001 3.619 3.271 3.212 2.927 2.716
MNP/SNP 4.59 IgA 3HK IgA KA VFT MMSE WLM False Recall
3.940 2.622 2.560 2.489 2.463 2.278
Psychotic symptoms
MNP/SNP 5.31 BPRS15 BPRS12 P1 P6 P3 BPRS11
3.0275 2.6607 2.4929 1.9786 1.8796 1.8228
PHEM MNP/SNP 4.42 BPRS17 BPRS12 BPRS15 BPRS10 P4 BPRS8
3.9020 3.0037 2.3996 2.3965 2.1404 2.0588
aPHEM: items of different symptomatic dimensions: psychosis, hostility, excitation and mannerism. Psychosis: PANSS P1 (delusion), P3 (hallucinations), P6
and mannerism were significantly associated with CERAD variables
and male sex.
The 4‐dimensional scores were also significantly associated with
the negative symptoms, which explained around 57.0% to 61.6% in
the variance of the psychotic and excitement dimensions and 23.0%
to 30.1% of the variance in the mannerism and hostility dimensions.
N3 (poor rapport), N5 (difficulty in abstract thinking), and N7
(stereo-typed thinking) were the most significant predictors of these 4‐
dimen-sional scores. In the patients, we also investigated whether the DSM‐
IV‐TR diagnosis paranoia could have an effect on the 4 symptom
dimensions. The diagnosis paranoia, however, had no significant effect
on the 4 dimensions (F= 0.95,df= 4/67,P= .439), while MNP versus
SNP were highly significant (F= 11.41,df= 4/67,P< .001).
4
|D I S C U S S I O N
4.1
|Description of the 2 classes generated by
clustering analysis
In this study, we have successfully classified our schizophrenia
patients into 2 groups based on the presence of the negative
symp-toms of the SDS and SANS. One cluster (cluster 2) was
character-ized by higher scores on all SDS and SANS items as compared
with the other cluster (cluster 1). There was a particularly clear
sim-ilarity between our results obtained by unsupervised learning and
the division of the same patients based on SDS criteria.4
Neverthe-less, applying the SDS criteria showed that some patients were
misclassified because the SDS criteria were less restrictive than the
cluster analytically generated classes herein observed. Logistic
regression analyses showed that 3 negative subscale items of the
SANS, namely, anhedonia, attention, and flattening, were most
use-ful in discriminating the 2 clusters with 100% accuracy and that
the sum of those 3 items >24 showed a sensitivity of 97.7% and a
specificity of 97.1%.
Although our clustering analysis provided a class, which broadly
agreed with the characteristics of deficit schizophrenia,4it would be
inadequate to use a label stressing negative symptoms, including
“deficit schizophrenia.”Indeed, external validation shows that cluster
2 is characterized by many more features, which adequately
discrim-inate this cluster from controls and cluster 1. Firstly, cluster 2 is
accompanied by increased IgA responses to noxious TRYCATs
(indi-cating increased production) and by lowered levels of IgM responses
to the same noxious TRYCATs (indicating lowered regulation)
pointing to increased activities of these noxious TRYCAT
spe-cies.10,11Secondly, cluster 2 is characterized by important deficits
in episodic and sematic memory and a decline in neuropsychological
functioning as indicated by a lower MMSE, which are all strongly
associated with negative symptoms.10Thirdly, cluster 2 is
character-ized and modelled by highly increased scores on psychotic
FIGURE 1 T‐distributed stochastic neighbour embedding (t‐SNE) plot visualizing the underlying data structure of neuroimmune (namely, the tryptophan catabolite pathway), cognitive (namely, Cambridge neuropsychological test automated battery and consortium to establish a registry for Alzheimer's disease tests), and clinical (namely, psychotic, hostility, excitation, and mannerism) features. Those features strongly segregate major neurocognitive psychosis (MNP) from normal controls. The data distribution of simple neurocognitive psychosis (SNP) cases shows a different shape than that of MNP and normal controls
symptoms, excitation, hostility, and mannerism, while also
depres-sive, but not physiosomatic, symptoms are somewhat higher.
Phrased differently, although cluster 2 was generated using negative
symptoms, also PHEM symptoms model and discriminate that class
highly significantly. Moreover, the PHEM symptoms are highly
signif-icantly associated with negative symptoms sharing 23.0% to 61.6%
of their variance. This shows that negative and PHEM symptoms
are intertwined phenomena that co‐occur to shape cluster 2 as a
distinct class. Fourthly, HR‐QOL and employment status are
signifi-cantly decreased in cluster 2 as compared with cluster 1 patients.
Finally, the findings of SIMCA support the categorical approach that
cluster 2 is a distinct class and nosological entity and not a more
severe variant in a continuum36of progressing neuroimmune,
cogni-tive, and clinical aberrations.
4.2
|A new name for stable phase schizophrenia
subtypes
A new name describing an illness should include its most
character-istic features as well as what it excludes. Therefore, our results show
that previous labels of the illness are not very adequate. Thus,
“dementia praecox”stresses dementia, but what is actually observed
are deficits in semantic and episodic memory in the range of
amnestic mild cognitive impairment, not dementia. Moreover,
Bleuler's concept of“schizophrenia”clearly does not fit the features
of the illness as there is no splitting but rather different interrelated
clinical and cognitive symptoms. Moreover, our results do not
pro-vide support to Bleuler's distinction into basic symptoms, including
loosening of associations and withdrawal from reality and accessory
symptoms, including hallucinations and delusions.37Conversely, data
herein presented suggest that all symptom dimensions are
intertwined phenomena that are modulated by neuroimmune and
cognitive impairments. Also, the labels “type 1” (positive) and“type
2” (negative) schizophrenia are not adequate as positive symptoms
appear to consist of different other dimensions, including psychotic
and excitation dimensions, which are associated with neuroimmune
and cognitive features. This study also showed that the DSM‐IV‐
TR diagnosis“paranoid schizophrenia”is not helpful. Thus, this label
did not show any significant neuroimmune or cognitive correlates.
Even more, the variance in the PHEM dimension in schizophrenia
patients was explained by the generated clusters and not by
para-noid schizophrenia, indicating that the latter diagnosis is not
accom-panied by more psychotic symptoms, including delusions. These
findings further support the trend of DSM‐5 to delete the DSM‐
IV‐TR subtypes, including paranoid schizophrenia, because of their
“limited diagnostic stability, low reliability, and poor validity” (DSM‐
5, 2013). Moreover, these DSM‐IV‐TR subtypes are generally not
being used in research papers.18
Therefore, in order to stress the role of neuroimmune, cognitive,
and psychotic symptoms, which model cluster 2, we suggest to
name this subtype of stable phase schizophrenia major
neurocognitive psychosis.“Major”to denote the severity of the
neg-ative and PHEM symptoms as well as the neuroimmune and
cogni-tive impairments. In several countries, there is a trend to change
the diagnostic label of schizophrenia because diagnostic labels such
as “dementia praecox,” “schizophrenia,” and “deficit schizophrenia”
add to the stigmatization of individuals with these disorders.38
Con-sequently, new diagnostic labels were proposed especially in Asian
countries, including“integration disorder”in Japan and“dysfunction
of thought and perception”in China.38 Thus, our proposal to label
this cluster as MNP is in accordance with the new trend to minimize
the stigmatization and to include “thought disorder” in the new
name of the illness. Nevertheless,“thought disorder”does not reflect
the severity of the cognitive correlates of negative as well as
psy-chotic symptoms.
4.3
|MNP should be added to DSM
‐
5
Another relevant question is whether MNP should be added to the
DSM‐5 as a nosological entity. Braff et al18 argued that the DSM‐
5 classification of schizophrenia would not be enhanced by adding
the deficit subtype without a valid definition of the“nondeficit”
sub-type. In this respect, the current study shows that also non‐MNP
patients aggregate and form a distinct class well separated from
con-trols using IgA responses to noxious TRYCATs, impairments in
semantic and episodic memory, and PHEM features. Nevertheless,
the aberrations in these 3 features are more expressed in MNP than
in non‐MNP patients. Therefore, we name the last group “simple
neurocognitive psychosis,”indicating that this class is characterized
by less well‐developed neuroimmune, cognitive, clinical, and health‐
related features, while MNP should be regarded as the full‐blown
core illness. Previously, we reported that while deficit schizophrenia
is a distinct category separated from normal controls and nondeficit
schizophrenia,16 the latter subtype could not be established as a
separate entity that was discriminated from controls. Thus, by
re‐allocating some patients with deficit schizophrenia to the SNP
class and some patients with nondeficit schizophrenia to the MNP
class, the clustering analysis generated a better accuracy than the
more liberal SDS classification. Figure 2 shows how the clustering
analysis demarcated 2 distinct classes regarding the features
measured here.
4.4
|Effects of BMI, education, and male sex
Another feature of MNP is a lowered BMI. Previously, a significant
association between“dementia praecox”and a leptosome body
stat-ure has been described.21 In this respect, Kretschmer reported that
schizophrenia is associated with the leptosome (asthenic) body stature
in contrast to bipolar disorder, which is associated with a pyknic body
type.21,39Nevertheless, our study may indicate that the higher BMI in
SNP may have protected against MNP. In this regard, it is interesting
to note that overweight and obesity may protect against mortality
because of infections, including community‐acquired pneumonia.40,41
Generally, obesity has pro‐inflammatory and more detrimental effects,
and therefore, the protective effects of BMI were described as the
“obesity paradox.”41 One possible mechanistic explanation is that
there is a shift towards increased production of anti‐inflammatory
adipokines42in SNP protecting against MNP.
Another hallmark of MNP is lower education, suggesting that
lower education is a vulnerability factor for psychotic symptoms,
hos-tility, excitation, and mannerism as well as objective cognitive
impair-ments and negative symptoms.16 This may be explained by the
knowledge that education is one of the factors that contribute to
cog-nitive reserve, which in turn increases resilience to brain damage via
alternative cognitive strategies or a more efficient exploitation of
heathy brain networks.41Finally, another feature of psychotic
symp-toms, hostility, excitation, and mannerism is male sex. Previously, we
reported that male sex is associated with worse scores on episodic
memory measurements.10These findings may explain the higher
prev-alence of schizophrenia and a worse course in males as compared with
females.42,43One possible mechanistic explanation is the effect of loss
of oestrogens on cognitive functions. Thus, oestrogens aggravate the
effects of aging on neurocognitive functions and improve
neurocognitive functions through activation of spinogenesis and
syn-aptogenesis in frontal cortex and hippocampus.43
Some limitations of our study warrant discussion. Firstly, its cross‐
sectional design precludes the establishment of firm causal inferences.
Secondly, to delineate the subtypes of stable phase schizophrenia, we
included only patients in a stable phase when no acute psychotic
epi-sodes were evident for at least 1 year. However, this approach does
not allow to examine whether the severity of acute psychotic episodes
is associated with the stable phase phenotypes. A relatively smaller
sample size could be a possible limitation to interpret cluster analysis
results. However, there are no rules of thumb to estimate the sample
size of the data set to be clustered, although the most common
rec-ommendation is that the dimensionality may not be too high for the
number of cases to be clustered.44Importantly, here, we entered all
features of a same dimension, namely, negative symptoms. Formann45
suggested that the minimum sample size for K‐means clustering
should be 2k, where k is the number of variables. Using 6 variables
(as used in our study) would suggest a sample size of 64. Importantly,
our cluster solution yielded a refinement of the existing deficit versus
nondeficit diagnosis, while the clusters were externally validated
against biomarkers. Nevertheless, future research should examine
the cross‐generalizability of our findings for an independent sample
of comparable patients with schizophrenia.
FIGURE 3 Stable‐phase schizophrenia consists of 2 relevant qualitatively distinct classes, namely, major neurocognitive psychosis (MNP) and simple neurocognitive psychosis (SNP). Simple neurocognitive psychosis is defined by activated neuroimmune pathways, impairments in semantic memory, and negative and psychotic, hostility, excitation and mannerism (PHEM) symptoms. Major neurocognitive psychosis is defined by greater impairments in these features and additionally by impairments in regulatory autoimmune responses and episodic memory
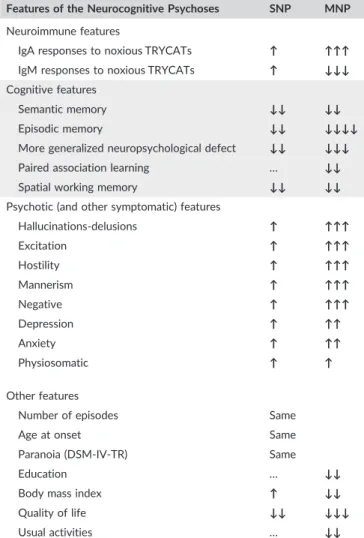
TABLE 4 Summary of neuroimmune, cognitive, and clinical features of MNP and SNP
Features of the Neurocognitive Psychoses SNP MNP Neuroimmune features
IgA responses to noxious TRYCATs ↑ ↑↑↑
IgM responses to noxious TRYCATs ↑ ↓↓↓
Cognitive features
Semantic memory ↓↓ ↓↓
Episodic memory ↓↓ ↓↓↓↓
More generalized neuropsychological defect ↓↓ ↓↓↓
Paired association learning … ↓↓
Spatial working memory ↓↓ ↓↓
Psychotic (and other symptomatic) features
Hallucinations‐delusions ↑ ↑↑↑
Excitation ↑ ↑↑↑
Hostility ↑ ↑↑↑
Mannerism ↑ ↑↑↑
Negative ↑ ↑↑↑
Depression ↑ ↑↑
Anxiety ↑ ↑↑
Physiosomatic ↑ ↑
Other features
Number of episodes Same
Age at onset Same
Paranoia (DSM‐IV‐TR) Same
Education … ↓↓
Body mass index ↑ ↓↓
Quality of life ↓↓ ↓↓↓
Usual activities … ↓↓
5
|C O N C L U S I O N S
In conclusion, Figure 3 shows that stable‐phase schizophrenia
con-sists of 2 relevant qualitatively distinct classes, namely, SNP and
MNP, which are both defined by neuroimmune, cognitive, and
clini-cal features. Using these features, both classes are well separated
from each other and from controls. Nevertheless, the SNP class in
the less well‐developed phenotype, while MNP is the full blown
phenotype or core illness. Figure 3 and Table 4 show that both
clas-ses are defined by increased IgA responclas-ses to noxious TRYCATs,
indicating increased production, while MNP is additionally defined
by attenuated regulation by IgM‐mediated immune responses.
More-over, the strong relationships between changes in TRYCAT
pattern-ing and negative, PHEM and cognitive features suggests that the
antecedents (immune activation and oxidative stress) or
conse-quences (neurotoxic effects) of TRYCAT pathway activation may
partly explain the cognitive and clinical (negative/PHEM) aberrations
in stable phase schizophrenia. While SNP is characterized by
impair-ments especially in semantic memory, the memory disturbances in
MNP are more profound and comprise also episodic memory
impair-ments. Both classes are defined by intercorrelated increases in
neg-ative and PHEM (psychotic, hostility, excitation, and mannerism)
features, which are more severe in MNP. We computed an algorithm
with 100% accuracy to separate both SNP and MNP, namely, an
algorithm based on the presence of 3 SANS symptoms. Moreover,
our SIMCA analysis provided another more comprehensive algorithm
based on TRYCATs, CERAD, and PHEM features, allowing us to
clas-sify future subjects as MNP, SNP, or controls. Our findings show
that is not adequate to discuss the categorical versus the
dimen-sional approach for classification of mental disorders without
performing the adequate statistical techniques, namely, unsupervised
and supervised learning techniques.
A C K N O WL E D G E M EN TS
The study was supported by the Asahi Glass Foundation,
Chulalongkorn University Centenary Academic Development Project.
C O N F L I C T O F I N T E R E S T
The authors have no conflict of interest with any commercial or other
association in connection with the submitted article.
A U T H O R C O N TR I BU T I O N
All the contributing authors have participated in the manuscript. M.M.
and B.K. designed the study. B.K. recruited patients and completed
diagnostic interviews and rating scale measurements. M.M. and Si.
Sri. carried out the statistical analyses. S.T. carried out the cognitive
tests. S.S. and M.G. performed the TRYCAT assays. All authors (B.K.,
Si.Sri., S.T., S.S., A.C., M.G., M.K., and M.M.) contributed to
interpreta-tion of the data and writing of the manuscript. All authors approved
the final version of the manuscript.
O R C I D
Michael Maes http://orcid.org/0000-0002-2012-871X
RE FE RE NC ES
1. Zachar P, Stoyanov DS, Aragona M, Jablensky A (Eds). Alternative Perspectives on Psychiatric Validation. OUP Oxford: DSM, ICD, RDoC, and Beyond; 2014.
2. Kendler KS, Parnas J (Eds).Philosophical Issues in Psychiatry: Explana-tion, Phenomenology, and Nosology. Baltimore: JHU Press; 2015.
3. Ahmed AO, Strauss GP, Buchanan RW, Kirkpatrick B, Carpenter WT. Are negative symptoms dimensional or categorical? Detection and val-idation of deficit schizophrenia with taxometric and latent variable mixture models.Schizophr Bull. 2015;41(4):879‐891.
4. Kirkpatrick B, Buchanan RW, McKenney PD, Alphs LD, Carpenter WT Jr. The schedule for the deficit syndrome: an instrument for research in schizophrenia.Psychiatry Res. 1989;30(2):119‐123.
5. Berrios GE, Luque R VJM.“Schizophrenia: a conceptual history”(PDF). Int J Psychol Psychol Ther2003,3:111–140.
6. Burton N.Living with Schizophrenia. Oxford: Acheron Press; 2012.
7. Crow TJ. The two‐syndrome concept: origins and current status. Schizophr Bull. 1985;11(3):471‐486.
8. Yu M, Tang X, Wang X, et al. Neurocognitive impairments in deficit and non‐deficit schizophrenia and their relationships with symptom dimen-sions and other clinical variables.PLoS One. 2015;10(9):e0138357.
9. Keefe RS, Harvey PD. Cognitive impairment in schizophrenia.Handb Exp Pharmacol. 2012;213:11‐37.
10. Kanchanatawan B, Hemrungrojn S, Thika S, et al. Changes in trypto-phan catabolite (TRYCAT) pathway patterning are associated with mild impairments in declarative memory in schizophrenia and deficits in semantic and episodic memory coupled with increased false‐ mem-ory creation in deficit schizophrenia.Mol Neurobiol. 2017. https://doi. org/10.1007/s12035‐017‐0751‐8. [Epub ahead of print] PubMed PMID: 28875464
11. Kanchanatawan B, Thika S, Sirivichayakul S, Carvalho AF, Geffard M, Maes M. In schizophrenia, depression, anxiety, and physiosomatic symptoms are strongly related to psychotic symptoms and excitation, impairments in episodic memory, and increased production of neurotoxic tryptophan catabolites: a multivariate and machine learning study. Neurotox Res. 2018. doi: https://doi.org/10.1007/ s12640‐018‐9868‐4. [Epub ahead of print] PubMed PMID: 29380275;33(3):641‐655.
12. Smith RS, Maes M. The macrophage‐T‐lymphocyte theory of schizo-phrenia: additional evidence.Med Hypotheses. 1995;45(2):135‐141.
13. Davis J, Moylan S, Harvey BH, Maes M, Berk M. Neuroprogression in schizophrenia: pathways underpinning clinical staging and therapeutic corollaries.Aust N Z J Psychiatry. 2014;48(6):512‐529.
14. Noto C, Ota VK, Santoro ML, et al. Depression, cytokine, and cytokine by treatment interactions modulate gene expression in antipsychotic Naïve first episode psychosis.Mol Neurobiol. 2016;53(8):5701‐5709.
15. Noto C, Maes M, Ota VK, et al. High predictive value of immune‐ inflammatory biomarkers for schizophrenia diagnosis and association with treatment resistance.World J Biol Psychiatry. 2012;27:1‐8.
16. Kanchanatawan B, Sriswasdi S, Thika S, et al. Deficit schizophrenia is a discrete diagnostic category defined by neuro‐immune and neurocognitive features: results of supervised machine learning.Metab Brain Dis. 2018. in press
17. Takahashi S. Heterogeneity of schizophrenia: genetic and symptomatic factors. Am J Med Genet B Neuropsychiatr Genet. 2013;162B(7):648‐652.
18. Braff DL, Ryan J, Rissling AJ, Carpenter WT. Lack of use in the litera-ture from the last 20 years supports dropping traditional schizophrenia subtypes from DSM‐5 and ICD‐11. Schizophr Bull. 2013;39(4):751‐753.
19. Maes M, Cosyns P, Maes L, D'Hondt P, Schotte C. Clinical subtypes of unipolar depression: part I. A validation of the vital and nonvital clus-ters.Psychiatry Res. 1990;34(1):29‐41.
between the vital and nonvital depression groups. Psychiatry Res. 1990;34(1):43‐57.
21. Olsson PB. The personality factor in schizophrenia, University of Nebraska Medical Center, Ph.D. Thesis, 1938.
22. American Psychiatric Association.Diagnostic and Statistical Manual of Mental Disorders: DSM‐IV‐TR. Washington, DC: American Psychiatric
Association; 2000.
23. Kittirathanapaiboon P, Khamwongpin M. The validity of the mini inter-national neuropsychiatric interview (M.I.N.I.) Thai version.Suanprung Hospital, Department of Ment Health. 2005;13(3):125‐135.
24. Andreasen NC. The scale for the assessment of negative symptoms (SANS): conceptual and theoretical foundations.Br J Psychiatry Suppl. 1989;7:49‐58.
25. Kay SR, Fiszbein A, Opler LA. The positive and negative syndrome scale (PANSS) for schizophrenia.Schizophr Bull. 1987;13(2):261‐276.
26. Overall JE, Gorham DR. The brief psychiatric rating scale.Psychol Rep. 1962;10(3):799‐812.
27. Zachrisson O, Regland B, Jahreskog M, Kron M, Gottfries CG. A rating scale for fibromyalgia and chronic fatigue syndrome (the FibroFatigue scale).J Psychosom Res. 2002;52(6):501‐509.
28. Hamilton M. The assessment of anxiety states by rating. Br J Med Psychol. 1959;1959(32):50‐55.
29. Hamilton M. A rating scale for depression.J Neurol Neurosurg Psychia-try. 1960;23(1):56‐62.
30. WHO. Study protocol for the World Health Organization project to develop a quality of life assessment instrument (WHOQOL).Qual Life Res. 1993;2:153‐159.
31. Van Reenen M. "EQ‐5D‐5L User Guide" (PDF). EQ‐5D. EuroQol Research Foundation, 2015.
32. CANTAB. Test‐batteries / schizophrenia: http://www. cambridgecognition.com/cantab/test‐batteries/schizophrenia. As accessed 5 October 2017.
33. CERAD. CERAD—an overview: the consortium to establish a registry for Alzheimer's disease, 1986. http://cerad.mc.duke.edu/
34. Duleu S, Mangas A, Sevin F, Veyret B, Bessede A, Geffard M. circulat-ing antibodies to IDO/THO pathway metabolites in Alzheimer's disease.Int J Alzheimers Dis. 2010;15. pii:501541
35. Benjamini Y, Hochberg Y. Controlling the false discovery rate: a practi-cal and powerful approach to multiple testing.J Royal Stat Soc Ser B (Methodological). 1995;57:289‐300.
36. Kaiser S, Heekeren K, Simon JJ. The negative symptoms of schizophre-nia: category or continuum?Psychopathology. 2011;44(6):345‐353.
37. Jablensky A. The diagnostic concept of schizophrenia: its history, evo-lution, and future prospects. Dialogues Clin Neurosci. 2010;12(3):271‐287.
38. Sartorius N, Chiu H, Heok KE, et al. Name change for schizophrenia. Schizophr Bull. 2014;40(2):255‐258.
39. Raphael T, Ferguson WG, Searle OM. Constitution‐factors in schizo-phrenia.Proc Ass Res Nerv Ment Dis. 1928;5:100‐132.
40. Corrales‐Medina VF, Valayam J, Serpa JA, Rueda AM, Musher DM. The obesity paradox in community‐acquired bacterial pneumonia. Int J Infect Dis. 2011;15(1):e54‐e57.
41. Richards M, Sacker A. Lifetime antecedents of cognitive reserve.J Clin Exp Neuropsychol. 2003;25(5):614‐624.
42. Leung A, Chue P. Sex differences in schizophrenia, a review of the lit-erature.Acta Psychiatr Scand Suppl. 2000;401:3‐38.
43. Häfner H. Gender differences in schizophrenia. Psychoneuroendocrinology Suppl. 2003;2:17‐54.
44. Dolnicar S. A review of unquestioned standards in using cluster analy-sis for data‐driven market segmentation. Faculty of Commerce, University of Wollongong, 2002.
45. Formann AK.Die Latent‐Class‐Analyse: Einfuhrung in die Theorie und Anwendung. Beltz: Weinheim; 1984.
S U P P O R T I N G I N F O R M A T I O N
Additional supporting information may be found online in the
Supporting Information section at the end of the article.
How to cite this article: Kanchanatawan B, Sriswasdi S, Thika S, et al. Towards a new classification of stable phase
schizo-phrenia into major and simple neuro‐cognitive psychosis:
Results of unsupervised machine learning analysis.J Eval Clin