Quim. Nova, Vol. 32, No. 9, 2310-2313, 2009
Artigo
*e-mail: [email protected]
CHARACTERIZATION OF THE MAJOR NUTRITIONAL COMPONENTS OF Caryocar brasiliense FRUIT PULP
BY NMR SPECTROSCOPY
Ana Luisa Miranda-Vilela*e Cesar Koppe Grisolia
Departamento de Genética e Morfologia, Instituto de Ciências Biológicas, Universidade de Brasília, 70910-900 Brasília - DF, Brasil
Inês Sabioni Resck e Márcio Antônio Mendonça
Instituto de Química, Universidade de Brasília, 70910-900 Brasília - DF, Brasil
Recebido em 6/10/08; aceito em 12/5/09; publicado na web em 30/9/09
Pequi (Caryocar brasiliense Camb.), a typical fruit of Brazilian Cerrado, is well known in regional cookery and used in folk medicine to treat various illnesses. Mass spectrometry and chromatographic methods have identiied the organic composition of pequi fruit pulp; however, NMR spectroscopy is used for the irst time to characterize the nutritional components of organic and aqueous-ethanolic extracts. This spectroscopic technique determined the triacylglycerols in the pequi organic fraction, which is constituted mainly by oleate and palmitate esters, and detected the carbohydrate mixtures as the major components of aqueous and ethanolic fractions, respectively. In this study, presence of phenolic compounds was only evidenced in the ethanolic fraction.
Keywords: Caryocar brasiliense pulp extracts; fatty esters; NMR spectroscopy.
INTRODUCTION
The species Caryocar brasiliense Camb., popularly known as “pequi”, is a typical tree found in the Brazilian Cerrado with a wide use, not only of the fruits, but also of the tree as a whole.1,2 The chemical composition of its fruit pulp reveals lipids (20 to 27%), proteins (2.2 to 6.0%), ibers (11.6%) and carbohydrates (19.7%), besides containing different antioxidant compounds like carotenoids, vitamin C and phenolic compounds (lavonoids and tannins).3-6 The aroma volatiles of pequi fruit, analyzed by GC and GC/MS, show ethyl hexanoate (52.9%) as the major constituent, followed by other components (ethyl octanoate, 4.6%; tetrahydrofurfurylalcohol, 4.3%; ethyl butanoate, 4.1%; butyl palmitate, 3.7%; isobutyl stearate, 2.6% and 3-methylvaleric acid, 2.6%).7 Its fatty acidcomposition. deter-mined by gas and liquid chromatography. showed monounsaturated oleic acid (48.7-54.0%), saturated palmitic acid (39.0-44.3%), besides minor constituents such as palmitoleic, linoleic, linolenic, stearic and araquidic acids, among others.1,8,9 HPLC and spectrometric methods (GC/MS and LS-ESI/MS/MS) have already been used for the iden-tiication of the triacylglycerol (TGA) composition of pequi pulp. A triacylglycerol analysis of pequi oil by electrospray and tandem mass spectroscopy, reported by Segall et al., gave its TAG composition and respective fatty acid positions in the following sequence: POO (pal-mitoyl dioleoyl glycerol, 46.6%), POP (dipal(pal-mitoyl oleoyl glycerol, 45.2%), OOO (trioleoyl glycerol, 5.6%) and OOS (dioleoyl stearoyl glycerol, 0.52%).9 Although NMR provides valuable information to deduce the lipid structures,10-13 it has never been used in this context for Caryocar brasiliense.
NMR techniques (1D and 2D) have shown themselves a powerful tool in the structural elucidation of fatty acids and triacylglycerols (vegetable oils) and in the quantitative analyses of lipid mixtures.10-13 Although this spectroscopic method is strongly in agreement with gas chromatographic results, it does not require transesteriication of vegetable oil into respective volatile ester derivatives, as is com-monly the case for chromatographic methodologies. Acyl positional distribution (1,3-acyl and 2-acyl) of glycerol esters of some vegetable oils was detectable by INADEQUATE (Incredible Natural Abundance
Double Quantum Transfer Experiment), in uni and bidimensional experiments, revealing these acyl carbons to have different chemical shifts.13 Besides, for these analyses the unsaturated fatty chain is abundant in position 2, corroborating the method based on the action of pancreatic lipase, used to assess the distribution of fatty chains on the glycerol moiety.13
The purpose of this work was to use this technique to characterize the major nutritional componentsof ive extracts of pequi fruit pulp.
EXPERIMENTAL
Chemical products
All reagents and solvents were analytical or chromatographic grade and used as purchased, except when they required further puriication.
Plant material
Pequi (Caryocar brasiliense Camb.) fruit were obtained in natura from vendors in Brasília/DF (Brazil) and surrounding areas. The internal mesocarp was peeled to obtain the pulp, which was immediately extracted.
Extraction procedures
In the extraction procedures 200 mL of solvent per 100 g of pulp were used to obtain the ive extracts of pequi fruit pulp. The following solvents were used: hexane, for hexanic extract (HEP); chloroform, for chloroformic extract (CEP); distilled water, for aqueous extract (AEP); ethanol, for ethanolic extract (EEP); and a mixture of distilled water and ethanol (1:1), for hydro-ethanolic extract (HEEP).
The aqueous extract was obtained by infusion, and the other extracts by cold maceration. After extraction, the extracts were sub-mitted to evaporation under reduced pressure for solvent removal, and dried at high vacuum. Themass yield of each extract was then veriied and the extracts were immediately frozen at -86 °C.
Characterization of the major nutritional components of Caryocar brasiliense 2311 Vol. 32, No. 9
(hexanic and chloroform extracts) was also submitted to esteri-ication reaction with BF3-methanol.14 Methyl ester derivatives of fatty acids were separated using a Varian Star 3400 CX Gas Chromatography (GC) and a capillary fused silica column SP-2380 (30 m x 0.25 mm x 0.2 µm ilm thickness) and their compositions were calculated on a weight percent basis using standard fatty acids from Sigma-Aldrich.
Extracts analysis by nuclear magnetic resonance spectroscopy
1H and 13C NMR experiments were carried out in a Varian Mercury plus spectrometer (7.05 T), at room temperature, with the acquisition parameters (45° pulse width and 1.0 s relaxation delay). In 1H (300 MHz) spectra the chemical shifts (expressed in ppm) were referenced to the internal standards: TMS (tetramethylsilane) and DSS (2,2-dimethyl-2-silapentane-5-sulfonate). 13C (75 MHz) spectra with CDCl3 (deuterochloroform) and CH3OD (methanol deuterated) were referenced to standard absorptions at δ77.0 and δ49.0, respectively, and with D2O (deuterated water) to DSS. To run a quantitative 13C NMR, gated decoupling was used to remove the nuclear overhauser enhancement, with longer pulse delays (90º) and long spin-lattice relaxation time (20 s). The assignments of the 1H and 13C were ac-complished by using a combination of COSY, HMQC and HMBC techniques, carried out with gradient mode.
RESULTS AND DISCUSSION
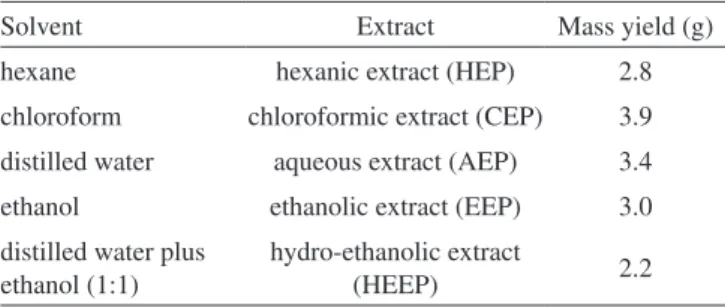
Results of extraction solvents and mass yield are shown in Table 1. During the solvents removal in the extraction processes, AEP pro-duced a great deal of persistent scum, while EEP and HEEP propro-duced much less. HEP and CEP produced no scum. Since the solvents were removed under vaccum, the presence of saponins probably promotes scum in the pequi polar extracts, as has been previously described for Caryocar species.1,15
Although mass yield was similar for AEP and CEP, water retreat from the AEP took a long time, because the solvents were removed at room temperature and under vaccum (tap water). While only a few hours were necessary to remove chloroform for the CEP, there was a delay of 3 days for water to retreat completely from the AEP, which was frozen between solvent removal procedures to avoid contamination. Since one of the objectives of this study is to verify the best extract for future phytotherapic production, the mass yield and the time taken for solvent removal must be also taken into account.
The nature of pequi pulp oil (organic fraction), as well as its composition, were demonstrated by gas chromatography, where the major components are oleic (54.28%) and palmitic (41.78%) fatty acids, with the presence of minor constituents of palmitoleic (0.67%), linoleic (1.36%), linolenic (0.51%), stearic (1.28%) and araquidic (0.12%) ones. These values are close to the ones reported in the literature, considering the region and climate where pequi plants are found.1,8,9
1H and 13C NMR data of organic extracts of pequi oil are shown in Table 2 and the spectra are illustrated in Figure 1. The organic fraction (HEP and CEP) spectra, presented respectively in Figures 1a and 1b, conirmed the oleic (CH3(CH2)7CH=CH(CH2)7CO2H) and palmitic (CH3(CH2)14CO2H) acid constituents, as registered previously.10,12,13 The oleate moiety, related to the olein region, was observed in both experiments at δ5.30-5.40 as multiplet, and at δ129.3 and δ129.7, respectively. The aliphatic region (CH2 and CH3) of palmitic and oleic moieties, common in many vegetables oils, was shown between δ 0.80 and δ1.70 in 1H experiment, due to the strong overlap of such hydrogen resonances. Although the methyl group was shown in 13C spectrum at δ13.9, the methylene envelope at the range of δ 28.2-31.7 was not easily to elucidate, requiring the complete assignment in this region operating at a higher magnetic ield. The α-CH2 for the acyl groups was observed at δ2.31 as triplet, and the allyl hydrogens at δ1.98-2.10 as multiplet, which were also seen in 13C spectrum at δ33.7 (palmitic)/δ33.9 (oleic) and at δ27.0, respectively. In this experiment, the acyl function correspondent to esters was present at δ172.7 (2-acyl) and at δ172.3 (1,3-acyl). The glycerol moiety exhibited two doublet of doublets at δ4.14 (J= 5.8 and 11.8 Hz) and at δ4.30 (J= 4.2 and 12.0 Hz) for CH2 hydrogens, and a multiplet at δ5.23-5.30 for CH hydrogen. Their respective carbon resonance peaks were displayed at δ61.8 (CH2) and at δ68.7 (CH).
Figure 1. Nuclear Magnetic Resonance (NMR) spectra of the organic fraction
of pequi pulp (Caryocar brasiliense Camb.) in CDCl3 solvent: a)1H NMR
spectrum of the hexanic (HEP) and chloroform (CEP) extracts; b)13C NMR
spectrum of the hexanic (HEP) and chloroform (CEP) extracts
Table 1. Results of mass yield obtained after extraction of pequi fruit pulp (Caryocar brasiliense Camb.)
Solvent Extract Mass yield (g)
hexane hexanic extract (HEP) 2.8
chloroform chloroformic extract (CEP) 3.9
distilled water aqueous extract (AEP) 3.4
ethanol ethanolic extract (EEP) 3.0
distilled water plus ethanol (1:1)
hydro-ethanolic extract
(HEEP) 2.2
Miranda-Vilelaet al.
2312 Quim. Nova
The quantiication of unsaturated (oleate) and saturated (palmita-te) esters in the pequi oil by 1H NMR was determined from Knothe’s equation: AC18:1 = Aunsat = (Iexper. allylic/4) and Asat = 100 - Aunsat, respecti-vely, in which A corresponds to the amount of the monounsaturated ester in the organic fraction expressed in percentage and Iexper. allylic is related to experimentally determined integration value of the peak region relative to the allylic hydrogens.12 In our experiment the results of 1H NMR for unsaturated was in the range of 58-60% and for saturated was in the range of 40-42%, both values being in fair agreement with our GC results (54 and 41%). However, the minor components such as palmitoleic (0.67%), linoleic (1.36%), linolenic (0.51%), stearic (1.28%) and araquidic (0.12%) were not detectable. The quantitative 13C NMR technique gave the palmitic-oleic ratio as 40:60, based on quantitative integration of the α-CH2 to the respective acyl groups observed at δ33.7 (palmitic)/ δ33.9 (oleic).
1H and 13C NMR spectra of AEP, EEP and HEEP showed these extracts constituted mainly by carbohydrates as a complex mixture, probably promoted by polymerization, which present a typical absorption at δ3.00-5.50 and δ50.0-110.0, respectively. For EEP, 1H and 13C NMR spectra obtained in CH
3OD gave some signals related to aromatic region at δ7.0−9.0 and δ120.0-145.0, which represent the phenolic compounds described for pequi.4,6 In pequi fruit extracts, phenolic (lavonoids, quercetin and quercetin-3-O-arabinose) and acid compounds (gallic and quinic acids) were characterized by ESI-MS.6 However, in the present work it was not possible to determine the chemical structure of such substances in the ethanolic fraction, due to their low concentration and the overlap with other resonance peaks. Other NMR analyses using a mixture of ethanolic extract with those natural products, to compare the intensities of all resonances before and after addition, are under investigation to obtain spectra with suitable signal-to-noise ratio and will be reported in due course.
Phenolic substances of plants can appear free or in the form of glycosides, exhibiting an array of solubility in solvents with different polarity and constituting one of the major groups of compounds that act as primary antioxidants of free radical terminators.16 The assay used for the determination of total phenolic content employs Folin and Ciocalteu’s phenol reagent, the response of which depends on the chemical structure of phenols (i.e. the higher the number of functional – OH groups, the higher the total phenolic content).16
Until now, total phenolic contents have been generally assayed
according to the Folin–Ciocalteu method16,17 or, on a smaller scale, by means of chromatographic and mass spectrometric methods.18 NMR spectroscopy showed that, besides being a useful tool for de-termining the organic compound structure,10,12,13 it can also be used in the detection of phenolic compounds present in ethanolic extract.
CONCLUSIONS
Even though numerous chromatographic and mass spectrometric techniques have already been used for the identiication of Caryocar brasiliensis pulp components, 1H and 13C NMR have not been used yet. Our study demonstrates that this technique was eficient to characterize the major nutritional components of the ive extracts of pequi fruit pulp, to identify the presence of phenolic compounds in the ethanolic fraction and to determine that the major ester components of the organic fraction are mainly oleate and palmitate.
ACKNOWLEDGMENTS
This work was supported by the University of Brasília, CNPq (National Council of Technological and Scientiic Development), FINATEC (Scientiic and Technological Enterprises Foundation) and FINEP (Funding for Studies and Projects: CT-INFRA 970/2001).
REFERENCES
1. Araújo, F. D.; Econ. Bot. 1995, 49, 40.
2. Santana, J. G.; Naves, R. V.; Pesq. Agropec. Trop. 2003, 33, 1; Vera, R.; Souza, E. R. B.; Fernandes, E. P.; Naves, R. V.; Júnior, M. S.; Caliari, M; Ximenes, P. A.; Pesq. Agropec. Trop. 2007, 37, 93.
3. Khouri, J.; Resck, I. S.; Poças-Fonseca, M.; Sousa, T. M. M.; Pereira, L. O.; Oliveira, A. B.B.; Grisolia, C. K.; Genet. Mol. Biol. 2007, 30, 442; Almeida, S. P. Em Cerrado: ambiente e lora; Sano, S. M.; Almeida, S. P., eds.; Embrapa-CPAC: Planaltina, 1998, cap. 6; Ramos, M. I. L.; Umaki, M. C. S.; Hiane, P. A.; Ramos-Filho, M. M.; Bol. Centro Pesqui. Process. Aliment. 2001, 19, 23; Azevedo-Meleiro, C. H.; Rodrigues-Amaya, D. B.; J. Food Compos. Anal. 2004, 17, 385; Oliveira, M. N. S.; Gusmão, E.; Lopes, P. S. N.; Simões, M. O. M.; Ribeiro, L. M.; Dias, B. A. S.; Rev. Bras. Frutic. 2006, 28, 380.
4. Lima, A.; Silva, A. M. O.; Trindade, R. A.; Torres, R. P.; Mancini-Filho, J.; Rev. Bras. Frutic. 2007, 29, 695; Roesler, R.; Malta, L. G.; Carrasco,
Table 2. Results of analysis of the organic fraction (chloroformic and hexanic extracts) of the pequi fruit pulp (Caryocar brasiliense Camb.) by 1H and 13C NMR (CDCl
3)
δH Hydrogen nature J (Hz) Carbon nature δC
0.88 t CH3 7.0 CH3 13.9
1.21-1.31 m CH2__CH
3 - CH2
__CH
3 22.5
1.21-1.31 m 7CH2 - 7CH2 28.2-31.7
1.60-1.70 m CH2__CH
2
__CO - CH
2 __CH
2
__CO 24.7
1.98-2.10 m CH2__C=C - CH
2
__C=C 27.0
2.31 t CH2__C=O - CH
2
__C=O 33.7/33.9
4.14 dd CH__C__O 5.8 and 11.8 CH__C__O 61.8
4.30 dd CH__C__O 4.2 and 12.0 CH__C__O 61.8
5.23-5.30 m CH__C__O - CH__C__O 68.7
5.30-5.40 m CH=CH - CH=CH 129.3/129.7
- - C=O 172.3/ 172.7
Characterization of the major nutritional components of Caryocar brasiliense 2313 Vol. 32, No. 9
L. C.; Holanda, R. B.; Sousa, C. A. S.; Pastore, G. M.; Ciênc. Tecnol. Aliment. 2007, 27, 53.
5. Miranda-Vilela, A. L.; Resck, I. S.; Grisolia, C. K.; Genet. Mol. Biol. 2008, 31, 956.
6. Roesler, R.; Catharino, R. R.; Malta, L. G.; Eberlin, M. N.; Pastore, G.; Food Chem. 2008, 110, 711.
7. Maia, J. G. S.; Andrade, E. H. A.; Silva, M. H.; J. Food Compos. Anal. 2008, 21, 574.
8. Facioli, N. L.; Gonçalves, L. A. G.; Quim. Nova 1998, 21, 16. 9. Segall, S. D.; Artz, W. E.; Raslan, D. S.; Ferraz, V. P.; Takahashi, J. A.;
J. Sci. Food Agric. 2006, 86: 445.
10. http://www.lipidlibrary.co.uk, accessed in August 2009; Jie, M. S. F. L. K.; Mustafa, J.; Lipid 1997, 32, 1019.
11. Zamora, R.; Gómez, G.; Dobarganes, M. C.; Hidalgo, F. J.; J. Am. Oil Chem. Soc. 2002, 79, 261; Vigli, G.; Philippidis, A.; Spyros, A.; Dais, P.; J. Agric. Food Chem. 2003, 51, 5715.
12. Knothe, G.; Kenar, J. A.; Eur. J. Lipid Sci. Tech.2004, 106, 88. 13. Mannina, L.; Luchinat, C.; Emanuele, M. C.; Segre, A.; Chem. Phys.
Lipids 1999, 103, 47.
14. Christie, W. W.; Gas chromatography and lipids: a practical guide, Oily: Great Britain, 1989.
15. Magid, A. A.; Voutquenne-Nazabadioko, L.; Renimel, I.; Harakat, D.; Moretti, C.; Catherine Lavaud, C.; Phytochemistry 2006, 67, 2096; Magid, A. A.; Voutquenne, L.; Harakat, D.; Pouny, I.; Caron, C.; Moretti, C.; Lavaud, C.; J. Nat. Prod. 2006, 69, 919.
16. Furlong, E. B.; Colla, E.; Bortolato, D. S.; Baisch, A. L. M.; Souza-Soares, L. A.; Vetor 2003, 13, 105.
17. Karagözler, A. A.; Erdag, B.; Emek, Y. Ç.; Uygun, D. A.; Food Chem. 2008, 111, 400; Miraliakbari, H.; Shahidi, F. Food Chem. 2008, 111, 421.