A Work Project, presented as part of the requirements for the Award of a Master’s Degree in Management from the NOVA – School of Business and Economics.
THE INFLUENCE OF PRICE CHANGES ON
CONSUMERS’ PURCHASE DECISIONS
KATARZYNA TULWIN, 1840
A Project carried out on the Marketing course, under the supervision of:
Luis Martinez
Abstract
The development of an effective pricing strategy requires the acquaintance of
consumers’ price perception as well as the range of elements that influence the price
sensitivity. This paper analyses the relationships between product features, individual
characteristics and the level of price increase/decrease that induces the consumers to
change their purchase decisions. The results of a dedicated survey show, that price
sensitivity, individual preferences, type of product and direction of price change and
individual characteristics of consumers (gender, age, professional situation) have a
significant impact on a threshold at which people are willing to choose the less
attractive, but cheaper alternative to their favorite product or give up the variety in
consumption. From a consumer behavior perspective, these findings play a fundamental
role in pricing.
Introduction
A seminal study that gave rise to the analysis of pricing and its influence on consumers’
purchase decision making was conducted by E.H. Weber (Miller, 1962). According to
his law, consumers’ perception of difference is limited and any change in given
stimulus can be observed only when it exceeds a threshold, presented as a percentage of
the initial value. Weber’s Law can also have an application to pricing strategies in
which the just noticeable difference for price reduction equals to about 20% (Falkowski
et al, 2009) and is lower for price increase. This theory suggests, that it is sufficient for
successful pricing strategy to stay below the Weber’s fraction while increasing the price
and to exceed the fraction when the price is being reduced. However, reality shows that
following this kind of rules does not necessarily triggers the desired consumer behavior,
as the decision making process in terms of buying is influenced by wide number of
factors.
From a practical point of view, just being aware of price reduction or increase does not
have to lead to the change of buying habits. Moreover, Weber’s fraction should vary
depending on the customer, product and many other situational elements. However, the
correct management of customers’ price perception can lead to improved value
perception of the products and increased willingness to buy (Varki et al., 2001).
Therefore sales managers are not as much concerned with the just noticeable difference,
as with the change in price that would motivate the customers to change their purchase
decisions. This is the main issue being explored in this paper, with a purpose to serve
the marketers in analyzing the market and setting the prices for their products.
This research is focused not only on looking for the most probable price changes that
internal and external factors that influence the customers’ perception of prices and their
final purchase decisions. Some of them summarize previous research and existing
literature about this topic, the others are based on the hypotheses stated in the
dissertation and on results of the dedicated survey. All the most important regularities
and conclusions observed are presented in the last part of the paper.
Literature review and research hypotheses
According to the economic theory, price of the product reflects its value for the
consumer. Each person is characterized by individual level of price sensitiveness and
will react differently to prices’ changes. Rudnicki (2000) singles out main elements,
related to consumer, market and product, that determine those reactions: (i) number of
existing substitutes; (ii) type of product; (iii) time that has elapsed from the change; and
(iv) consumer’s income level. Duvvuri et al. (2007) also suggests that consumers’ price
sensitivities are strongly and positively correlated across product categories.
Additionally, they can vary depending on some social aspects of transactions, such as
buyer-seller interaction (Hsieh et al., 2004). Based on this information and predicting
that more price sensitive customers will be more susceptible to decision changes under
the influence of money incentives, the first hypothesis of this research was formulated:
H1: The higher the price sensitivity of the buyer, the lower price change is needed to
change purchase decision.
Another key factor which constitutes 50 percent of total price perception (D’Andrea et
al., 2006) and participates in decision making process is a reference price. It can be both
internal, in other words based on consumer’s memory (mainly implicit), preferences and
with other products (Santana, 2011). Danes et al. (2012) emphasizes the role of
perceived substitute effect according to which the price sensitivity increases when the
product’s price is high relative to substitutes. The internal reference price of consumers
and the strength of own preferences can increase significantly (in contrast to the price
sensitivity) in case of products consumed in public and conspicuous consumption
(O’Cass et al., 2004). The social status is worth a lot for many people and they are
willing to pay extra for it. The growing attention being paid to the consumers’ internal
associations with products and motives that influence the willingness to pay gave rise to
another hypothesis:
H2: The stronger the consumer’s preference, the bigger price change is required to
change the purchase decision.
A large number of academic papers focus on the influence of buyers’ personal
characteristics on the perception of discounts, such as already mentioned price
sensitivity, consumer’s involvement (Rohani et al., 2012), loyalty to the brand,
consumer’s level of experience in purchasing from the particular product category and
the most important one – budget constraints (Campo et al, 2007). Some of them (Scheer
et al., 2010) prove, that the choice between percentage-off or dollars-off format should
be made according to the wealth of the target: $-off discounts are more effective in case
of lower-income customers, and %-off should be used to attract higher-income
customers. Moreover, the latter source mentions the common belief, according to which
attractiveness of an absolute discount is inversely proportional to the initial price of the
product. That gave rise to another assumption:
H3a: The lower the initial price, the higher percentage change is needed to influence the
However, according to Hoyer et al, (2008), an important theory contradicts the previous
assumption. It states, that the lower the value of the particular product, the less effort the
consumers make while making a purchase decision and more prone they are to use price
as a simplifying strategy. That means, that in case of such inexpensive and frequently
purchased products, consumers tend to choose the cheapest brand or the one on sale to
make the decision making process easier and shorter. Therefore, the alternative
hypothesis has been formulated, to see which tendency is stronger or whether they
balance each other:
H3b: The lower the initial price, the lower the decision making effort and the lower
percentage change is needed to influence the decision.
From the point of view of Bolton et al, (2003), consumers tend to claim that the selling
price of good or service is considerably higher than its fair price. This is most probably
an effect of limited knowledge about profits, costs and inflation and their contribution to
the market. Therefore, it is highly understandable, that consumers perceive price
discounts as definitely fairer than price increases, and are considerably less perceptive
when the numbers on the labels go down than in the opposite situation. This effect is
even intensified when consumers believe that a firm had a negative motive for price
increase, what leads to lower shopping intensions (Campbell, 1999) or when competing
brands introduce intense price promotion (Han et al., 2001). A company’s reputation
and clients’ loyalty can have a positive effect on fairness perception, however this effect
does not exist when price increases are high (Martin et al., 2008). Moreover, fairness is
also crucial in terms of evaluation of lower pricing results – the differential promotion
can be perceived negatively by non-targeted customers, who refer their benefits to those
across-consumer price comparisons and their effects can also vary depending on the
culture (Bolton et al., 2009). The research hypothesis related to fairness phenomenon
looks as following:
H4: The consumers are more sensitive to price increase than to the analogous price
reduction.
Some other price-related issues will not be analyzed in the form of hypotheses, but
cannot be ignored in the research due to their importance to the topic. First of all, a lot
of pricing practices are deliberately used by marketers to influence consumers’ price
perception and willingness to buy. Ahmetoglu et al. (2010) mentions drip pricing, opt
in/opt-out, reference pricing, the use of word free, bait pricing, complex pricing and
time-limited offers among the most effective and common ones. Additionally,
consumers tend to favor monetary-value framed promotions in case of high price items
and percentage-of-price framed discounts when purchasing low price products (Jaber et
al., 2013). Format of the price also matters in consumer’s decision making process –
Coulter et al., (2007) shows that buyers report larger perceived discounts when the right
digits are small (below 5) and they associate greater value with those greater perceived
discounts. On the other hand, consumers perceive odd prices (ending with 0,99) as
considerably lower than even ones (Hoyer et al, 2008), but only when such one cent
reductions lead to the change in the leftmost digits (Thomas et al., 2005). As a rule,
none of special pricing practices should be used too often, otherwise the consumers will
treat and perceive special prices as the regular ones, giving up the purchase unless the
promotion occurs. In some cases, the effects of price changes are impossible to predict
in advance due to imperfect consumer’ rationality, reflected by the fact that not all of
some experiments (Gaur et al, 2004) show that in some situations demand can increase
with price or sale can drop when the price decreases. The well-known examples of such
situation are Veblen luxury goods or the inferior Giffen goods, which violate the law of
demand. This phenomenon can be also explained by existence of the other, besides
utilitarian, function of price, called informational. Price is often used as a value
indicator, what means that without any quality assurance and when discounts are
manipulated in the everyday manner, the negative price-quality effect is likely to occur,
dominating consumer perception (Darke et al, 2005). Therefore, some research
(Sigurdsson et al, 2010) undermine the effects of price reductions on consumers’
decisions, emphasizing the necessity to examine all marketing mix factors in sales
forecasting.
Survey and results
Methodology
In order to test the hypotheses and proceed with the research, an online anonymous
survey has been created. All the respondents participated in it voluntarily, not being
driven by any personal benefits. 154 people between 18 and 34 years old, 95 women
and 59 men filled in the questionnaire, of whom 94 were Polish, 44 Portuguese and 16
belonged to other nations.
All the participants were asked to specify their professional situation and try to evaluate
their price sensitivity using 1-5 scale. After that, they were being redirected to the main
part of the survey, concerning the situations of purchase and the scale of price changes
needed to change their buying decisions while choosing between two available
increase and each respondent had to face both of them. Moreover, the participants were
suggested to associate different level of preference to the products in each pair
presented. The questions included in the main section have been formulated in the
following way: “What is the minimal value of price reduction/increase that would
induce you to buy product B instead of product A?”, while A was initially preferred, or
“What is the minimal value of brand B price reduction (or brand A price increase) that
would induce you to become loyal to brand B and give up (in a long term) buying
products of brand A?” in case of lack of preferences. The price changes were presented
in both nominal (€) and percentage values and no odd prices were used to avoid
potential undesirable biases. All the products in a questionnaire are commonly used and
familiar for average consumer and no associations to any real brands have been
provoked. The character of the survey is strictly hypothetical, however all the efforts
had been made to focus respondents’ attention on the role of price values in their
decision making process. To read the original survey form, see the Appendix.
Verification of hypotheses
Hypotheses testing required creating a numerical value for each respondent
(Average_for_respondent) which reflects the mean percentage change of price needed
to influence the purchase decision of particular consumer. To enable the calculations, all
answers displaying lack of willingness to change the buying decision even in the face of
50% price change have been perceived as a sign of strong price insensitivity and
evaluated 100%. This step is additionally justified by the fact that the price changes of
more than 50% do not happen often on real markets, so this group of price insensitive
consumers probably would not have an opportunity to change their purchase decisions
H1: The higher the price sensitivity of the buyer, the lower price change is needed to
change purchase decision.
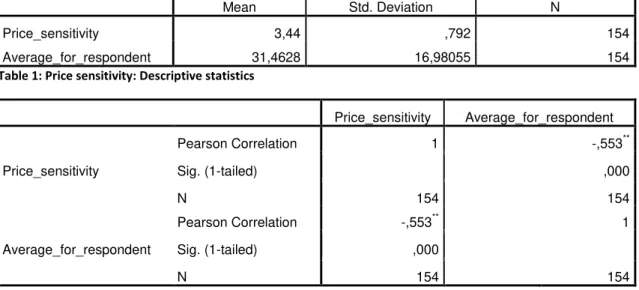
Mean Std. Deviation N
Price_sensitivity 3,44 ,792 154
Average_for_respondent 31,4628 16,98055 154
Table 1: Price sensitivity: Descriptive statistics
Price_sensitivity Average_for_respondent
Price_sensitivity
Pearson Correlation 1 -,553**
Sig. (1-tailed) ,000
N 154 154
Average_for_respondent
Pearson Correlation -,553** 1
Sig. (1-tailed) ,000
N 154 154
**. Correlation is significant at the 0.01 level (1-tailed). Table 2: Correlation: Price sensitivity and Average for respondent
The results of the analysis show that respondents tend to evaluate their price sensitivity
as medium or above the average – the mean for all 154 surveyed is 3.44 on 1 to 5 scale.
Moreover, the respondents expect on average 31.46% price change to buy the product
different than the one that they would choose without such price incentive, however the
standard deviation proves, that the number varies considerably among consumers.
According to Pearson Correlation, the relationship between the price sensitivity and
average answers is moderate and statistically significant (p = 0.000 < 0.01). The r-value
amounts to -0.553 what indicates the negative dependency between the variables – the
more price sensitive the consumer is, the smaller change of price is enough to influence
his/her purchase decision. It confirms entirely what has been stated in the first
hypothesis of this report and shows, that the respondents’ assessment of their own price
H2: The stronger the consumer’s preference, the bigger price change is required to
change the purchase decision.
Verification of the second hypothesis required inserting three new variables – the
average percentage change of price quoted by each respondent with a distinction
between questions according to the suggested preference.
Strong_preference Slight_preference Lack_of_preference
Mean 42,2403 29,3723 22,7760
N 154 154 154
Std. Deviation 20,79518 18,73721 18,21512
Table 3: Preferences: Means comparison
Generated report reflects the substantial differences between the mean answers in three
given categories. In case of lack of preference, an average respondent is willing to
become loyal to the cheaper product in the long term if its price decreased by 22.78%,
or if the price of the competitive product increased by the same percentage (assuming
the equal initial price of both products). However, when respondents prefer slightly one
of the products for its characteristics unrelated to price (such as brand familiarity), the
price incentive needed to change their buying decision in favor of the other product has
to be stronger and amounts on average to 29.37% (even though the general quality of
the products is the same, and the preference is an effect of the subjective evaluation).
The situation becomes even clearer, when people believe, that the key characteristics of
one product suit their needs much better, so that their preference is strong. In this case,
the average respondent is not willing to choose the less-preferred product, unless its
price decreases by 42.24% or more (or the price of the favorite product increases by
analogous fraction). This observation is in line with the analyzed hypothesis and proves
translates into the higher level of satisfaction during the moment of purchase and while
using the product, consumers are not willing to compromise on it. The stronger the
preference, the bigger price advantage is required to compensate the loss in satisfaction.
H3a: The lower the initial price, the higher percentage change is needed to influence the
decision.
H3b: The lower the initial price, the lower the decision making effort and the lower
percentage change is needed to influence the decision.
By analogy to the verification of the previous hypothesis, testing of the next two would
be impossible without three new variables – the average percentage change of price
quoted by each respondent divided into three categories according to the type (and also
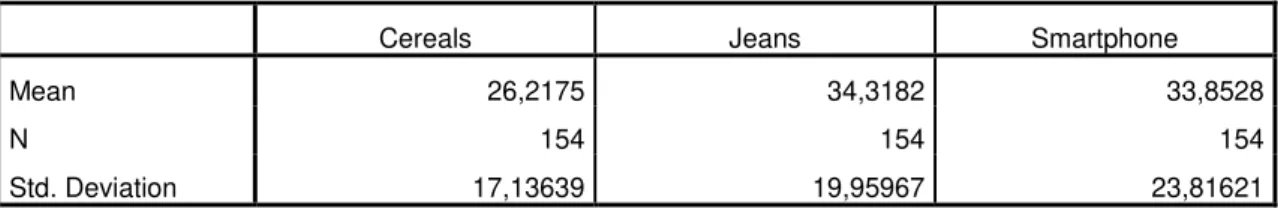
the initial price level) of the product. The products used in the survey were cereals (with
initial price of 3.50€), jeans (50€) and a smartphone (300€).
Cereals Jeans Smartphone
Mean 26,2175 34,3182 33,8528
N 154 154 154
Std. Deviation 17,13639 19,95967 23,81621
Table 4: Products: Means comparison
Looking at the results placed in the table, it is easy to notice, that the cereals were given
the lowest mean answer among all the products. On average, the 26.22% change in
price is enough to change the consumers purchase decision while buying them. It could
be explained by the hypothesis 3b: cereals are relatively cheap, people by them often
and use each package for the short time. The decision making process in this case is
usually quick and of low effort and the risk related to the wrong choice is small -
On the other hand, the results for two other products do not confirm 3b hypothesis, as
jeans (product of the medium price) gathered the highest average value, namely
34.32%. This is slightly more that the result of the smartphone which equals 33.85%,
what denies the linear relationship between the value of the product and expected price
change.
This observation can be explained by the influence of the hypothesis 3a, which states
that people need stronger percentage incentives in case of cheaper products to notice the
substantial nominal change in price. It would indicate that both opposing hypotheses
partially neutralize each other. The other possible reason is the importance of some
other, unforeseen factors, such as type of consumption and other than pure pragmatic
functions of the product. Jeans, as a part of human’s external appearance do not only
satisfy the need of covering the body and providing personal comfort, but also co-create
the style of the person and have an impact on the way in which he or she is perceived
and appraised by the others. In case of such “publicly consumed” goods people are
more concerned about how they suit them and their image, what leads to lower price
sensitivity. What is more, clothes is the category of goods for which the variety is
potentially more important than for two other categories, so the consumers are not
willing to become loyal to just one brand. People usually have two or more pair of jeans
at the same time, but use one smartphone and do not buy new cereals until the previous
package is empty.
H4: The consumers are more sensitive to price increase than to the analogous price
reduction.
For the sake of the last hypothesis, two new variables have been created – the average
price reduction and price increase. It enabled the comparison of means for both
categories, which confirms the validity of the hypothesis.
Price_decrease Price_increase
Mean 36,6162 26,3095
N 154 154
Std. Deviation 18,72525 17,75765
Table 5: Price decrease and increase: Means comparison
The results of the analysis reflect the fact, that people notice the increase of the price
much easier than the analogous decrease, and relatively small percentage increase is
required to influence their purchase decisions. The average for the price reduction
amounts to 36.61%, while the same value for price rise equals 26.31%, so over 10%
less. However, the significant standard deviation shows that the answers vary a lot
depending on the respondent.
This kind of phenomenon occurs, because price increase is perceived as something
more controversial and unfair in consumers’ opinion than price decrease. On the
modern market, the consumers are the ones that set the rules, so they are being
accustomed to the discounts, special offers and favorable bargains. At the same time,
the price increases are introduced in the way that is not so easily noticeable by
consumers (for example by changes in packages size), so usually the buyers are not so
much aware of price fluctuations as in the case of the survey.
Other observations and relationships
To take the maximal advantage of data gathered in survey, the dependencies between
the Average_for_respondent variable and personal characteristics of respondents
o Gender
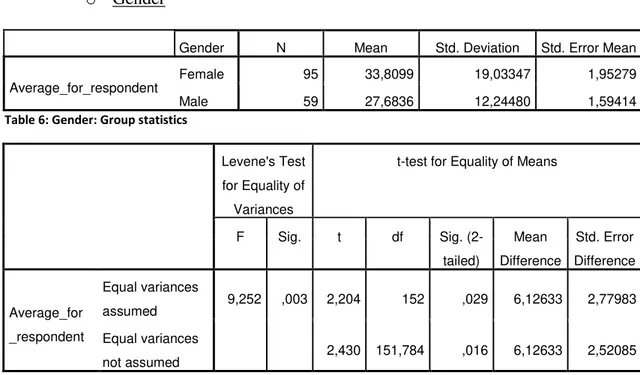
Gender N Mean Std. Deviation Std. Error Mean
Average_for_respondent Female 95 33,8099 19,03347 1,95279 Male 59 27,6836 12,24480 1,59414 Table 6: Gender: Group statistics
Levene's Test
for Equality of
Variances
t-test for Equality of Means
F Sig. t df Sig.
(2-tailed)
Mean
Difference
Std. Error
Difference
Average_for
_respondent
Equal variances
assumed 9,252 ,003 2,204 152 ,029 6,12633 2,77983
Equal variances
not assumed 2,430 151,784 ,016 6,12633 2,52085 Table 7: Gender: Independent samples test
One of the results that have not been clearly intuitive from the early beginning of this
research is the dependency between gender and average answer of respondents.
However, the means in the first table above differ considerably for female and male,
what suggests that this kind of relationship actually occurs. It turns out, that women
need stronger price incentives to give up their initial purchase intensions and choose the
less preferred, but cheaper product – the average value amounts to 33.81%. The same
value for men equals 27.68%, what shows that men are more price sensitive.
The above mentioned conclusions are supported by the results of independent samples
test. For obtained significance level (0.003), which is lower than 0.05, we have to reject
the hypothesis that the variance for both samples are equal, what implies the existence
of statistically significant differences.
Owing to the fact that the explanation of registered dependency between gender and
made. It considers the differences between men and women for each preference and
each product separately.
Gender Strong_pr
eference
Slight_prefe
rence
Lack_of_p
reference
Cereals Jeans Smartphone
Female
Mean 44,8070 31,8421 24,7807 27,2807 38,0439 36,1053
N 95 95 95 95 95 95
Std. Deviation 22,34695 21,15109 20,58189 19,04650 22,55829 25,87632
Male
Mean 38,1073 25,3955 19,5480 24,5056 28,3192 30,2260
N 59 59 59 59 59 59
Std. Deviation 17,41346 13,22908 13,09624 13,48612 12,91689 19,73291
Total
Mean 42,2403 29,3723 22,7760 26,2175 34,3182 33,8528
N 154 154 154 154 154 154
Std. Deviation 20,79518 18,73721 18,21512 17,13639 19,95967 23,81621 Table 8: Gender: Means comparison
The results of means comparison indicate, that the level of preference is not important
for the explanation, as for each of them the difference between female and male answers
amounts to about 6% of initial price. However, the differences vary discernibly
depending on the product: for cereals it is 2.78%, for smartphone 5.88% and for jeans
even 9.72%. The possible conclusion of this data is that woman in general (and
particularly for some product categories, such as clothes) devote more time to decision
making process, analyze more products’ characteristics and are more attached to
looking for the products that suit the whole range of their needs. In the meantime men
are more focused on the core features of products, make their purchase process quick
and consider price as the more important decision making factor.
o Age
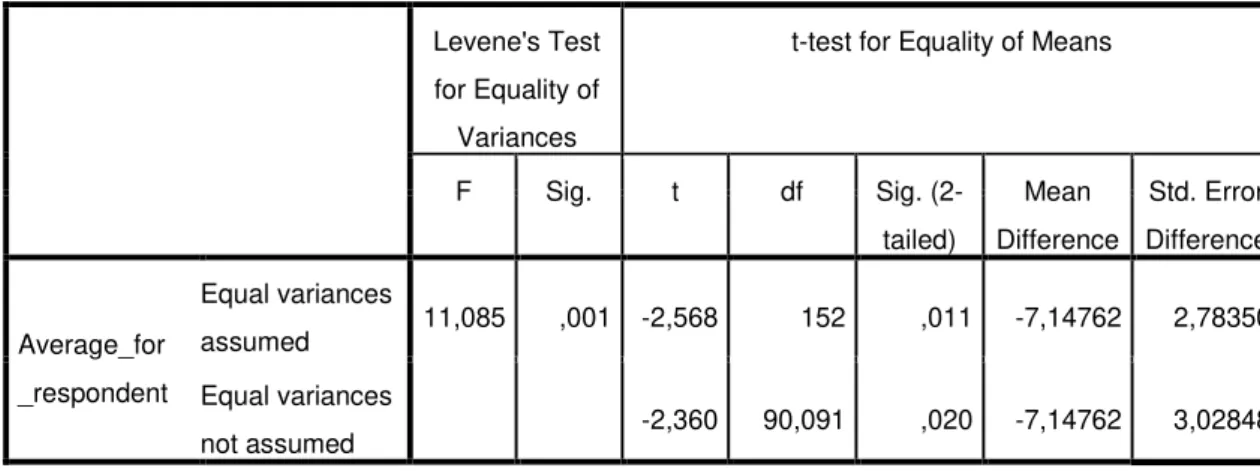
Age N Mean Std. Deviation Std. Error Mean
Levene's Test
for Equality of
Variances
t-test for Equality of Means
F Sig. t df Sig.
(2-tailed) Mean Difference Std. Error Difference Average_for _respondent Equal variances
assumed 11,085 ,001 -2,568 152 ,011 -7,14762 2,78350
Equal variances
not assumed -2,360 90,091 ,020 -7,14762 3,02848 Table 10: Age: Independent samples test
Age of respondents is another variable which influence the average decrease/increase of
price required to change the purchase decisions. For the younger group of people
surveyed (18-24 years old), the mean answer amounts to 28.82%, while the analogous
value for the group of 25-34 years old is 7% higher (35.96%). This tendency is also
confirmed by the results of the independent samples test with p value (0.001) lower than
0.05 and relatively high F value. In this situation the assumption about equal variances
of the samples cannot be maintained.
The above presented results are understandable and potentially related to the financial
situation of respondents from different age groups. Younger people usually do not have
their own and stable source of income yet, so they are often forced to base the buying
decisions primarily on price. This, in turn, is an effect of the professional situation that
will be analyzed next.
o Professional situation
Sum of Squares df Mean Square F Sig.
Average_for_
respondent *
Professional_
situation
Between Groups
(Combined) 3143,355 3 1047,785 3,836 ,011
Within Groups 40972,547 150 273,150
Total 44115,902 153
Eta Eta Squared
Average_for_respondent *
Professional_situation ,267 ,071
Table 12: Professional situation: Measures of association
A few different professional statuses have been considered in the survey: “I study”, “I
work”, “I work and study”, “I’m unemployed/looking for a job” and “Other” (this
category remained empty). The results of ANOVA test (p = 0.011<0.05) suggest that
the alternative hypothesis, assuming the significant differences between the means in
groups, should be accepted. The modest value of Eta Squared (0,071) proves that this
effect is moderate.
Average_for_respondent
Professional_situation Mean N Std. Deviation
I study 27,3527 66 13,59320
I work 38,1755 44 20,22514
I work and study 31,2573 38 16,69839
I’m unemployed/looking for a job 28,7500 6 14,53152
Total 31,4628 154 16,98055
Table 13: Professional situation: Means comparison
According to the results presented in the table above, the average answer is the lowest
for students and unemployed (27.35% and 28.75% accordingly). On the opposite side
there is a group of respondents who work (38.18%), while the students employed are
placed in the middle, with the mean value of 31.26%.
By analogy to the case of age, such results are probably caused by the differences in
budget at disposal for above mentioned groups. The wealthier the person, the less
fundamental the price is for him/her during the purchase decision making and the less
willing he/she is to give up the personal preferences. Of course it cannot be assumed
other than employment sources of income, such as family or inheritance), however the
general trend between the groups of difference professional situation is visible.
o Nationality
Sum of Squares df Mean Square F Sig.
Average_for
_respondent
*
Nationality
Between
Groups
(Combined)
83,900 2 41,950 ,144 ,866
Within Groups 44032,001 151 291,603
Total 44115,902 153
Table 14: Nationality: ANOVA table
Eta Eta Squared
Average_for_respondent *
Nationality ,044 ,002
Table 15: Nationality: Measures of association
Average_for_respondent
Nationality Mean N Std. Deviation
Other 33,5764 16 18,14377
Polish 31,0993 94 15,16004
Portuguese 31,4710 44 20,30016
Total 31,4628 154 16,98055
Table 16: Nationality: Means comparison
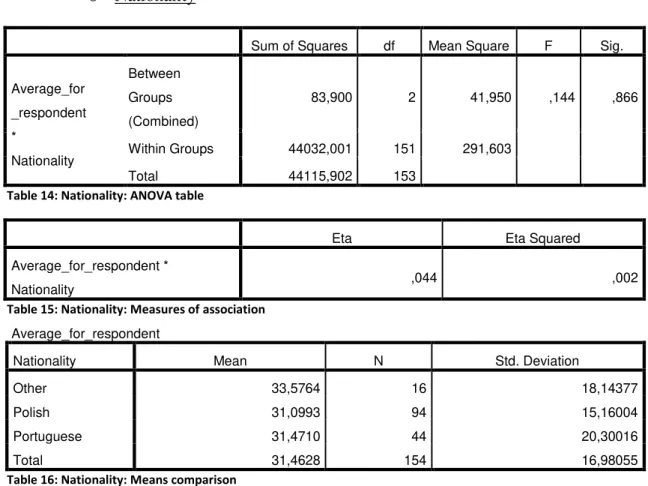
Nationality appeared to be the only one of the analyzed personal characteristics that
does not have an impact on the average answers given by respondents. The large value
of p (0,866) in ANOVA test, marginal F value and the small value of Eta Squared
constitute a clear proof that there are no significant differences between the nationalities
in terms of influence of price on consumers’ decision making.
The comparison of means for nationalities shows, that the average answer for Polish
and Portuguese respondents was almost equal (31.10% vs. 31.47%), with just slightly
higher value for other nationalities (33.58%). This is apparently the result of economic
disposable income, prices, propensity to save) which lead to comparable price
sensitivity and similar purchase behavior.
Conclusions and general discussion
This research analyzed important price–related issues that determine the purchase
decisions of consumers. The survey results prove, that each person requires price
incentives (increase or decrease) of different strength to choose another product than the
one initially preferred, depending on personal and situational factors. Most of the
hypotheses stated in the first part of the report have been confirmed and some additional
regularities in the gathered data have been observed.
First of all, more price sensitive buyers actually need lower price change to change their
purchase decision. Also, if the consumer has a strong preference towards one of the
products, the bigger reduction or increase is required to induce him/her to choose the
less preferred option. No regularity has been noticed between the initial price of the
product and the percentage price decrease/increase that motivates the consumers to
verify their shopping basket. Moreover, people are significantly more sensitive to price
increase than to the analogous reduction, what should be considered in all managerial
decisions concerning pricing strategy.
Basic personal characteristics, such as gender, age and career standing have a
considerable impact on consumer’s price sensitivity, which turned out to be stronger for
men, younger people, students and unemployed. At the same time, no big differences
have been observed in the survey in terms of nationality. Here there is much space for
further research, to see how price sensitivity differ between other, possibly more
The main limitation of the conducted research is the fully hypothetical character of the
survey – it remains uncertain whether the declared purchase decisions have a chance to
happen in reality. What would change if the consumers were exposed to the marketing
stimuli that are normally present in the shopping environment, such as publicity, brands,
packaging? What would happen if the customers knew about the price change before
coming to the shop? Most probably, a big number of other, not considered factors
exists, that could influence the results of the survey but would require the detailed
analysis of respondents: Is the buyer the user of the product? Is he/she the main person
responsible for doing shopping for the household? Were suggested initial prices for
given product categories average in his/her opinion? Moreover, for nationalities from
outside the Eurozone (such as Polish) the degree of familiarity with euro currency could
be considered, as well as the differences between the price levels in different countries.
To create an effective pricing strategy, a manager of a company should not only know
the product perfectly, but also have a complex profile of target group of customers. The
more factors are considered, the more likely the consumers are to react positively to
References
Miller, Richard L. 1962. “Dr. Weber and the Consumer”, Journal of
Marketing, 26(1): 57-61.
Falkowski, Andrzej and Tadeusz Tyszka. 2009. Psychologia zachowań
konsumenckich. Gdańsk: Gdańskie Wydawnictwo Psychologiczne.
Rudnicki, Leszek. 2012. Zachowania konsumentów na rynku. Warszawa:
Polskie Wydawnictwo Ekonomiczne.
Hoyer, Wayne D. and Deborah J. Maclnnis. 2008. Consumer Behaviour.
Mason, OH : South-Western Cengage Learning.
Sigurdsson, Valdimar, Gordon Foxall and Hugi Saevarsson. 2010. “In-Store
Experimental Approach to Pricing and Consumer Behavior”, Journal of
Organizational Behavior Management, 30(3): 234-246.
Gaur, Vishal and Marshall L. Fisher. 2005. “In-Store Experiments to
Determine the Impact of Price on Sales”, Production and Operations
Management, 14(4): 377-387.
Jaber, Mazen and Kylie Goggins. 2013. “Disguised-monetary discounts and
purchase decisions: What is petrol worth?”, Journal of Customer Behaviour,
12(2-3): 95-109.
Ahmetoglu, Gorkan, Simon Fried, John Dawes and Adrian Furnham. 2010. “Pricing Practices: Their Effects on Consumer Behaviour and Welfare”, Mountainview Learning paper prepared for the Office of Fair Trading.
D’Andrea, Guillermo, Martin Schleicher and Fernando Lunardini. 2006. “The role of promotions and other factors affecting overall store price image in Latin America”, International Journal of Retail & Distribution Management,
34(9): 688-700.
Bolton, Lisa E., Luk Warlop and Joseph W. Alba. 2003. “Consumer
Perceptions of Price (Un)Fairness”, Journal of Consumer Research, 29(4):
Darke Peter R. and Chung Cindy M.Y. 2005. “Effects of pricing and
promotion on consumer perceptions: it depends on how you frame it”, Journal
of Retailing, 81(1): 35–47.
Coulter, Keith S. and Robin A. Coulter. 2007. “Distortion of Price Discount
Perceptions: The Right Digit Effect”, Journal of Consumer Research, 34(2):
162-173.
Campo, Sara, and Maria Jesus Yague. 2007. “The perception of price
discounts according to consumer’s characteristics”, Journal of Revenue and
Pricing Management, 6(2): 86-99.
Scheer, Lisa K., Omar Shehryar and Charles M. Wood. 2010. “How budget constraints impact consumers’ response to discount presentation formats”,
Journal of Product & Brand Management, 19(3): 225-232.
Darke, Peter R. and Darren W. Dahl. 2003. “Fairness and Discounts: The
Subjective Value of a Bargain”, Journal of Consumer Psychology, 13(3):
328-338.
Campbell, Margaret C. 1999. “Perceptions of Price Unfairness: Antecedents
and Consequences”, Journal of Marketing Research, 36: 187-199.
Martin, William C., Nicole Ponder and Jason E. Lueg. 2008. “Price fairness
perceptions and customer loyalty in a retail context”, Journal of Business
Research, 62: 588-593.
Santana, Shelle. 2011. “The Price is Right? Effects of Internal and External
Reference Prices on Consumer Judgments”, Advances in Consumer Research,
39: 250-253.
Balakrishnan, P.V. (Sundar), Rajan Nataraajan and Anand Desai. 2000. “Consumer Rationality and Economic Efficiency: Is the Assumed Link Justified?”, The Marketing Management Journal, 10(1): 1-11.
Duwuri, Sri Devi, Asim Ansari and Sunil Gupta. 2007. “Consumers' Price
Sensitivities Across Complementary Categories”, Management Science, 53(12):
O’Cass, Aron and Hmily McEwen. 2004. “Exploring consumer status and
conspicuous consumption”, Journal of Consumer Behaviour, 4(1): 25-39.
Han, Sangman, Sunil Gupta and Donald R. Lehmann. 2001. “Consumer
price sensitivity and price thresholds”, Journal of Retailing, 77: 435-456.
Varki, Sajeev and Mark Colgate. 2001. “The Role of Price Perceptions in an
Integrated Model of Behavioral Intentions”, Journal of Service Research, 3(3):
232-240.
Rohani, Amirreza and Mohsen Nazari. 2012. “Impact of Dynamic Pricing
Strategies on Consumer Behavior”, Journal of Management Research, 4(4):
143-159.
Danes, Jeffrey E. and Joan Lindsey-Mullikin. 2012. “Expected product price
as a function of factors of price sensitivity”, Journal of Product & Brand
Management, 21(4): 293-300.
Bolton, Lisa E., Hean Tat Keh and Joseph W. Alba. 2010. “How Do Price Fairness Perceptions Differ Across Culture?”, Journal of Marketing Research,
47(3): 564-576.
Hsieh, An Tien and Wen Ting Chang. 2004. “The Effect of Consumer
Participation on Price Sensitivity”, The Journal of Consumer Affairs, 38(2):
282-296.
Thomas, Manoj and Vicki Morwitz. 2005. “Penny Wise and Pound Foolish:
The Left-Digit Effect in Price Cognition”, Journal of Consumer Research, 32:
Appendix
Price changes & purchase decisions
Introduction
This survey is a part of the work project, developed by a student of Nova School of Business and Economics in Lisbon. It's addressed to every adult (>18 y.o) person and it shouldn't take you more than 10 minutes. Each completed survey will contribute to finalization of this academic research, so your support will be highly appreciated. Thank you.
Part I: General information about respondents
1. Gender:
Male
Female
2. Age:
18-24
25-34
35-50
50+
3. Nationality:
Polish
Portuguese
Other
4. What is your professional situation?
I study
I work
I work and study
I’m unemployed/looking for a job
Other
5. On the 1-5 scale, how much do base your purchase decisions on price? (1 = I don’t care about the prices at all, 5 = price is the most important incentive)
1
2
3
Part II: Price decrease – strong preference
6. The situations presented are hypothetical, but if you can associate them with your preferences regarding the real products, feel free to do it.
Imagine that you want to buy cereals. In the supermarket you find two kinds of cereals of similar quality, produced by two different brands – A and B. They both have the same regular price – 3,50€. For some reasons (e.g. taste) you strongly prefer product A to product B and you always buy cereals A. However, you’ve just noticed that the price of product B has dropped. What is the minimal value of price reduction that would induce you to buy cereals B instead of cereals A?
5% (new price of B = 3,33€)
10% (new price of B = 3,15€)
20% (new price of B = 2,80€)
30% (new price of B = 2,45€)
40% (new price of B = 2,10€)
50% (new price of B = 1,75€)
I wouldn’t buy cereals B for any of those prices
7. Now we have the analogous situation, but while buying the pair of jeans. You have strong preference to the jeans A over jeans B (e.g. they look much better on you), however they are both of a good quality. Their regular price is 50€. What is the minimal value of brand B price reduction that would induce you to buy jeans B instead of jeans A?
5% (new price of B = 47,50€)
10% (new price of B = 45€)
20% (new price of B = 40€)
30% (new price of B = 35€)
40% (new price of B = 30€)
50% (new price of B = 25€)
I wouldn’t buy jeans B for any of those prices
8. The same situation again, but you want to buy a mobile phone. You have strong preference to the smartphone A over smartphone B (e.g. its functions suit your needs better), however they are both considered as very good devices. Their regular price is 300€. What is the minimal value of brand B price reduction that would induce you to buy smartphone B instead of smartphone A?
5% (new price of B = 285€)
10% (new price of B = 270€)
20% (new price of B = 240€)
30% (new price of B = 210€)
40% (new price of B = 180€)
50% (new price of B = 150€)
Part III: Price decrease – slight preference
9. You are buying cereals again. In the supermarket you find two kinds of cereals of similar quality, produced by two different brands – A and B. They both have the same regular price – 3,50€. For some reasons (e.g. brand
awareness) you slightly prefer product A to product B and you usually buy cereals A. However, you’ve just noticed that the price of product B has dropped. What is the minimal value of price reduction that would induce you to buy cereals B instead of cereals A?
5% (new price of B = 3,33€)
10% (new price of B = 3,15€)
20% (new price of B = 2,80€)
30% (new price of B = 2,45€)
40% (new price of B = 2,10€)
50% (new price of B = 1,75€)
I wouldn’t buy cereals B for any of those prices
10. Now we have the analogous situation, but while buying the pair of jeans. You have slight preference to the jeans A over jeans B (e.g. you are more familiar with brand A), however they are both of a good quality and look good. Their regular price is 50€. What is the minimal value of brand B price reduction that would induce you to buy jeans B instead of jeans A?
5% (new price of B = 47,50€)
10% (new price of B = 45€)
20% (new price of B = 40€)
30% (new price of B = 35€)
40% (new price of B = 30€)
50% (new price of B = 25€)
I wouldn’t buy jeans B for any of those prices
11. The same situation again, but you want to buy a mobile phone. You have slight preference to the smartphone A over smartphone B (e.g. they have the same functions, but you used to use phones of brand A), however they are both considered as very good devices. Their regular price is 300€. What is the minimal value of brand B price reduction that would induce you to buy smartphone B instead of smartphone A?
5% (new price of B = 285€)
10% (new price of B = 270€)
20% (new price of B = 240€)
30% (new price of B = 210€)
40% (new price of B = 180€)
50% (new price of B = 150€)
Part IV: Price decrease – lack of preference/loyalty
12. Now it’s the third time when you are buying cereals. In the supermarket you find two kinds of cereals of similar quality, produced by two different brands – A and B. Because they both have the same regular price – 3,50€, you don’t prefer any of them, and you used to buy them interchangeably (to have variety). However, you’ve just noticed that the price of product B has dropped. What is the minimal value of brand B price reduction that would induce you to become loyal to brand B and give up (in a long term) buying cereals A?
5% (new price of B = 3,33€)
10% (new price of B = 3,15€)
20% (new price of B = 2,80€)
30% (new price of B = 2,45€)
40% (new price of B = 2,10€)
50% (new price of B = 1,75€)
I wouldn’t become loyal to cereals B for any of those prices
13. As a big fan of jeans, you are buying them once more. You don’t have any preference neither to jeans A nor to jeans B, they are both of a good quality and look good. Their regular price is 50€. You used to buy jeans of both brands interchangeably (to have variety). What is the minimal value of brand B price reduction that would induce you to become loyal to brand B and give up (in a long term) buying jeans of brand A?
5% (new price of B = 47,50€)
10% (new price of B = 45€)
20% (new price of B = 40€)
30% (new price of B = 35€)
40% (new price of B = 30€)
50% (new price of B = 25€)
I wouldn’t become loyal to jeans of brand B for any of those prices
14. The same situation again, but you want to buy a mobile phone. You don’t have any preference neither to
smartphone A nor to smartphone B, they are both considered as very good devices. Their regular price is 300€. You used to buy smartphones of both brands interchangeably (to have variety). What is the minimal value of brand B price reduction that would induce you to become loyal to brand B and give up (in a long term) buying smartphones of brand A?
5% (new price of B = 285€)
10% (new price of B = 270€)
20% (new price of B = 240€)
30% (new price of B = 210€)
40% (new price of B = 180€)
50% (new price of B = 150€)
Part V: Price increase – strong preference
15. As you’ve probably already noticed, you like cereals and you want to buy them again. In the supermarket you find two kinds of cereals of similar quality, produced by two different brands – A and B. They both have the same regular price – 3,50€. For some reasons (e.g. taste) you strongly prefer product A to product B and you always buy cereals A. However, you’ve just noticed that the price of product A has increased. What is the minimal value of price increase that would induce you to buy cereals B instead of cereals A?
5% (new price of A = 3,68€)
10% (new price of A = 3,85€)
20% (new price of A = 4,20€)
30% (new price of A = 4,55€)
40% (new price of A = 4,90€)
50% (new price of A = 5,25€)
I would still buy cereals A for any of those prices
16. Now we have the analogous situation, but while buying the pair of jeans. You have strong preference to the jeans A over jeans B (e.g. they look much better on you), however they are both of a good quality. Their regular price is 50€. What is the minimal value of brand A price increase that would induce you to buy jeans B instead of jeans A?
5% (new price of A = 52,50€)
10% (new price of A = 55€)
20% (new price of A = 60€)
30% (new price of A = 65€)
40% (new price of A = 70€)
50% (new price of A = 75€)
I would still buy jeans A for any of those prices
17. I’m sure that you don’t expect it, but you want to buy a mobile phone. You have strong preference to the
smartphone A over smartphone B (e.g. its functions suit your needs better), however they are both considered as very good devices. Their regular price is 300€. What is the minimal value of brand A price increase that would induce you to buy smartphone B instead of smartphone A?
5% (new price of A = 315€)
10% (new price of A = 330€)
20% (new price of A = 360€)
30% (new price of A = 390€)
40% (new price of A = 420€)
50% (new price of A = 450€)
Part VI: Price increase – slight preference
18. You are buying cereals again. In the supermarket you find two kinds of cereals of similar quality, produced by two different brands – A and B. They both have the same regular price – 3,50€. For some reasons (e.g. brand
awareness) you slightly prefer product A to product B and you usually buy cereals A. However, you’ve just noticed that the price of product A has increased. What is the minimal value of price increase that would induce you to buy cereals B instead of cereals A?
5% (new price of A = 3,68€)
10% (new price of A = 3,85€)
20% (new price of A = 4,20€)
30% (new price of A = 4,55€)
40% (new price of A = 4,90€)
50% (new price of A = 5,25€)
I would still buy cereals A for any of those prices
19. Now we have the analogous situation, but while buying the pair of jeans (sounds a bit familiar?). You have slight preference to the jeans A over jeans B (e.g. you are more familiar with brand A), however they are both of a good quality and look good. Their regular price is 50€. What is the minimal value of brand A price increase that would induce you to buy jeans B instead of jeans A?
5% (new price of A = 52,50€)
10% (new price of A = 55€)
20% (new price of A = 60€)
30% (new price of A = 65€)
40% (new price of A = 70€)
50% (new price of A = 75€)
I would still buy jeans A for any of those prices
20. The same situation again, but you want to buy a mobile phone. You have slight preference to the smartphone A over smartphone B (e.g. they have the same functions, but you used to use phones of brand A), however they are both considered as very good devices. Their regular price is 300€. What is the minimal value of brand A price increase that would induce you to buy smartphone B instead of smartphone A?
5% (new price of A = 315€)
10% (new price of A = 330€)
20% (new price of A = 360€)
30% (new price of A = 390€)
40% (new price of A = 420€)
50% (new price of A = 450€)
Part VII: Price increase – lack of preference/loyalty
21. It’s another time when you are buying cereals (the last one, I promise). In the supermarket you find two kinds of cereals of similar quality, produced by two different brands – A and B. Because they both have the same regular price – 3,50€, you don’t prefer any of them, and you buy them interchangeably (to have variety). However, you’ve just noticed that the price of product A has increased. What is the minimal value of brand A price increase that would induce you to become loyal to brand B and give up (in a long term) buying cereals A?
5% (new price of A = 3,68€)
10% (new price of A = 3,85€)
20% (new price of A = 4,20€)
30% (new price of A = 4,55€)
40% (new price of A = 4,90€)
50% (new price of A = 5,25€)
I wouldn’t become loyal to cereals B even if the price of cereals A went up by 50%
22. Now we have the analogous situation, but while buying the pair of jeans. You don’t have any preference neither to jeans A nor to jeans B, they are both of a good quality and look good. Their regular price is 50€. You used to buy jeans of both brands interchangeably (to have variety). What is the minimal value of brand A price increase that would induce you to become loyal to brand B and give up (in a long term) buying jeans of brand A?
5% (new price of A = 52,50€)
10% (new price of A = 55€)
20% (new price of A = 60€)
30% (new price of A = 65€)
40% (new price of A = 70€)
50% (new price of A = 75€)
I wouldn’t become loyal to jeans of brand B even if the price of jeans A went up by 50%
23. The same situation again, but you want to buy a mobile phone. You don’t have any preference neither to
smartphone A nor to smartphone B, they are both considered as very good devices. Their regular price is 300€. You used to buy smartphones of both brands interchangeably (to have variety). What is the minimal value of brand A price increase that would induce you to become loyal to brand B and give up (in a long term) buying smartphones of brand A?
5% (new price of A = 315€)
10% (new price of A = 330€)
20% (new price of A = 360€)
30% (new price of A = 390€)
40% (new price of A = 420€)
50% (new price of A = 450€)
I wouldn’t become loyal to smartphones of brand B even if the price of smartphones A went up by 50%