THIS REPORT WAS PREPARED BY JOÃO ALMEIDA, A MASTERS IN FINANCE STUDENT OF THE NOVA SCHOOL OF BUSINESS AND ECONOMICS, EXCLUSIVELY FOR ACADEMIC PURPOSES.THIS REPORT WAS SUPERVISED BY ROSÁRIO ANDRÉ WHO REVIEWED THE
M
ASTERS IN
F
INANCE
E
QUITY
R
ESEARCH
! We recommend holding EDP given our price target for FY14 of €2.72 per share. This value reflects an upside potential of
1%, compared to the current market price.
! EDP generation segment is shifting its activity towards the liberalised market. CMEC contracts’ gross margin was negatively impacted by a cut of €13mn in its remuneration, imposed by the
Portuguese government. Additionally, EDP will have to pay a one-off extraordinary tax in 2014 of €65mn. Still, this tariff has a
residual relevance for EDP stock price, representing less than 1% of the total EV.
! EDP’s future generation mix will play a key role for margins’ improvement. The company’s generation portfolio is highly oriented to hydro (47% of installed capacity in 2012). In 2018 it is expected that this type of energy, together with coal will represent about 80% of the total energy produced by EDP. The main disadvantage of EDP compared to its peers lays of the absence of relevant nuclear assets.
! EDP Renováveis is expected to go through a strong expansion Capex (€461.5 mn per year after 2016), following the
strategy defined by the new shareholder China Three Gorges (CTG).
Company description
EDP – Energias de Portugal is the main Portuguese utilities company. The company’s activity is focused in the generation, distribution and supply of energy. It also holds a portfolio of renewables’ assets in eleven different countries through EDP Renováveis. EDP Brazil is held in 51% by the EDP group, developing generation and distribution activities in the country.
EDP
C
OMPANY
R
EPORT
U
TILITIES
6
THJ
ANUARY2013
S
TUDENT
:
J
OÃO
A
LMEIDA
[email protected]
Floating in the fog
The uncertainty is lying between austerity and
deregulation
…
Recommendation: HOLD
Vs Previous Recommendation -
Price Target FY14: 2.72 €
Vs Previous Price Target -
Price (as of 6-Jan-14) 2.68 €
Reuters: EDP.LS, Bloomberg: EDP.PL
52-week range (€) 2.22-2.82
Market Cap (€m) 9803.2
Outstanding Shares (m) 3656
Source: Bloomberg
Source: Bloomberg
(Values in € millions) 2012 2013E 2014F
Gross Margin 5,428 5,805 5,785
EBITDA 3,629 3,872 3,863
EBIT 2,144 2,373 2,358
Net Profit 1,182 1,217 1,225
EPS 0.32 0.33 0.33
EV/Gross Margin 5.91 5.53 5.54
EV/EBITDA 8.84 8.28 8.3
Net Debt/EV 58% 53% 51%
Source: Company Report; Analyst Estimates
EDP – ENERGIAS DE PORTUGAL COMPANY REPORT
Table of Contents
Company Overview ... 3
Valuation ... 8
Global Energy Market ... 11
Electricity Market Iberia ... 14
Market Overview ... 14
Electricity Generation ... 15
Market Overview ... 15
Regulated Generation ... 17
Liberalised Generation ... 20
Electricity Distribution ... 24
Electricity Supply ... 26
Gas ... 28
EDP Brazil ... 28
EDP Renováveis ... 31
Scenario Analysis ... 31
Final Considerations ... 32
EDP – ENERGIAS DE PORTUGAL COMPANY REPORT
Company overview
Company description
EDP – Energias de Portugal is a Portuguese vertically integrated utilities’
company, founded back in 1976 as a result of the nationalization and merger of thirteen electricity operators. As a state-owned company, its main mission was to provide electricity throughout the Portuguese territory, upgrading and expanding the existing distribution network. In 1994, the Portuguese government completed the company’s restructuring process and created EDP Group. Since then, the company went through eight privatization stages. The last one took place in 2012 when China Three Gorges (CTG) acquired a 21.35% stake to the Portuguese government, represented by Parpública.
EDP is listed in the Lisbon Stock Exchange since 1997 (figure 1) and has a market cap of €9.8bn. It is the largest generator, distributor and supplier of
electricity in Portugal. Also, the company is an important player in the Iberian market in regards to electricity generation and gas distribution. Nevertheless, in terms of market capitalization, EDP is one of the smallest players in Europe (see figure x), having registered a steady evolution throughout the past three years. From the chosen range of comparable companies, the French players GDF Suez and EDF clearly stand out, whereas Verbund present a similar market cap to the Portuguese power company.
As concerns wind power, EDP stands as an increasingly important player worldwide, with facilities spread around the globe, for which is expected a strong investment in a near future. The company is currently facing a significant challenge in order to react properly to the regulatory uncertainty that the utilities sector in Iberia has been suffering, as well as the constraints in domestic demand.
EDP’s activity is currently structured in six different segments: Generation,
Distribution, Supply, Gas, Brazil and Renewables. From a geographical perspective, the Portuguese utilities company operates not only in the Iberian market, but also in the United States, Brazil, France, Belgium, Poland, Romania, Italy, UK and Canada. As presented in figure 2, EDP Renováveis is the most representative segment for the group’s overall EBITDA (26%) in 2012, followed closely by the regulated electricity generation (22%), distribution in Portugal (18%) and EDP Brazil (15%). Nevertheless, it is our belief that this framework will suffer a change until 2017 as can be seen in figure 3, with the liberalised
!0,00!! !0,50!! !1,00!! !1,50!! !2,00!! !2,50!! !3,00!! !3,50!! !4,00!! !4,50!! !5,00!! Ju n /97! Ab r/ 98! Fe v /9 9 ! D e z/ 9 9 ! Ou t/ 0 0 ! Ago /01! Ju n /02! Ab r/ 03! Fe v /0 4 ! D e z/ 0 4 ! Ou t/ 0 5 ! Ago /06! Ju n /07! Ab r/ 08! Fe v /0 9 ! D e z/ 0 9 ! Ou t/ 1 0 ! Ago /11! Ju n /12! Ab r/ 13!
Figure 1 - EDP stock price since IPO
Source: Bloomberg 22%# 7%# 18%# 4%# 1%# 1%# 8%# 15%# 26%# Regulated)Genera-on) Liberalised)Genera-on) Distribu-on)Portugal) Distribu-on)Spain) Liberalised)Supply)PT) Liberalised)Supply)SP) Gas) EDP)Brasil) EDP)Renováveis)
Figure 2 - EBITDA (2012)
Source: EDP
Figure 3 - EBITDA (2017)
EDP – ENERGIAS DE PORTUGAL COMPANY REPORT
generation, EDP Renováveis and EDP Brazil gaining even more preponderance. This transformation process will occur mainly as a consequence of the deregulation process that Iberia is going through, and a further investment in renewable energy sources and Brazil. These topics will be further analysed in the next sections.
EDP operates in the electricity generation segment through its subsidiaries EDP Produção in Portugal and HC (Hidroeléctrica del Cantábrico) in Spain, both in the regulated and liberalised markets. The regulated generation unit operates mainly under the denominated PPA/CMEC contracts, but also produces electricity under the special regime.
Also, it is expectable that EDP’s installed capacity currently under regulation will progressively be shifted towards the liberalised generation, following the trends of the energy sector. Therefore, as can be seen in figure 4, in 2012, 48% of the company’s installed capacity is regulated while the remaining 52% are operating under the liberalised framework. In contrast, in 2018, as the plants under PPA/CMEC contracts are shifted towards the competitive market, the regulated installed capacity will only represent 3% of the group’s total generation portfolio. As concerns the EBITDA mix, the trend will be similar to the one presented above. While in 2012 the regulated portfolio (76%) was responsible for the majority of the generation segment results, in 2018 it is expected to represent only a residual share of 9%. In fact, as presented in figure 5, the regulated generation EBITDA has been decreasing in the past three years, from €883mn in
2010 to approximately €795mn in 2012. Similarly, the EBITDA evolution for the
liberalised generation (figure 6) has verified a downward trend, mainly following a significant decrease in the gross margin in 2012.
EDP Distribuição and HC Distribución operate in EDP’s electricity distribution
segment, both of them under a regulated framework. The remuneration scheme of this business unit is mainly dependant on the Return on Regulated Asset Base (RoRAB), which is fixed by the regulator for periods of three years. Both ERSE and CNE have secured a RoRAB for the current regulatory period in Portugal and Spain of 9.5% and 7.8%, respectively.
Currently, EDP has the concession for 224 thousand kilometres of grid in Portugal and 23 thousand kilometres in Spain. Since this is a mature segment, it is not expected any further expansion investment. As concerns the gross margin both in Portugal and Spain, both have registered a downward trend mainly because of the efficiency ratio intrinsic to the controlled costs. However, the margin is expected to stabilize in a near future, as there is no room for further controlled costs’ efficiency improvement in the distribution segment.
48%$
3%$ 52%$
97%$
2012$ 2018$
Liberalised$Genera1on$ Regulated$Genera1on$ Figure 4 - Installed Capacity
Source: EDP
!883!!
!821!!
!795!!
2010$ 2011$ 2012$
Figure 5 - EBITDA Regulated Generation
Source: EDP
!359!!
!343!!
!254!!
2010$ 2011$ 2012$
Figure 6 - EBITDA Liberalised Generation
EDP – ENERGIAS DE PORTUGAL COMPANY REPORT
The Iberian Supply business unit operates both in the regulated and liberalised markets, despite the current market shift to the competitive environment. In fact, the last resort supply in Portugal, currently operated by EDP Serviço Universal, has been considerably diminishing its activity, following the IMF and European Union recommendations after Portugal’s bailout in 2011. The process is expected to be complete by the end of 2015.
In contrast, the liberalised supply market is benefiting from an increase in the number of costumers, allowing EDP to be exposed to market prices and conditions instead of being dependant of a completely regulated electricity tariff. of 40%. Additionally, EDP’s liberalised supply segment is managed as a single energy platform, allowing the establishment of electricity and gas procurement contracts, in close relationship with the energy generation and trading activities. Despite the entrance in a competitive market in which price competition takes an important role, EDP has been able to avoid a sharp decrease in EBITDA both in Portugal (figure 7) and Spain (figure 8) between 2010 and 2012.
The gas segment is responsible for the supply and distribution of gas in Iberia, both under a regulated and liberalised framework. Actually, the supply activity is quite recent within the EDP Group, so it could experience some growth in the Portuguese market, despite the fierce competition from the incumbent company, Galp Energia. In 2012, EDP was able to achieve a market share of 16.2% in this market, compared to only 3% in 2009. On the other side, the market in Spain is experiencing a mature stage, being more difficult for EDP to achieve a higher market share, given its lower scale. Therefore, by analysing the past three years’ trend of this segment’s EBITDA, EDP has been able to improve its operational performance, mainly fostered by its Portuguese operations.
The renewables segment is currently operated by EDP Renováveis, quoted in the Lisbon Stock Exchange since 2008 (figure 9) with a stock price of €3.861.
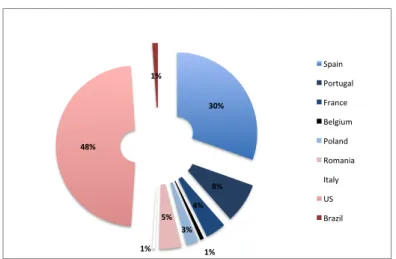
When compared to PSI20 (figure 10) - the main Portuguese stock index, EDPR has registered a much more volatile performance, though with similar returns. This business unit has been facing a significant expansion along the past 5 years, with an average increase in installed capacity of 16% per year. EDP Renováveis is present both in wind and solar generation in eleven different countries, pursuing a growth policy that is expected to continue in the near future, following the strategy defined by the new major shareholder China Three Gorges. In 2012, about 48% of the company’s renewables portfolio (figure 11) was located in the United States, followed closely by Spain with 30%. In regards to the financial performance, this segment has been registering a strong upward
1
Source: Bloomberg, as of 31.12.2013
!44!!
!11!!
!36!!
2010$ 2011$ 2012$
Figure 7 - EBITDA Supply PT
Source: EDP
!28!!
!7!!
!22!!
2010$ 2011$ 2012$
Figure 8 - EBITDA Supply SP
Source: EDP 0" 1" 2" 3" 4" 5" 6" 7" 8" Ju n /08" S e t/ 0 8 " D e z/ 0 8 " Mar / 0 9 " Ju n /09" S e t/ 0 9 " D e z/ 0 9 " Mar / 1 0 " Ju n /10" S e t/ 1 0 " D e z/ 1 0 " Mar / 1 1 " Ju n /11" S e t/ 1 1 " D e z/ 1 1 " Mar / 1 2 " Ju n /12" S e t/ 1 2 " D e z/ 1 2 " Mar / 1 3 " Ju n /13" S e t/ 1 3 " D e z/ 1 3 "
Figure 9 – EDPR stock price since IPO Source: Bloomberg !30%% !20%% !10%% 0%% 10%% 20%% 30%% Ju n /08% S e t/ 0 8 % D e z/ 0 8 % Mar / 0 9 % Ju n /09% S e t/ 0 9 % D e z/ 0 9 % Mar / 1 0 % Ju n /10% S e t/ 1 0 % D e z/ 1 0 % Mar / 1 1 % Ju n /11% S e t/ 1 1 % D e z/ 1 1 % Mar / 1 2 % Ju n /12% S e t/ 1 2 % D e z/ 1 2 % Mar / 1 3 % Ju n /13% S e t/ 1 3 % D e z/ 1 3 % Return%EDPR% Return%PSI20% Figure 10 – EDPR vs. PSI20
EDP – ENERGIAS DE PORTUGAL COMPANY REPORT
trend in its gross margin, increasing from €821mn in 2010 to €1,124mn in 2012.
EBITDA has also increased during the same period of time from €715mn in 2010
to €932mn in 2012.
Figure 11 - Installed Capacity by country - EDPR
EDP operations in Brazil have started in 1996 through the acquisition of a minority interest in Ampla. Four years later, EDP Brazil was founded and was mainly focused on the generation and distribution of electricity. EDP’s operations in Brazil are responsible for a large generation portfolio, while pursuing its distribution activities through Escelsa and Bandeirante. Currently, EDP Group keeps a controlling stake of 51% in the Brazilian operations, being then exposed to a large growing economy that is expected to develop in large scale in the upcoming years.
EDP Brazil is quoted in São Paulo stock exchange, having achieved an upward trend since its IPO in 2005. As concerns the company’s financial performance, one can verify that both gross margin and EBITDA have presented a stably upward trend over the past three years, unless for 2012, when a series of incurrent events, as the delay in the ramp-up of Pecém power plant, led to a decrease in the company’s results.
Shareholder structure
EDP share capital comprises a total amount of 3,656,537,715 shares, with a nominal value of €1 each. Furthermore, 95.86% of these are ordinary class A2
shares, while the remainder is composed by class B shares. CTG stands as the major shareholder with a 21.35% stake, followed by Iberdrola with 6.8%. The Portuguese state, represented by Parpública, remains with a minority stake of
2
Class A shares stand as the typical common share’s class, as the voting rights are aligned with the ownership stake of each investor. In contrast, the class B shares normally give to its holder fewer or none voting rights. Also, they may be converted into class A, under a predetermined ratio. As concerns the rights over profits or company ownership, both class A and class B shares give to its holders similar benefits. 30%$ 8%$ 4%$ 1%$ 3%$ 5%$ 1%$ 48%$ 1%$ Spain& Portugal& France& Belgium& Poland& Romania& Italy& US& Brazil& Source: Bloomberg !0!! !2!! !4!! !6!! !8!! !10!! !12!! !14!! !16!! Ju l/05! D e z/ 0 5 ! Mai / 0 6 ! O u t/ 0 6 ! Mar / 0 7 ! Ago / 07! Jan / 0 8 ! Ju n /08! No v/ 08! Ab r/ 09! S e t/ 0 9 ! Fe v /1 0 ! Ju l/10! D e z/ 1 0 ! Mai / 1 1 ! O u t/ 1 1 ! Mar / 1 2 ! Ago / 12! Jan / 1 3 ! Ju n /13! No v/ 13!
Figure 12 – EDPB stock price since IPO
Figure 13 - EDP's shareholder structure (Source: EDP)
EDP – ENERGIAS DE PORTUGAL COMPANY REPORT
4.1%, corresponding to the totality of the class B shares. Also, approximately 40.8% of the total amount of shares is admitted to free floating in the Lisbon Stock Exchange.
Since 1997, the company has been shifting its shareholder structure through eight phases of privatization. The last one was completed in 2012 when the Portuguese state sold its 21.35% participation to China Three Gorges (CTG) for
€3.45 per share, the equivalent to €2.7bn, representing a 50% premium over the
market price at the day of the announcement. Consequently, this offer by the Chinese player implied a total equity value for EDP of €12.64bn. The privatization
was done under a complex market environment in which the government was under pressure by the economic authorities to execute the deal. Despite these adverse financing conditions to execute the deal, there were four binding proposals from four top tier players: CTG, E.ON (€3.25/share), Electrobras
(€3.28/share) and Cemig. Still, the CTG partnership seemed to be the one that
presented a higher bidding price and complied better with EDP’s strategy focused on growth, efficiency and controlled risk, where they could benefit from the Chinese player’s experience in the power industry. China Three Gorges is classified with a credit rating of A3 (S&P) and is fully owned and supported by the Chinese Government, benefiting as well from its high sovereign rating of AA-4, according to S&P. Moreover, CTG stands as the largest clean energy group in China, focusing its activity in hydropower projects, while aspiring to develop an international renewable energy plan. Currently, the company has 50.8GW capacity under construction, of which 48.9GW are hydro. The target for 2020 is to have 70GW of installed capacity in hydro and 20GW in wind. As part of the agreement, CTG committed to lock its position for a period of 4 years, sustaining the shareholder stability. Furthermore, CTG will invest €2bn in minority equity
stakes in existing and future renewable projects, aiming to become worldwide leaders in renewable energy. This strategy outlook seemed to be the perfect fit for EDP Renováveis, which is facing a rapid expansion also, since the new major shareholder is willing to deploy a strong investment in this segment, obtaining then the appropriate credit facilities. Indeed, CTG will commit with a stronger credit profile and liquidity for EDP Group, assuring a €2bn credit facility provided
by a Chinese financial institution with a maturity up to 20 years. Summing up, this partnership not only was the one that enabled the Portuguese government to cash in a higher amount of money, but also will assure a sustainable growth strategy in renewables and hydropower. Credit profile improvement is also an important point, as EDP will benefit from improved financing conditions backed by a more favourable rating.
3
Source: Bloomberg as 1.1.2014 4
EDP – ENERGIAS DE PORTUGAL COMPANY REPORT
Valuation
In order to value EDP, we used the sum-of-the-parts (SOP) methodology, assessing the value of each segment independently. Taking into account the diversity of available information to perform the valuation, different methods were used to compute the value of each business unit. All of our core business segments were valued under the DCF-WACC approach, while EDP Renováveis’ value was computed based on its market value. In regards to non-operating items and investments in associates, we used their book value, since it replicates accurately its real worth. As concerns the DCF approach, we used a seven years’ forecast, at current prices, with all the value reflected in euros, unless for EDP Brazil where the cash flows are presented in the local currency, the Brazilian real. In order to better reflect our perspective about each segment, there were five business units that were valued under the DCF-WACC approach, despite the different costs of capital employed. Since each unit has a different implicit risk, we believe that computing a different WACC for each one of them is the most accurate method to value EDP.
Taking into account the different nature of each business unit, five different costs of capital were calculated, which were later used to discount the free cash flows. First, in order to determine the cost of equity,we used the capital asset pricing model (CAPM). The first step consisted in estimating the risk-free rate based on the yield of the 10Y bond of two European governments with high credit rating - Austria and Germany. In this specific case, it was decided not to use only the Germany rate, as it currently presents an abnormal evolution, with extremely low levels that do not reflect accurately the level of implicit risk. Afterwards, it was used a market risk premium of 5.8%5, according to some empirical research. In regards to the industry beta it was computed as the median of the unlevered beta of a group of comparable companies6, levering it then according to EDP’s target debt-to-equity7 ratio at market values. The group of considered comparable companies differed depending on the companies’ business focus, either
regulated or liberalised activities, and also companies operating in Brazil. Regardless of the group of comparable companies, the market portfolio used to compute each company’s beta was the MSCI World. As concerns the WACC for liberalised and regulated activities, we have also computed a different discount
5
Santa-Clara, Pedro; Yan, Shu (2004). Jump and Volatility Risk and Risk Premia: A New Model and Lessons from S&P 500 Options. Massachusetts: NBER
6
Liberalised Activities: EDP, Iberdrola, Endesa, E.ON, Verbund, RWE, Enel, Gas Natural, EDF and GDF Suez; Regulated Activities: Red Electrica Corp, REN, Enagas; Brazil: EDP Brazil, Centrais Electricas Brazil, CIA Paranaense, CIA Energética MG, CPFL Energia, Tractebel Energia, CIA Energética SP.
7
EDP – ENERGIAS DE PORTUGAL COMPANY REPORT
rate depending if the business is conducted in Portugal or Spain, varying the respective tax rate. Despite using the same risk-free rate for each cost of equity, the one referring to Brazil had to be adjusted by the inflation differential between Euro Zone and Brazil in order to reflect both the cash-flows and the discount rate in the same currency, the Brazilian Real (BRL).
The beta is a measure of systematic risk, which reflects each company’s risk when related to the market. In our opinion, the considered countries do not present any additional systematic risk that would lead us to contemplate a country risk premium. All the additional risk that may arise from a country’s economic situation is believed to be specific, and thus it is reflected on our cash-flow estimates.
Second, in order to determine EDP’s cost of debt, we decided to reflect accurately the perceived risk by the investors taking into account not only the company’s capital structure but also its rating. In order to estimate the implicit yield, we used the aforementioned risk-free rate plus a credit spread measured by the last 18 months average of EDP’s 10Y CDS denominated in euros. Also, the company credit rating is Ba1, which yields a probability of default of 1.37% and a recovery rate of 62.20%8, according to Moody’s.
Third, in order to complete the calculation of EDP cost of capital, it was necessary to estimate the target capital structure, measured in market values. Thus, we decided to estimate the target ratio based on the industry median9, but always considering the company’s current structure. Consequently, the target debt-to-equity ratio was obtained by attributing a weight of one-third to the industry median and two-thirds to EDP’s current value.
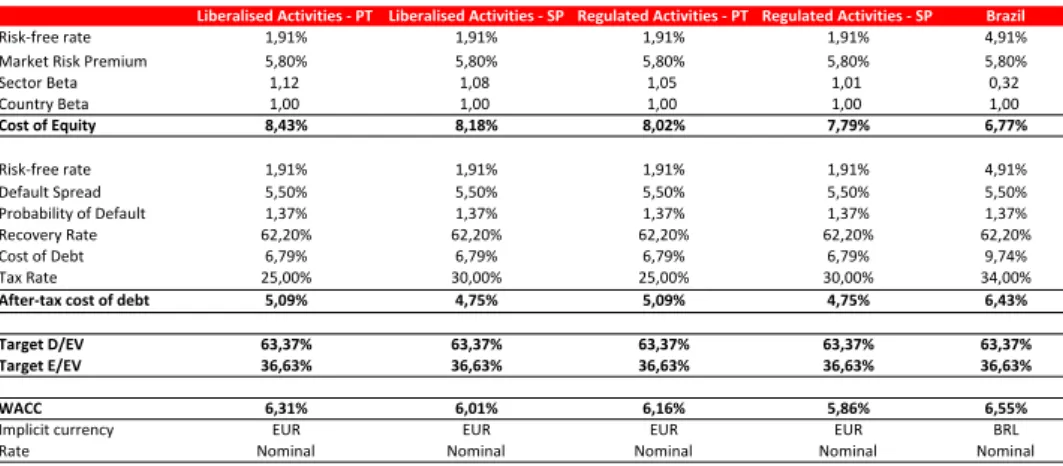
The table below summarizes the main assumptions behind the calculation of the WACC, in nominal terms, as well as the implicit currency for each rate.
Figure 14 - WACC Assumptions
8
Sharon Ou (2011). Special Comment: Corporate Default and Recovery Rates, 1920-2010. New York: Moody's Investors Services. All. 9
Computed based on the considered comparable companies.
Liberalised*Activities*/*PT Liberalised*Activities*/*SP Regulated*Activities*/*PT Regulated*Activities*/*SP Brazil
Risk%free)rate 1,91% 1,91% 1,91% 1,91% 4,91%
Market)Risk)Premium 5,80% 5,80% 5,80% 5,80% 5,80%
Sector)Beta 1,12 1,08 1,05 1,01 0,32
Country)Beta 1,00 1,00 1,00 1,00 1,00
Cost*of*Equity 8,43% 8,18% 8,02% 7,79% 6,77%
Risk%free)rate 1,91% 1,91% 1,91% 1,91% 4,91%
Default)Spread 5,50% 5,50% 5,50% 5,50% 5,50%
Probability)of)Default 1,37% 1,37% 1,37% 1,37% 1,37%
Recovery)Rate 62,20% 62,20% 62,20% 62,20% 62,20%
Cost)of)Debt 6,79% 6,79% 6,79% 6,79% 9,74%
Tax)Rate 25,00% 30,00% 25,00% 30,00% 34,00%
After/tax*cost*of*debt 5,09% 4,75% 5,09% 4,75% 6,43%
Target*D/EV 63,37% 63,37% 63,37% 63,37% 63,37%
Target*E/EV 36,63% 36,63% 36,63% 36,63% 36,63%
WACC 6,31% 6,01% 6,16% 5,86% 6,55%
Implicit)currency EUR EUR EUR EUR BRL
EDP – ENERGIAS DE PORTUGAL COMPANY REPORT
The one-off government tax included in EDP’s valuation corresponds to an extraordinary contribution that the Portuguese state imposed to the energy sector. The contribution tax of 0.85% over the company’s fixed assets and intangibles is expected to have a negative impact of €65mn in our valuation for
the firm. Still, it is worth to refer that this austerity policy is only to be applied during the year of 2014, not being expected further additional taxes in the following years.
In conclusion, EDP’s valuation yields a share price of €2.73, with a potential
upside of 2%, leading to a HOLD recommendation.
Figure 15 - Valuation Summary
METHOD BASE
SCENARIO
AUSTERITY MEASURES
Regulated Generation DCF 3 647 3 354
Liberalised Generation DCF 5 775 5 775
Distribution PT DCF 5 982 5 982
Distribution SP DCF 1 755 1 755
Supply PT DCF 227 227
Supply SP DCF 171 171
Gas DCF 1 355 1 355
EDP Brasil DCF 5 991 5 991
EDP Renováveis Market Value 3 400 3 400
EDP Renováveis Net Debt Market Value 3 440 3 440
Non-Operating Items Book Value 399 399
One-off government tax Market Value -65 -100
Enterprise Value 32 077 31 749
Net Debt Market Value 16 943 16 943
Minority Interests Book Value -3 239 -3 239
Unfunded Pension Funds Book Value -1 933 -1 933
Equity Value 9 961 9 633
#Shares 3 657 3 657
Price per share 2,72 € 2,63 €
Current Market Price 2,68 € 2,68 €
Upside/Downside 2% -2%
Attributed probability 90% 10%
Target Price FY14 2,72 € HOLD
3"647""5"775"" 5"982""
1"755"" "227"" "171"" 1"355""5"991"" 6"840"" "399"" 0"
5000" 10000" 15000" 20000" 25000" 30000" 35000"
Regu late
d"Ge nera7
on"
Liber alise
d"Ge nera7
on"
Distr ibu7o
n"PT "
Distr ibu7o
n"SP "
Supply "PT"
Supply "SP" Gas
"
EDP" Bras
il"
EDP" Reno
vávei s"
OneH off"g
over nmen
t"tax "
NonH Oper
a7ng "Item
s" End" Enterprise)Value)Breakdown)
EDP – ENERGIAS DE PORTUGAL COMPANY REPORT
Global Energy Market
Market Overview
Since the later period of the twentieth century, the global energy consumption has constantly increased, mostly fostered by developing and emerging economies. This group of countries has been benefiting from double digit growth rates, increasing living standards and sustained population growth. Despite the global recession of 2008-2009, these nations managed to maintain its growth pace. For example, China and India registered an average growth between 1990 and 2010 of 10.4% and 6.4%, respectively. Still, OECD countries grow only at 2.1%, with slow or decreasing population growth.
This growth trend will keep steady for the next 30 years with a strong contribution from non-OECD countries where demand depends significantly on a strong and long-term economic growth. From 2010 to 2040, the world energy consumption is expected to grow about 56%, from 524 quadrillion Btu to 820 quadrillion Btu. Definitely, there is a different consumption propensity between OECD and non-OECD countries, with the former one growing only 17% in energy consumption, while the latter will consume 90% more energy in 2040 than actually.
Undoubtedly, the global recession of 2008-2009 had a meaningful impact on the global energy consumption. Still, one can conclude that developed countries are showing a sluggish growth when compared to the emerging economies, which were not so affected by this economic downturn. A good example is exhibited in US and Euro Zone that continues to suffer from unresolved debt issues, lagging when compared to its peers.
Considering the increase in energy consumption, oil prices are also expected to record an upward trend. The Brent crude oil spot price averaged $112/bbl in 2012, reaching $106/bbl in 2020 and $163/bbl in 2040.
EDP – ENERGIAS DE PORTUGAL COMPANY REPORT
Liquid Fuels
The liquid fuels consumption is not expected to reflect the increasing trend in oil prices. Actually, the global use of petroleum and derivatives will grow from 87 million barrels per day in 2010 to 97 million barrels per day in 2040. Also, about 63% of this increase is attributable to the transportation sector, which is still highly dependant from this type of fuel. Additionally, it is not expected this trend to change in the following years, as this sector did not innovate in order to become less exposed to Brent prices. As concerns the remaining 37% of increase of liquid fuels consumption, it could be attributed to the industrial sector, as the chemicals industry continues to be dependant on this source of energy. Essentially, these sectors are the main drivers for an inelastic demand of liquid fuels. Still, one should expect an increasing exposure to less pollutant fuels, complying with recommendations from international environmental agencies and Kyoto agreements.
In regards to electric power generation, there will be a decreasing dependence on oil, as the focus is shifted towards cheaper fuels, enhancing the amount of energy produced to sell in the system.
Natural Gas
Similarly to the liquid fuels, natural gas consumption will increase in the next 30 years from 113 trillion cubic feet in 2010 to 185 trillion cubic feet in 2040. The industrial sector and power generation, representing about 77% of this increase, will continue to prefer natural gas to oil in their activities across many regions in the world. The main rationale behind this choice lays not only on the lower carbon dioxide intensity, but also on a more attractive price. In the case of EDP, natural gas is mainly used in CCGT plants, which produce electricity through a cogeneration system. The total installed capacity under this type of generation totalizes 3.8 GW, located both in Portugal and Spain. Still, CCGT power plants presented very low load factors in 2011 (21%) and 2012 (9%), due to the considerable increase in its price.
Coal
EDP – ENERGIAS DE PORTUGAL COMPANY REPORT
Still, in the long-term, coal consumption may ease as a result of the environmental policies that encourage users to pursue cleaner energy sources, reducing gradually CO2 emissions. In that sense, renewable energy and nuclear would become more attractive, not only to industrial customers but also for power generation. As an example, coal consumption share in total energy used for power generation will represent 36% in 2040, while natural gas is responsible for 24% and renewables for 25% in the considered period.
Currently, China has the largest stake in coal consumption worldwide with 47%, followed by the United States with 14% and India with 9%, representing together about 70% of total coal demand. This stake is expected to increase to 75% in 2040.
Summing up, the environmental impacts of polluting energy sources, specially related with the greenhouse gas emissions, shifted the economic agents attention to the importance of reducing its consumption. Coal is being impacted by this policy in the global energy market, as well as liquid fuels. Additionally, the historical and forecasted upward trend in coal prices related to other energy sources like nuclear strongly contributes to this downward consumption trend. Still, we should expect the usage of coal in power generation to keep fairly steady, as the power players are more concerned nowadays with the fuel prices than with environmental concerns. This particular trend is shown by the satisfactory load factor that coal has verified in EDP’s portfolio both in 2011 (42%) and 2012 (53%). As concerns EDP electricity generation, the majority of coal installed capacity is located in Spain, being Sines the only coal plant currently operating in Portugal under the PPA/CMEC contract until 2017, being decommissioned afterwards.
CO2 Emissions
Nowadays, the awareness towards CO2 emissions have became a central issue. Taking into account the increasing energy demand, the international environmental agencies together with the governments decided to regulate properly the consumption of the most pollutant sources.
EDP – ENERGIAS DE PORTUGAL COMPANY REPORT
more efficiently the type of energy used, in order to meet the regulators requirements regarding CO2 emissions. In 2040, non-OECD emissions are expected to exceed OECD emissions in 127%. Hence, we expect that the production mix in regards to power generation would be oriented towards cleaner energy sources, though always taking into account the intrinsic production costs.
Electricity Market - Iberia
Market Overview
The Iberian electricity market, also known as MIBEL, is a jointly initiative formed by the Portuguese and Spanish Government that aimed to create an interconnected electricity framework. Following the liberalisation directives from the European Union, it was decided to create MIBEL, which allowed any customer in the Iberian Peninsula to acquire electricity under a free competition market, at a unique price, to any producer operating in Portugal or Spain.
Under MIBEL structure, there is a single operator in the Iberian energy market, which is known by OMI. This institution is sub-divided in two different hubs: (1) OMIP, which is controlled by the Portuguese party and operates as a clearing house, assuring the trading activities in the Iberian market; and (2) OMIE, which is controlled by the Spanish government and manages the electricity purchases and sales in the Iberian spot market.
As already mentioned, the main objective of the Iberian electricity market is to provide the customers with a single price for electricity, achieving a complete integration between the two countries in regards to electricity. However, there are some peak times when there is congestion between the two countries, also called overcapacity, and the market has two be split. In this particular context, the single price scenario disappears and there is a spread between the two countries. Therefore, the spread verified in the market in congestion periods is a good metric to assess the integration between the two markets, and thus, the effectiveness of MIBEL. The spread between the two countries electricity market prices have been shrinking, and it is much lower now than one year ago. This also occurs as a consequence of the increasing number of interconnection points between Portugal and Spain. Before this convergence process, Portugal recorded prices well above than its neighbour country, which reflects the effort that was done to create this integrated market.
EDP – ENERGIAS DE PORTUGAL COMPANY REPORT
Portuguese bailout, when the authorities defined a strict calendar for Portugal to restructure its electricity market concerning liberalisation. In fact, the IMF memorandum imposes the full liberalisation in the generation segment until 2017, when most of PPA/CMEC plants should be allocated to the competitive market generation. Regarding electricity supply, the process should be completed earlier, by the end of 2013. EDP should then advise its clients to take a choice regarding their electricity operator. Still, the last resort supply has a three-year period to close its operations.
Electricity Generation
Market Overview
Following the trend in the previous years, electricity generation is expected to increase in the future as well. This trend becomes preeminent when considering the rise in demand that was described in the previous chapter. Thus, the world electricity generation will increase 93% in the next 30 years, from 20.2 trillion KWh in 2010 to 39 trillion KWh in 204010.
Similarly to global energy consumption, electricity generation will grow at a different pace between OECD and non-OECD countries, due to their different stages of development. Developing countries and emerging economies are expected to grow 3.1%11 on an annual basis. This low estimate is based on their less developed energy market, where many people do not have access to electricity. In contrast, OECD countries benefit from a mature and well-established market, which will yield annual growth rates of 1.1%12.
Moreover, it is important to assess how will the production mix evolve and the main reasons behind it. As previously explained, the world is developing concerns about the environmental impact of greenhouse gas emissions and the future price intrinsic to each energy source.
Consequently, when comparing the current production mix with the expected one, according to IEA, the renewable energy sources will record the highest growth rate (2.8%), followed by the natural gas and nuclear, each with a 2.5% growth. Even though coal registers the lowest growth among all the energy sources (excluding liquid fuels) with 1.8%, its relevance for electricity production should remain constant, due to its lower generation costs when compared to gas and liquid fuels.
10
Source: IEA, “World Energy Outlook” 11
Source: IEA, “World Energy Outlook” 12
EDP – ENERGIAS DE PORTUGAL COMPANY REPORT
Other important driver to take into account when deciding the production mix is the fuel price. From a global perspective, the general trend across all energy sources is oriented towards an increase in their prices. The increasing environmental awareness should drive the emissions’ price upwards as well, influencing directly energy sources such as liquid fuels and coal. Consequently, one should expect liquid fuels to have less preponderance in the production mix at global scale. On the other hand, renewable energy sources, mainly represented by hydroelectric power plants and wind, are expected to achieve a higher growth and maximize the amount of energy sold to the system. Nuclear and coal will remain as important energy sources in the production mix, mainly due to their price advantage when compared to its peers. As concerns natural gas, the upward trend in its price seems to lead to a sharp decrease in their load factor. For sure, this will impact negatively the use of this type of energy in the future, since the power players will give priority to cheaper energy sources. In terms of nuclear energy, its main disadvantage lays on the reputational risk. In fact, the accident occurred in Japan had a high environmental and social impact, and thus the economic agents became sceptical about its use in the future. Undoubtedly, this event could impact negatively its future growth.
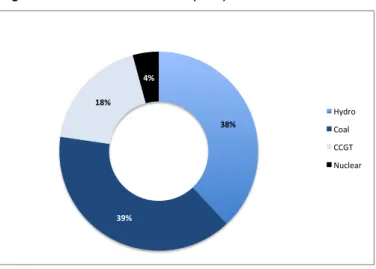
Currently, EDP has an installed capacity in Iberia of 13.1 GW (excluding wind), with a higher focus on hydro (47%) and CCGT (29%). As one can see in figure 16, as concerns EDP’s generation mix in 2018, the most relevant energy sources will precisely be hydro (38%) and coal (39%), while CCGT (18%) and nuclear (4%) will be assigned with a lower relevance. In a global perspective, the low exposure to a specific source of energy could a good strategy to mitigate the main risks related to oil and CO2 emission prices. However, on the other hand, the lack of significant nuclear assets could present a disadvantage of EDP compared to its peers.
Figure 16 - EDP's Generation Mix (2018)
38%$
39%$
18%$
4%$
Hydro&
Coal&
CCGT&
Nuclear&
EDP – ENERGIAS DE PORTUGAL COMPANY REPORT
Regulated Generation
For many years, electricity production was done under a regulated framework of long-term agreements, widely known as PPA contracts, which granted to the producers a steady remuneration, regardless of the volume sold. This gross margin was calculated through a 8.5% ROA plus the annual depreciation and contracted costs. However, since the introduction of the liberalisation process in the 21st century, economic agents began to notice that this framework was against the free market principles.
In 2007, it was decided to replace PPA agreements by other type of contracts, also known as CMEC, which would comply with the competitive market rules and assure a similar NPV. The main reason behind this restructuration was the assurance of liquidity in the system, promoting an efficient Iberian Electricity Market (MIBEL).
In order to maintain the stable cash-flow framework that was in place before, the new CMEC contracts established a compensation scheme dependant of the effective market demand. Thus, if the remuneration achieved in the market place stays below the PPA defined threshold, there should be a reimbursement from the CMEC contract. Otherwise, EDP has to pay a compensatory fee to the system. The CMEC base reflects the difference between the NPV under the PPA contracts and the NPV of a market based scenario that assumes a wholesale price of €50/MWh, at constant values. Consequently, until 2017, there is a yearly
assessment of the market prices, being paid an extra remuneration if the price is different from the one established in the CMEC base. These two compensation schemes are to be paid by the electricity customers every year, being included in the global use of the system tariff. Historically, the remuneration under this regulated scheme has always benefited EDP, since the market assumptions under these contracts were too optimistic compared to reality.
As predicted in the initial memorandum13, the structure of these contracts will be revised in 2017, arising then a considerable risk for the segment. In fact, the deregulation trend in the market will force a decrease in the compensation scheme, impacting significantly the previously defined cash flows. Additionally, from 2017 onwards there will be no yearly revision of the market assumptions, thus EDP will only be assigned with the CMEC base, regardless of the real market price. In that sense, 2017 will be very important for EDP’s regulated generation segment, as the remuneration scheme will be severely impacted. Hence, from that year onwards the remuneration will completely stabilize and will
13
EDP – ENERGIAS DE PORTUGAL COMPANY REPORT
remain independent from the actual market conditions, leading us to calculate an annuity for the segment from 2017 until the end of the ultimate concession. In fact, the CMEC base represents the biggest stake in the contracts’ remuneration scheme. Accordingly, since they replicate the NPV of PPA agreements there is no market or margin risk to EDP in this business, as the gross margins are steady. The only risk that the company could face is the revision risk, since the Portuguese government is planning to apply austerity actions to the sector, following the indications of Troika counsellors. The assumptions under these contracts are being discussed in Portugal both by the government and IMF, which decided to impose a yearly cut of €13 million to the
CMEC base from 2013 until the end of these contracts. In fact, the assumptions behind the definition of the CMEC base are too optimistic and do not reflect accurately the current market conditions.
In conclusion, the energy sector became under the government radar and these regulatory rents could suffer further reductions in the near future if the policy makers feel that the market is reflecting a much lower remuneration to the energy players than the one previously established.
Valuation
As previously mentioned, EDP gross margins in this segment are regulated by PPA/CMEC contracts since 2007, thus they will only vary in case of downward revisions by the Portuguese government. Therefore, the graph below (figure 17) illustrates the distribution of gross margin in every year form 2007 until 2027. Since these gross margins are presented at constant prices, we performed the valuation reflecting the appropriate inflation rate. During this twenty-year period, the power plants will gradually finish their concession under the regulated framework, according to a predefined schedule (figure 18). Once the plants finish their concession, they are automatically transferred to the liberalised generation segment, excluding the thermal plants, which are decommissioned after their regulated operations.
!962!! !900!! !900!!
!787!!
!687!! !687!!
!587!! !587!!
!0!! !116!! !108!! !89!! !105!! !101!! !98!! !102!! !100!! !100!! 1!078!!
1!008!! !989!!
!892!!
!788!! !785!!
!689!! !687!!
!100!!
!0!! !200!! !400!! !600!! !800!! 1!000!! 1!200!!
2010!2011! 2012!2013!2014! 2015!2016! 2017!2018! PPA/CMEC!
Special!Regime!
Total! Figure 17 – EDPR stock price since IPO
EDP – ENERGIAS DE PORTUGAL COMPANY REPORT
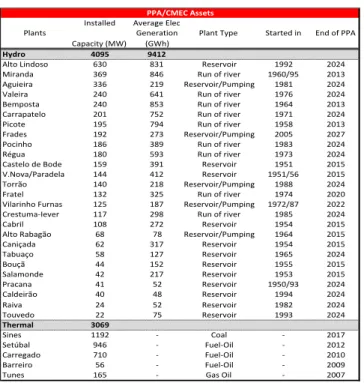
Figure 18 – PPA/CMEC Plants schedule
Since the market is facing a liberalisation trend, it was assumed that all the power plants still in operation in 2017 would be transferred to the liberalised system in the end of that year. Since they would still receive a fixed value (CMEC base) from 2017 to 2027, we decided to calculate an annuity and sum it to the segment’s value.
In regards to the operational costs, they are expected to decrease since they depend directly from the gross margin level. Similarly, EBITDA will also record a downward trend as the activity is reduced and from 2017 onwards only the Special Regime generation will remain in operation.
Capex assigned to this segment will be gradually lower than the historical one. It will only be allocated to the plants’ refurbishment, which depends on the yearly decrease in Installed Capacity, as the power plants are transferred to the liberalised market.
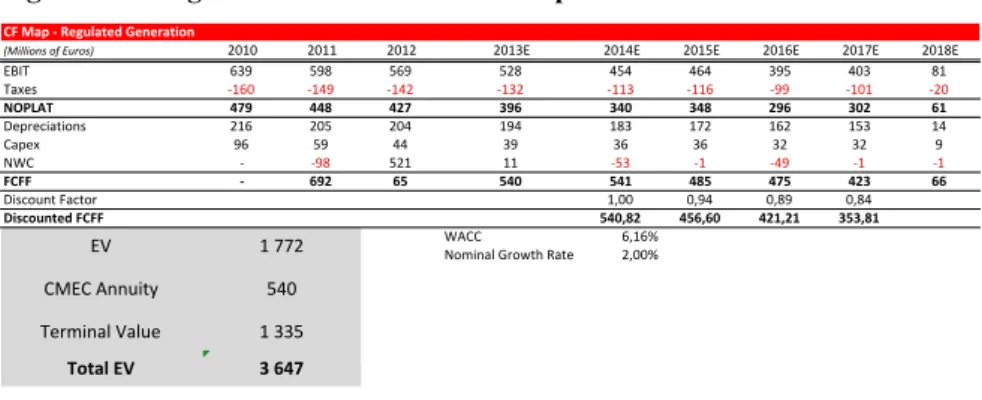
As presented in the table below, this segment has an overall value of €3,647mn,
representing 11% of the total EV. In order to calculate the terminal value, it was only considered the cash-flow correspondent to the special regime generation, since all the plants under PPA/CMEC contracts were transferred to the liberalised market.
Plants
Installed*
Capacity*(MW)
Average*Elec* Generation*
(GWh)
Plant*Type Started*in End*of*PPA
Hydro 4095 9412
Alto*Lindoso 630 831 Reservoir 1992 2024 Miranda 369 846 Run*of*river 1960/95 2013 Aguieira 336 219 Reservoir/Pumping 1981 2024 Valeira 240 641 Run*of*river 1976 2024 Bemposta 240 853 Run*of*river 1964 2013 Carrapatelo 201 752 Run*of*river 1971 2024 Picote 195 794 Run*of*river 1958 2013 Frades 192 273 Reservoir/Pumping 2005 2027 Pocinho 186 389 Run*of*river 1983 2024 Régua 180 593 Run*of*river 1973 2024 Castelo*de*Bode 159 391 Reservoir 1951 2015 V.Nova/Paradela 144 412 Reservoir 1951/56 2015 Torrão 140 218 Reservoir/Pumping 1988 2024 Fratel 132 325 Run*of*river 1974 2020 Vilarinho*Furnas 125 187 Reservoir/Pumping 1972/87 2022 CrestumaUIever 117 298 Run*of*river 1985 2024
Cabril 108 272 Reservoir 1954 2015
Alto*Rabagão 68 78 Reservoir/Pumping 1964 2015
Caniçada 62 317 Reservoir 1954 2015
Tabuaço 58 127 Reservoir 1965 2024
Bouçã 44 152 Reservoir 1955 2015
Salamonde 42 217 Reservoir 1953 2015 Pracana 41 52 Reservoir 1950/93 2024
Caldeirão 40 48 Reservoir 1994 2024
Raiva 24 52 Reservoir 1982 2024
Touvedo 22 75 Reservoir 1993 2024
Thermal 3069
Sines 1192 U Coal U 2017
Setúbal 946 U FuelUOil U 2012
Carregado 710 U FuelUOil U 2010
Barreiro 56 U FuelUOil U 2009
Tunes 165 U Gas*Oil U 2007
PPA/CMEC:Assets
EDP – ENERGIAS DE PORTUGAL COMPANY REPORT
Figure 19 – Regulated Generation – CF Map
Liberalised Generation
Historically, the Liberalised Generation segment within the EDP Group always had a lower relevance. Still, the liberalisation trend that the Iberian electricity market is following will lead to a huge increase in the installed capacity, essentially hydro power plants. In 2012, EDP had an installed capacity of 7377MW in their liberalised generation business unit, of which about 1860MW was hydro, 1460MW was coal and 3736MW was CCGT. In the future, EDP liberalised generation mix will be essentially focused on hydro due to its low dependence on oil prices, CO2 emissions, and also taking advantage of the country’s climacteric conditions for this generation source.
In 2012, EDP liberalised business unit generated only 13,185 GWh of electricity when compared to 15,197GWh in 2011. This increasing production in hydro and coal did not offset the decrease in CCGT of about 3,700GWh. The rise in CCGT generation costs was one of the main drivers for this downward trend, also influenced by the development of shale gas in the United States.
The price at which the producers sell electricity in the market is highly dependant on supply and demand, like every competitive market in the world. However, the way this demand is set is not as straightforward as it may seem. Since the introduction of MIBEL, the producers operating in the Iberian market have to sell their energy in the Iberian pool at the referred market price. Still, this price is not an average market price, but a residual price. That means that the energy offered in the Iberian electricity market obeys to a priority scheme. Under this framework, the special regime production (PRE) has priority over the other sources of energy. If at this point the supply is sufficient to satisfy the whole demand, the price is set and the remaining energy is not sold. If there is still demand to be satisfied, the other types of energy are sold in the system ordered by their marginal cost until supply equals demand and the market equilibrium is reached. Usually, nuclear and hydro are the first ones to be placed due to their lower
CF#Map#'#Regulated#Generation
(Millions(of(Euros) 2010 2011 2012 2013E 2014E 2015E 2016E 2017E 2018E
EBIT 639 598 569 528 454 464 395 403 81
Taxes 31604 31494 31424 31324 31134 31164 3994 31014 3204
NOPLAT 479 448 427 396 340 348 296 302 61
Depreciations 216 205 204 194 183 172 162 153 14
Capex 96 59 44 39 36 36 32 32 9
NWC 3 3984 521 11 3534 314 3494 314 314
FCFF ' 692 65 540 541 485 475 423 66
Discount4Factor 1,00 0,94 0,89 0,84
Discounted#FCFF 540,82 456,60 421,21 353,81
WACC 6,16%
Nominal4Growth4Rate 2,00%
EV 147724
Terminal4Value 143354
Total#EV 3#647#
CMEC4Annuity 5404
EDP – ENERGIAS DE PORTUGAL COMPANY REPORT
Source: Iberdrola
production costs. If there is still demand to be filled, coal and CCGT will be placed.
Generation costs incorporate not only fuel costs, but also CO2 emission costs and hedging results from trading activities. In 2012, hydro (€10/MWh) and
nuclear energy (€4/MWh) registered the lowest generation cost, which also
reflects the absence of CO2 emissions. In contrast, coal (€36/MWh) and CCGT
(€79/MWh) carried extremely high costs, being then the last ones to be called
into the pool. Consequently, one can conclude that the higher the exposure that a company has to low costs’ fuels, the higher is their margin and the more efficient is their generation portfolio. Again, EDP could benefit from a hydro oriented portfolio and therefore achieve higher margins in the pool. However, EDP has a big disadvantage by not having in its portfolio any nuclear plants.
Therefore, it is important to analyse the generation portfolio of EDP’s peers, since in a completely liberalised market this will become a key factor to determine the company’s results. In order to perform this assessment, two important competitors in the Iberian generation market were chosen - Iberdrola and Endesa. As concerns the former one, in figure 20 one can check how significant is the installed capacity in nuclear power plants (3410 MW) when compared to EDP. In fact, the load factor of 87% in this generation source reflects the advantage that Iberdrola could have when selling energy to the pool. As shown below, while the majority of the company’s installed capacity is in hydro (36%), renewables (24%) and gas (23%); the generation mix ends up to mirror the major preponderance of nuclear energy (46%).
Figure 21 - Iberdrola IC Mix (2012) Figure 22 - Iberdrola Gen Mix (2012)
In regards to the latter (Endesa), trends are somehow similar, since the Spanish power player also holds in its portfolio about 3686MW of nuclear plants, with an implicit load factor of 84%. In contrast, the load factors of hydro and nuclear ended up to be much lower at 13% and 35%, respectively. This could be reflected by higher generation prices, and climatic uncertainty in the case of hydroelectric plants. Still, Endesa generation mix reveals a much higher
35%$
13%$
3%$ 23%$
2%$
24%$
Installed$Capacity$Mix$7$Iberdrola$(2012)$
Hydro& Nuclear& Coal& Fuel/Oil& Gas&combined&cycle& Cogenera8on& Renewables&
16%$
46%$ 8%$
5%$ 5%$
21%$
Electricity$Genera4on$Mix$8$Iberdrola$(2012)$
Hydro& Nuclear& Coal& Fuel/Oil& Gas&combined&cycle& Cogenera8on& Renewables&
(Millions(of(Euros) 2011 2012
Number(of(hours/day 24 24
Number(of(days/year 365 365
Installed)Capacity)(MW) 25)612 25)476
Hydro 8*619 8*811
Nuclear 3*410 3*410
Coal 1*253 874
Fuel9Oil 157 0
Gas*combined*cycle 5*893 5*893
Cogeneration 405 394
Renewables 5*875 6*094
Electricity)Generation)(GWh) 63)714 57)137
Hydro 15*043 9*039
Nuclear 24*290 26*026
Coal 2*689 4*396
Fuel9Oil 0 0
Gas*combined*cycle 8*007 2*831
Cogeneration 2*690 2*624
Renewables 10*995 12*221
Load)Factor)(%)
Hydro 20% 12%
Nuclear 81% 87%
Coal 24% 57%
Fuel9Oil 0% 0%
Gas*combined*cycle 16% 5%
Cogeneration 76% 76%
Renewables 21% 23%
Iberdrola:)Key)Data)(Iberia)
Figure 20 – EDPR stock price since IPO
EDP – ENERGIAS DE PORTUGAL COMPANY REPORT
Source: Endesa
importance to thermal energy sources (58%), when compared with hydro (7%) and nuclear (35%).
Figure 23 - Endesa IC Mix (2012)
Figure 24 - Endesa Gen Mix (2012)
After completing this assessment, we are able to analyse EDP’s investment strategy. The company orientation to hydro in the next years is clear, not only there will be PPA/CMEC hydro plants shifting to the regulated market, but also the company is employing further expansion Capex to hydro development in the country. This orientation is important for the success in the future, as we know that the load factors verified in CCGT and coal will never reach their maximum. However, we must not forget that not only hydro plants do not verify a high load factor due to their dependence on weather conditions, but also EDP lacks a significant position in nuclear power generation, which usually benefits from high load factors due to its priority in the system. Still, EDP should take advantage of hydro low generation costs and to the country’s high hydro potential still to be developed.
Valuation
In order to value the liberalised generation business unit, we started by forecasting the gross margins for the future. In that sense, we assumed the pool price and the generation costs to evolve according to our forecasts of future consumption and generation mix. To calculate the generated electricity in each source of energy, we considered each year’s installed capacity and the correspondent load factor. This load factor varied largely according to the type of energy. First, in regards to the nuclear energy, due to their priority in the Iberian pool, typical low generation costs and low dependence on commodity prices, we
20%$
64%$ 16%$
Installed$Capacity$Mix$7$Endesa$(2012)$
Hydro&
Thermal&
Nuclear&
7%#
58%# 35%#
Electricity#Genera2on#Mix#6#Endesa#(2012)#
Hydro&
Thermal&
EDP – ENERGIAS DE PORTUGAL COMPANY REPORT
assumed a load factor of 89%, in line with the past. Second, as concerns hydro energy, the load factor depends a lot on the weather conditions, which may vary largely from one year to the other. Thus, we assumed a load factor of 17%, in line with the last three historical hydrological indexes in Portugal. Third, for coal plants we assumed a 45% load factor justified by their high competitive advantage relatively to CCGT in what concerns generation costs. Finally, for CCGT the average load factor was fixed in 17% due to their huge generations costs, which are expected to evolve similarly to oil prices. Also, their low priority in the Iberian pool had an impact on the lower load factor.
The business unit installed capacity will be more than two times in 2018, mainly driven by the huge increase in hydro investments. EDP recorded in 2012 a Capex of €502 millions, of which €442 was expansion Capex and the remaining
was related with maintenance of the power plants. Actually, EDP has six hydro projects on-going; of which three are new plants (Ribeiradio, Baixo Sabor and Foz Tua) while the other three refer to repowering operations (Alqueva II, Venda Nova III and Salamonde II). In respect to these investments, it is expected EDP to commit with an expansion investment of €300 millions per year in the future.
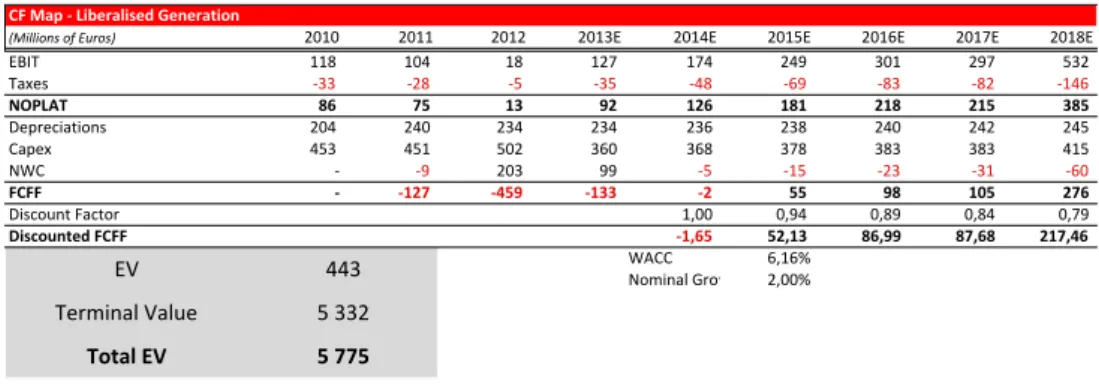
As presented in the table below, this segment totalizes a value of €5,775mn,
representing 18% of the total EV. The majority of this value will arise from the continuing value (92%), since this sector is gaining scale and the returns will arise later in the forecasting period14.
Figure 25 - Liberalised Generation - CF Map
14
The segment’s EBIT is expected to boost in 2018 due to the incorporation of the power plants still operating under the regulated regime in the end of 2017. Consequently, there was a big increase in the installed capacity, which was reflected directly on the operational result. In contrast, the operational result of the regulated generation decreases sharply in 2018.
CF#Map#'#Liberalised#Generation
(Millions(of(Euros) 2010 2011 2012 2013E 2014E 2015E 2016E 2017E 2018E
EBIT 118 104 18 127 174 249 301 297 532
Taxes 3334 3284 354 3354 3484 3694 3834 3824 31464
NOPLAT 86 75 13 92 126 181 218 215 385
Depreciations 204 240 234 234 236 238 240 242 245
Capex 453 451 502 360 368 378 383 383 415
NWC 3 394 203 99 354 3154 3234 3314 3604
FCFF ' '127# '459# '133# '2# 55 98 105 276
Discount4Factor 1,00 0,94 0,89 0,84 0,79
Discounted#FCFF '1,65# 52,13 86,99 87,68 217,46
WACC 6,16% Nominal4Grow 2,00%
EV 4434
Terminal4Value 543324
Total#EV 5#775#
EDP – ENERGIAS DE PORTUGAL COMPANY REPORT
Electricity Distribution
The Iberian electricity distribution business unit operates under a completely regulated framework, where Portugal and Spain energy regulators, ERSE and CNE, define the main parameters.
In Portugal, EDP holds the monopoly of the distribution segment, controlling in 2012 about 223,734 km of network and distributing 19,767 GWh of electricity. In Spain, EDP has the concession in seven different regions (Asturias, Madrid, Valencia, Alicante, Barcelona, Huesca and Zaragoza), characterized by a strong industrial component and a high number of liberalised customers. In 2012, EDP held 22,986 km of network, distributing 9,003 GWh of electricity.
This business unit also comprises the last resort supply activities in Portugal, which currently represent a residual fraction of the business and are expected to close its operations by the end of 2015, as the liberalisation process is going to be completed.
The value creation at the electricity distribution comes mainly from the parameters established by the market regulator. In that sense, ERSE and CNE establish the amount of revenues allocated to EDP through a remuneration rate. This return on the regulated asset base (RAB) is established for a three-year period. Additionally, as an incentive to investment, the depreciations associated to the asset base together with the sector operating expenditures, composed by supplies & services and services and personnel costs, constitute the controlled costs. These costs will sum up to the remuneration on RAB as revenue to EDP. The controlled costs will depend on a price-cap mechanism (CPI-X), which basically determines that the amount of costs in each year are equal to the ones in the year before multiplied by the difference between the inflation (CPI) and an efficiency factor (X) set by the regulator. For example, if ERSE wants to cut controlled costs reported by EDP on their distribution segment, they could set an efficiency factor higher than inflation.
For the regulatory period started in 2012, ERSE set a RoRAB of 9.5% (before taxes), while CNE fixed it on 7.5% (before taxes). The Portuguese RoRAB is indexed to the 5Y Portuguese CDS, avoiding then the volatility associated with the 10Y government bond under distress periods.
Valuation
EDP – ENERGIAS DE PORTUGAL COMPANY REPORT
controlled costs to evolve according to the price cap mechanism, with an implicit efficiency factor of 3.5% in the first years, as suggested by ERSE. Since EDP has a residual non-regulated operation, one could consider additional costs beyond the regulated ones. The RAB for this segment in Portugal was fixed at
€2,737 millions in 2013 and €1,003 millions for Spain. Since this is a mature
business in the Iberian Peninsula, it is not expected EDP to expand its asset base. Therefore, the Capex entitled to the electricity distribution will only refer to maintenance activities and therefore will equal depreciation in every projection year.
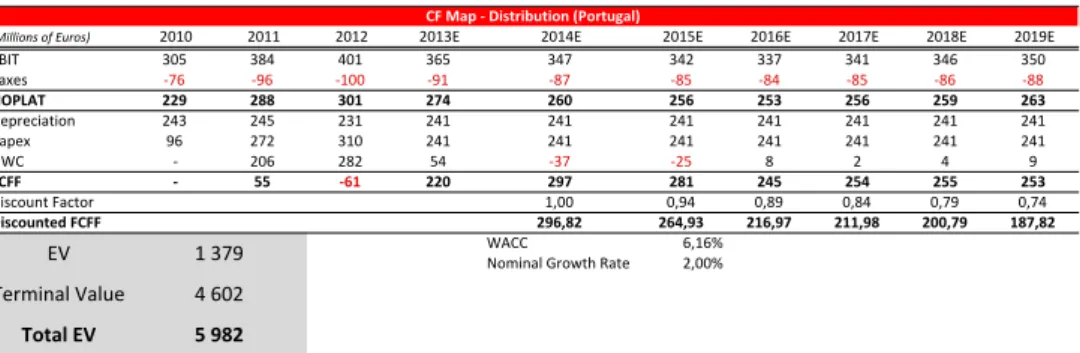
Our valuation for this business unit yielded €5,982mn for Portugal and €1,755mn
for Spain, representing 19% and 5% of the total EV, respectively.
Figure 26 - Distribution PT - CF Map
Figure 27 - Distribution SP - CF Map
(Millions(of(Euros) 2010 2011 2012 2013E 2014E 2015E 2016E 2017E 2018E 2019E
EBIT 305 384 401 365 347 342 337 341 346 350
Taxes 3764 3964 31004 3914 3874 3854 3844 3854 3864 3884
NOPLAT 229 288 301 274 260 256 253 256 259 263
Depreciation 243 245 231 241 241 241 241 241 241 241
Capex 96 272 310 241 241 241 241 241 241 241
NWC 3 206 282 54 3374 3254 8 2 4 9
FCFF 3 55 3614 220 297 281 245 254 255 253
Discount4Factor 1,00 0,94 0,89 0,84 0,79 0,74
Discounted4FCFF 296,82 264,93 216,97 211,98 200,79 187,82
WACC 6,16%
Nominal4Growth4Rate 2,00% CF4Map434Distribution4(Portugal)
EV 143794
Terminal4Value 446024
Total4EV 549824
(Millions(of(Euros) 2010 2011 2012 2013E 2014E 2015E 2016E 2017E 2018E 2019E
EBIT 98 142 94 103 101 101 101 101 101 101
Taxes 3294 3434 3284 3314 3304 3304 3304 3304 3304 3304
NOPLAT 68 99 66 72 71 71 71 71 71 71
Depreciation 33 35 32 34 34 34 34 34 34 34
Capex 3 61 38 34 34 34 34 34 34 34
NWC 3 27 24 3114 314 304 0 0 0 0
FCFF / 46 36 82 72 71 71 71 71 71
Discount4Factor 1,00 0,94 0,89 0,84 0,79 0,74
Discounted<FCFF 71,75 66,54 62,66 59,05 55,68 52,53
WACC 5,86%
Nominal4Growth4Rate 2,00%
Terminal4Value 143874
Total<EV 1<755<
CF<Map</<Distribution<(Spain)
EV 3684
Source: Analyst Estimates