Universidade Nova de Lisboa
Dissertation, presented as partial fulfilment of the requirements for the Degree of Doctor of Philosophy in Economics
Essays on corporate funding and bank lending
relationships
Luciana da Gra¸ca de S´a Barbosa
Student Number 576
A Dissertation carried out on the Ph.D. Program in Economics, under the supervision of Professor Paulo Soares de Pinho
This dissertation comprises three essays on the corporate sector and its relation-ships with banking institutions, exploring detailed micro databases. The first Chap-ter explores the relevance of information underlying working capital and turnover indicators on the probability of default on a bank loan. The second Chapter inves-tigates the main determinants of corporate funding. In addition to bank and trade credit, the analysis also sheds light on loans granted by shareholders or intra-group operations, and tax liabilities. The third Chapter explores firms’ decisions on invest-ment and employinvest-ment through the vulnerability of their lenders to financial market developments, in the context of the euro area sovereign debt crisis.
Essays on corporate funding and bank lending relationships
Abstract v
Acknowledgments xvii
Introduction xix
1 Working capital and tax liabilities as determinants of corporate
credit risk 1
1.1 Introduction . . . 2
1.2 Related literature . . . 4
1.3 Data and variables . . . 10
1.3.1 Data sources . . . 10
1.4.1 Econometric specification . . . 19
1.5 Econometric Results . . . 20
1.5.1 Do activity indicators and tax liabilities contain relevant in-formation? . . . 20
1.5.2 Heterogeneity by firm size . . . 28
1.5.3 Determinants versus predictors of default . . . 32
1.6 Robustness tests . . . 36
1.7 Final Remarks . . . 37
Appendices 41 2 Structure of corporate funding 55 2.1 Introduction . . . 56
2.2 Related literature . . . 58
2.3 Data and variables . . . 63
2.3.1 Data sources . . . 63
2.3.2 Descriptive statistics . . . 64
2.4 Econometric approach . . . 70
2.5 Determinants of firms funding sources . . . 71
2.5.1 Capital structure variables . . . 71
2.5.2 Delving deeper into firm activity . . . 77
2.5.3 Banking lending relationships . . . 80
2.6 Heterogeneity by firm size . . . 83
2.7 Robustness tests . . . 89
2.8 Final Remarks . . . 90
Appendices 95 3 Lending relationships and the real economy: evidence in the con-text of the euro area sovereign debt crisis 105 3.1 Introduction . . . 106
3.2 Related literature . . . 109
3.3 The Portuguese International Economic and Financial Assistance Pro-gramme: Main facts on the banking system . . . 115
3.4 Data and descriptive statistics . . . 118
3.4.1 Data sources . . . 118
3.4.2 Data set . . . 119
3.6 Empirical results . . . 127
3.6.1 Empirical specification . . . 127
3.6.2 Econometric results . . . 128
3.6.3 Firms’ decisions sensitivity over time . . . 136
3.7 Alternative Approach . . . 138
3.7.1 Alternative empirical specification . . . 138
3.7.2 Econometric results . . . 142
3.8 Robustness . . . 147
3.9 Final Remarks . . . 149
Appendices 153
1.1 Sample summary statistics . . . 15
1.2 Descriptive statistics: Non-default versus default firms . . . 17
1.3 General statistics description by firm dimension . . . 18
1.4 Logit regression - Dependent variable: default . . . 26
1.5 Logit regression - Dependent variable: default - Activity indicators . . 27
1.6 Logit regression by firm dimension - Dependent variable: default . . . 30
1.7 Logit regression - Dependent variable: default - with lag regressors . . 35
I.1 Variables definition . . . 41
I.2 Correlation matrix . . . 42
I.3 Logit regression - Dependent variable: default - Activity indicators . . 43
I.4 Logit regression by firm dimension - Dependent variable: default . . . 44
regressors . . . 48
I.8 Dependent variable: default - Cash cycle and Government net position 49 I.9 Dependent variable: default - Cash cycle and Government net posi-tion - lag regressors . . . 50
I.10 Alternative econometric approach - Dependent variable: default . . . 51
I.11 Alternative econometric approach - Dependent variable: default - by firm size . . . 52
I.12 Alternative econometric approach Dependent variable: default -with lag regressors . . . 54
2.1 Funding sources at the aggregate level - Weighted average . . . 66
2.2 Funding sources - Distribution in the dataset . . . 67
2.3 Funding sources by firm size and age . . . 68
2.4 Summary statistics - Firm characteristics . . . 70
2.5 Capital structure standard regressors . . . 76
2.6 Additional regressors: Activity indicators . . . 79
2.7 Banking lending relationships and credit quality . . . 82
2.8 Capital structure standard regressors - by firm size . . . 85
II.1 Variables definition . . . 95
II.2 Correlation matrix . . . 96
II.3 Summary statistics - Firm characteristics - 2006-09 . . . 97
II.4 Summary statistics - Firm characteristics - 2010-12 . . . 97
II.5 Capital structure standard regressors - Sub-periods . . . 98
II.6 Additional regressors: Activity indicators - Sub-periods . . . 99
II.7 Capital structure standard regressors - All funding positive . . . 100
II.8 Additional regressors: Activity indicators - All funding positive . . . 101
II.9 Capital structure standard regressors - Balanced panel data . . . 102
II.10 Additional regressors: Activity indicators - Balanced panel data . . . 103
3.1 Sample summary statistics . . . 123
3.2 Firm’s decisions: investment and employment . . . 124
3.3 Sample summary statistics - Firm characteristics . . . 125
3.4 Descriptive statistics - Lenders’ Indicators . . . 127
3.5 Firms’ investment decisions . . . 132
3.6 Firms’ employment decisions . . . 135
III.1 Variables definition - Firms . . . 157
III.2 Sample summary statistics - Firm characteristics . . . 158
III.3 Variables definition - Lenders . . . 159
III.4 Correlation Matrix: Investment, employment, and lenders’ character-istics . . . 160
III.5 Firms’ investment decisions - yearly approach . . . 161
III.6 Firms’ employment decisions - yearly approach . . . 162
III.7 Alternative approach: Firms’ investment . . . 163
III.1 PT sovereign bonds (10 years) . . . 153
III.2 Credit default swap spreads of Portuguese banks (5 years senior) . . . 154
III.3 Outstanding amounts of monetary policy operations of resident banks 155
“Eles n˜ao sabem, nem sonham, que o sonho comanda a vida, que sempre que um homem sonha o mundo pula e avan¸ca
como bola colorida
entre as m˜aos de uma crian¸ca.”
in Pedra Filosofal, Ant´onio Gede˜ao
Doing a PhD and writing the dissertation is a long, challenging, and sometimes difficult project. Writing these few words on this page means that the journey is near its end. Looking back, the support and help of several persons were crucial. I would like to sincerely acknowledge them.
First of all, I express my gratitude to my advisor Paulo Soares de Pinho for his guidance, discussions, and insights during all the research period. I am also grateful to Miguel Ferreira for his helpful suggestions and fruitful discussions, and Charles Kahn for the discussions, suggestions, and support, mainly during my visit to the Financial Department of the University of Illinois.
kind word to Carlos Santos and Lu´ısa Farinha. I am grateful to their encouragement, trust, and understanding of the difficulties of balancing work and a PhD project. I would also like to express my appreciation to Banco de Portugal for support and access to enumerable research materials. I am also thankful to Heitor Almeida, Rui Albuquerque, and Steven Ongena for the opportunity to discuss this work during their visits to Banco de Portugal.
I want also to extend my acknowledgments to my colleagues in the PhD Program, especially Ana Gouveia, Ana Rita Mateus, Daniel Carvalho, and Sara Serra. Their support and team work were crucial during this adventure. I am also thankful to Ant´onio Antunes and Geraldo Cerqueiro for their constructive discussions and comments. A kind acknowledgment to Diana Bonfim, Hugo Reis, and Paula Ant˜ao for their useful suggestions, but mainly for their friendship and support to pursue the objective: “a PhD is not a sprint run, it’s more similar to a marathon”.
My gratitude also goes to my family and friends for their encouragement, as well as their patience and comprehension of my absence in several events during this long journey. Finally, a deep gratitude to my Parents, Abel Barbosa and Maria dos Prazeres Barbosa, as well as my Grandmother Mar´ılia: Thank you for everything!
Luciana Barbosa
The three essays that comprise this dissertation focus on the corporate sector and its interaction with the banking system, exploring corporate credit risk, different firms’ funding sources and constraints on firms’ decisions in the context of the recent euro area sovereign debt crisis.
The first Chapter focuses on corporate credit risk regarding banking liabilities. In this Chapter we investigate if a deeper analysis of liquidity and turnover in-dicators contain additional insights regarding firms’ probability of default. These variables are usually identified as relevant financial indicators in empirical literature. However, they may reflect different firms’ operational activity and efficiency man-agement. Therefore, we explore if the breakdown of working capital and turnover into variables related with cash holdings, activity indicators, investment turnover, and tax liabilities contains relevant information for determining a firm’s probability of a bank credit default, controlling for other variables. According to the results, we observe that firms that take longer to repay their suppliers have higher probabilities of default. There is also evidence of a positive relationship between firms’ credit risk and the share of tax liabilities. The results highlight the link between tax liabilities and accounts payable with firm’s financial vulnerabilities, and their contribution in corporate credit risk analysis.
ferent characteristics and requirements for firms. Hence, it is important to improve the knowledge of firms’ leverage, which is high in several European countries, and consequently identify potential vulnerabilities of firms to financial and economic de-velopments. Against this background, the analysis presented in the second Chapter identifies the main determinants of the composition of corporate liabilities. In addi-tion to bank and trade credit, two major external finance sources, we also include in the analysis tax liabilities and loans granted by shareholders or intra-group opera-tions. The analysis of these components is not so well documented in the literature, but these sources seem to be particularly relevant in some firms’ segments. The results obtained suggest that some firms’ characteristics present a similar impact on the alternative funding sources, such as profitability, while others show a heteroge-neous effects. Moreover, the results suggest the importance of variables related to firms’ activity and business risk in their funding structures.
Working capital and tax liabilities
as determinants of corporate
credit risk
Abstract: Liquidity and turnover indicators are usually mentioned as important
dimen-sions in the corporate credit risk literature. However, these variables may reflect different firms’ operational activity and efficiency management. This study explores if the break-down of working capital and turnover into variables related to cash, activity indicators, investment, and tax liabilities contains relevant information in determining a firm’s prob-ability of a bank credit default event, controlling for other variables. According to the results, we observe that firms that take longer to repay their suppliers have higher prob-abilities of a credit default event. Moreover, there is evidence of a positive relationship between firms’ credit risk and the share of tax liabilities. These indicators seem to be a signal about a firm’s financial fragilities.
JEL Classification: G21, G33, C25
1.1
Introduction
Corporate credit risk has received great interest in the financial and banking litera-ture. In the banking perspective, the asymmetric information in the credit market between entrepreneurs and lenders is critical. For credit risk management, it is cru-cial to assess a firm’s financru-cial position and identify its vulnerabilities in order to determine the price of a loan, or to decide even about its approval (Stiglitz & Weiss (1981)). Afterwards, a careful monitoring of the firm’s financial developments is also required, given the impact of default events on banks’ provision and impairment poli-cies, as well as on regulatory capital requirements. Over the last decade, there has been a renewed interest about credit risk management and measurement supported by financial innovations, competition policies, and computational improvements. Additionally, under the Basel II Capital framework, banks were allowed to use in-ternal credit risk models in order to determine their capital requirements. Thus, banks had developed several techniques to analyze firms’ financial positions, prob-ability of default, and other credit risk parameters. More recently, the economic and financial crises, and the significant increase in the materialization of credit risk, reinforced the importance of a close monitoring of the firm’s financial position and credit risk standards.
underlying differences related to firms’ operational cycle, efficiency, or even the man-agement of inflows and outflows, and consequently potentially different assessments of firms’ financial soundness.
In this analysis we combine micro data for Portuguese firms from the Central Balance Sheet Database with information about credit status and banking rela-tionships from the Central Credit Register, both databases available at Banco de Portugal. As these databases are quite exhaustive, the data set allows a high cov-erage of banks’ exposure to the corporate sector. It also allows exploring corporate heterogeneity, analyzing different firms’ segments. In the econometric analysis we apply a logit model for panel data to assess the relevance of firm’s characteristics in its probability of default.
According to the results obtained, the breakdown of firms’ working capital and turnover improves the analysis of the probability of default. In particular, the indi-cators related to firm’s activity, such as management of inflows and outflows contain additional information regarding firms’ financial positions. The results also highlight the relevance of tax liabilities as an indicator of firms’ financial fragilities. Thus, these results suggest the value of a close analysis of a firm’s activity as an indication of that firm’s financial soundness. Moreover, the results suggest a relationship be-tween tax liabilities and a firm’s financial fragility, and consequently this dimension should be included in corporate credit risk analysis.
1.2
Related literature
Credit risk is related to the possibility of losses due to changes in the credit quality of the counterparts. Much of the literature on corporate credit risk is related to modeling default events,i.e. the failure of a firm to meet the terms agreed in credit contracts. Several quantitative models have emerged in this field.
For firms with publicly traded equity or debt, there are the structural or reduced-form models (see Bielecki & Rutkowski (2002)), depending on the inreduced-formation avail-able. Structural models focus on modeling and pricing credit risk of a firm, in which the firm’s asset value assumes a crucial role. These models intend to link the credit events, mainly default situations, to the firm’s fundamentals. One of the most popular structural models was developed by Merton (1974). According to Merton’s model, a firm’s equity value is similar to a call option on the value of its assets, where the strike price is the value of the liabilities. In this framework, default occurs when the firm’s asset value falls below the value of its liabilities at maturity date.1 In line with this model, the credit risk of a firm is essentially driven by the dynamics of the asset value and the respective volatility, taking the value of liabilities as given: the greater the value of the firm, and the less its volatility, the lower the probability of a default event.2 Several studies have explored this model in determining the probability of default for firms. Moody’s - KMV model (Moody’s (2004)) is one of the most well known. In turn, under reduced form models (suggested in Jarrow
1
Note that default event is different from bankruptcy. The latter occurs when the firm is liquidated, i.e. it is not able to pay own debts. Bankruptcy is based on a legal definition, and so it is a country-specific concept. Default corresponds to a delay in payments according to the pre-defined terms of credit contracts.
2
The number of standard deviations that a firm’s asset value is away from the default point is defined as distance-to-default. Generally, distance-to-default (DD) is the distance between the firm’s asset value in one year E(V1) and the default point (DP T), based on liabilities’ structure
maturity, expressed in standard deviations of assets’ value (assets’ volatility):
DD= (E(V1)−DT P)/σV
& Turnbull (1992)), the firm’s assets value is not modeled and default events are specified exploring some exogenous process.
Despite the attractiveness of these approaches, and the forward looking perspec-tive that market data incorporates, their implementation is limited by the availabil-ity of these data. This is an important issue for several European countries, given that the fraction of listed firms or firms with access to debt markets is quite limited. This fraction is even lower for firms that are traded on a regular basis.3
Much of the empirical literature relies on more traditional approaches in order to explore the firm’s idiosyncratic risk factors and its creditworthiness. In particular, these studies intend to identify the contribution of firms’ financial indicators, mainly based on accounting data, and other general firms’ characteristics in determining the probability of a default event. Even though the limitations of accounting data (lack of theoretical support, and the backward perspective), some studies, such as Demirovic & Thomas (2007) and Agarwal & Taffler (2008), found evidence that accounting-ratio approaches are also meaningful in credit risk analysis. Demirovic & Thomas (2007) found evidence that accounting variables contain incremental information when added to an approach with market measures. Agarwal & Taffler (2008) found that traditional models are robust and not inferior to market-based models.4
3
The empirical research explores corporate credit risk in different perspectives, using different data and methodologies. The seminal empirical papers analyzing the relevance of financial variables in identifying firms’ default go back to the 1960s with Beaver (1966) and Altman (1968). Beaver (1966) found that several ratios present significant differences between failed and viable firms. He also observed that those differences increased as the time to a failure decreased. Using a set of some financial variables, Altman developed a weighted linear indicator to identify distress and non-distress firms. The Altman’s indicator, known asZ-score, has persisted as a benchmark until the present day in corporate credit risk literature.5
Over the following decades, the empirical literature on corporate default was extensive. Despite a lack of consensus in the literature regarding which firms’ char-acteristics should be considered as more important in modeling default events, a pattern among the variable selection suggests the importance of some categories of indicators. Looking at financial indicators, measures related to profitability, lever-age, and liquidity are within those typically found as relevant in determining firms’ default. Other firms’ characteristics, such as size, age, and business sector were also highlighted in empirical research (see, for instance, Bunn & Redwood (2003), Benito et al. (2004), Carling et al. (2007), Lacerda & Moro (2008), and Bonfim (2009)).
As a complement to firm-specific information, the macroeconomic and financial environment has also been included in the credit risk empirical literature. This was motivated by the fact that average default frequency and firm default probabilities present some co-movements with macroeconomic and financial variables. This
sug-facts that justify that the account ratios should also be assessed in credit risk perspective. The authors argued that corporate failure events are not a sudden episode. In general, failures occur after some years with adverse performances, with impact on firms’ accounting financial state-ments. They also highlighted that several loan covenants (in credit contracts) are defined based on accounting indicators.
5
gests that aggregate shocks can be a driver of corporate default.6 Actually, Duffie et al. (2007), Pesaran et al. (2006), Jacobson et al. (2013), and Bonfim (2009), for instance, show that (in addition to the firm’s idiosyncratic characteristics) macroe-conomic environment variables improve the prediction of the probability of default models.
Some avenues of credit risk literature also explored the relevance of trade credit in corporate default, as well as bank lending relationships. Actually, trade credit plays an important role as external funding source for firms in several countries. One of the main questions is related to a firm’s choice between bank and trade credit, as trade credit is perceived as more expensive (based on implicit interest rate). The literature presents several reasons for their coexistence. Some arguments are related to financial factors, while others are related to the non-financial role of trade credit, such as transaction costs, price discrimination, warranty of product quality, or customer relationships, (e.g. Petersen & Rajan (1997)). On the financial perspective, many studies emphasize that firms use trade credit because there are bank credit constraints (e.g. Petersen & Rajan (1994), Nilsen (2002), and Cu˜nat (2007)).7 These studies support the hypothesis that firms use other available forms of credit before trade credit as a funding source. In this context, non-bank private markets complement banks and public funding sources (financial markets) mainly for lower credit quality firms. Nevertheless, according to Biais & Gollier (1997) and Burkart & Ellingsen (2004), for instance, trade and bank credits can be either complements or substitutes. This argument is based on the fact that the suppliers may have a comparative advantage over banks in collecting information on firms, in assessing their creditworthiness, and in monitoring their actions. Giannetti et al.
6
See, for instance, the initial analysis presented in Bonfim (2009), or the Financial Stability Reviews of European Central Bank or Banco de Portugal.
7
(2011) also supports the complementarity between trade and bank credit.
According to the bank lending relationship literature, the firm-bank relationship is crucial in mitigating asymmetric information. This is especially important for smaller and younger firms, for which information is scarcer. A lending relationship may help to overcome this problem given that banks obtain firms’ private informa-tion through repeated interacinforma-tions (Diamond (1984)). Thus, the literature suggests that firms that borrow from a small number of banks, or even concentrate a sub-stantial part of their funding in a single relationship, tend to record lower financing constraints and obtain more favorable credit conditions.8,9However, a non-negligible fraction of firms has more than a single lending relationship. The stability and effi-ciency of lending relationships depend on several factors, both in banks’ and firms’ perspectives. For instance, there are hold-up issues (information rents), market competition pressure, and banks’ portfolio diversification incentives (e.g. Sharpe (1990), Rajan (1992), Detragiache et al. (2000), Von Thadden (2004), and Carletti et al. (2007)). The link between the number of banking relationships and a firm’s credit quality has also been explored, but the arguments are mixed. Some authors argue that a single relationship may be driven by potential refusal of credit from other banks. Hence, it may be a negative signal to the market, making exclusive bank relationships undesirable. Other authors report evidence that firms with lower credit quality tend to establish multiple lending relationships (e.g. Detragiache et al. (2000), Degryse & Ongena (2001), Farinha & Santos (2002), and Fok et al. (2004)).
Looking at the Portuguese corporate sector, there are also some studies exploring 8
For instance, an increase in the number of lending relationships decreases the amount of credit (Petersen & Rajan (1994), Cole (1998), and Harhoff & Korting (1998)), while longer relationships increase the availability of credit (Petersen & Rajan (1994), Harhoff & Korting (1998)), and con-tribute to a decrease in collateral requirements (Harhoff & Korting (1998), and Berger & Udell (1995)). Looking at interest rates, the empirical evidence is mixed (e.g. Berger & Udell (1995), Petersen & Rajan (1994), and Bonfim et al. (2008)).
9
1.3
Data and variables
1.3.1
Data sources
The empirical analysis performed in this study is based on the information of the Central Balance Sheet Database (CB) and the Central Credit Register (CRC), both available at Banco de Portugal.10
The CB contains financial information, based on balance sheet and profit and losses account, as well as other firm characteristics, such as the economic activity sector, and the date of set up. Since 2006, instead of a voluntary survey, the annual CB is based on Simplified Corporate Information (Informa¸c˜ao Empresarial Simpli-ficada - IES), which is a joint project of Bank de Portugal, Ministry of Justice, Ministry of Finance, and the Portuguese Institute of Statistics. IES also contains financial and non-financial data, as previously reported in the survey approach, but it covers virtually the entire Portuguese corporate sector.11
The CRC contains information regarding the credit granted by financial institu-tions operating in Portugal. This database, which is mandatory and reported on a monthly basis to Banco de Portugal, contains the total outstanding amount of loans, unused credit lines, and information for credit overdue, among other components. Thus, due to the low threshold required for the report (loans above 50 euros), CRC contains nearly all the credit exposures of the banking system to Portuguese firms.12
10
Occasionally,Quadros de Pessoal database (QP) was also used to complement some
informa-tion regarding firm’s employees.
11
IESis an electronic submission of information of accounting, fiscal and statistical nature that
firms have usually to submit to several Portuguese authorities, namely Ministry of Justice, Ministry of Finance, Statistics of Portugal, and Banco de Portugal. Thus, instead of firms submitting nearly the same information to the different entities, at different moments of time, and in different reports, as occurred before 2006, with theIESsystem they do it once. As all firms are expected to submit the report,IESallows a high coverage of the Portuguese corporate sector by the Central Balance Sheet Database of Banco de Portugal.
12
In order to explore IES information, which has broad coverage of the Portuguese corporate sector and simultaneously avoids the possible sample bias that voluntary surveys may induce (especially toward firms with better financial position), the period under analysis is limited to 2006 - 2009. The sample period ends in 2009, given that some variables explored in the current analysis (and discussed in following sections in this Chapter), were discontinued from 2010 on.13
Moreover, some selection criteria were imposed. First, the financial sector and public administrations were excluded, as well as observations with misreported data for total assets, business volume, number of employees, and age. Furthermore, firms with fewer than five employees were also ruled out. Then, observations with extreme values for some variables included in the analysis were excluded (1 per cent of the tails of the respective distributions), which allows controlling for extreme outliers.
After these steps, given the purposes of this study, we restricted the sample to firms that are simultaneously on the two databases, i.e. on both IES and CRC. In other words, we restricted the sample to firms with relationships with the fi-nancial system. Combining all the criteria, the data set comprises around 230,700 observations.
1.3.2
Determinants of firm default
This study analyzes if some components underlying working capital and turnover contain relevant information for determining the probability of default of a firm. Simultaneously, firm’s business risk is included in the analysis, in line with the
struc-respectively.
13
tural models, in which volatility is one of the key elements. Other firm characteristics and macroeconomic developments were also controlled for, given their relevance in determining a default event, as discussed in the literature section. Moreover, fol-lowing the banking relationship literature, the firm’s relationships with the banking system were also included in the analysis. In general, we have:
Prob(Def aulti,t) =f(working capital and turnover componentsi,t;
other characteristicsi,t; banking relationshipsi,t;
business riski; macroeconomic environmentt) (1.1)
where the left-hand side is the probability of default of firmiat the periodt. The right-hand side includes a set of several variables that may be underlying a firm’s default.
A default event is defined when a firm has bank credit overdue for a period longer than three consecutive months (flagged in the CRC), evaluated at the end of the year, and greater than 500 euros.14
Looking at firm characteristics, working capital(WORKING CAPITAL), defined as the ratio of current assets net of current liabilities over total assets, is a relevant in-dicator in the financial analysis of a firm, given that it represents operating liquidity and liabilities commitments in the short-run. Debt holders are usually concerned with a firm’s liquidity, since they are concerned about the payment of the initial loan, but also with the ongoing payments. Earlier studies identified liquidity as a relevant variable in determining default events, with a negative relationship (e.g.
14
Altman (1968) and Bhimani et al. (2010)). However, working capital requires a careful analysis. For instance, an increase in this indicator may reflect firms’ deci-sions that might help to minimize stock-out events or even stimulate sales. However, an increase in this ratio may also reflect a build up of inventories (and money is tied up in inventories) or credit to customers. In these cases, the firm cannot use it to pay off any of its commitments. Therefore, an increase in working capital may have underlying negative developments in the firm’s financial health and increase its vul-nerabilities. The turnover variable(TURNOVER), defined as sales over total assets, is related to the firm’s efficiency, as it indicates how a firm uses assets in its business. A high volume of sales into total assets means that the firm takes advantage of its investments.
In this study, working capital and turnover indicators are decomposed into some underlying components related to cash holdings, investment turnover, and activity indicators, namely accounts receivable, accounts payable, and inventories, in order to identify the firm’s operational fragilities that may induce default. Additionally, we also include in the analysis the share of tax liabilities. Bernhardsen & Larsen (2007) explored trade accounts payable and unpaid taxes in the extended version of a model to analyze banks’ credit risk exposures to the corporate sector, in addition to other financial ratios, age, size, and industry.
Looking at the other variables included in the analysis (equation 1.1), the compo-nent “other firm characteristics” includes accounting and non-accounting indicators, in line with the empirical finding discussed above. Concerning accounting data, the analysis includes measures related to leverage (LEVERAGE), sales growth (SALES
GROWTH), interest coverage by earning before interest, depreciation, and
amorti-zation (ebitda) (INTEREST COVERAGE), as well as the coverage of total liabilities
capital and interest through the ongoing operational income.15 Note that according to the ebitda multiple approach, a standard procedure adopted in the valuation of firms, the coverage of firms’ liabilities by ebitda can be seen as a proxy for the cov-erage of debt by the firm’s market value, for firms belonging to the same business sector.16 The set of variables also includes firm size, based on the natural logarithm of real total assets (SIZE). Concerning non-accounting data, age (AGE) and changes in the number of total employees (CHANGE EMPLOYEES) were also included. Fur-thermore, business sectors were controlled for, given that financial ratios should be assessed in conjunction with the nature of the firm and the market in which the firm operates. Moreover, the literature also highlights that there are relevant differences in default by business sectors.
In turn, for business risk the proxy was the volatility of cashflow over total assets
(SD CASHFLOW). Banking relationships comprise the number of total relationships,
defined at the banking group level and taking into account the weight of each banking group in the firm’s total bank debt (BANKING RELATIONSHIPS). The analysis also includes the absolute change in the number of banking relationships over the year
(CHANGE BANK RELATIONSHIP), as well as the availability of unused credit lines
(CREDIT LINE).
Finally, in order to control for the economic and financial environment, time dummies were included in the specification, or alternatively the GDP year-on-year growth rate (GDP) and the average interest rate applied on loans to non-financial corporations (INT RATE). Table I.1 in the Appendices Section of this Chapter
sum-marizes the definition of each variable. Table I.2 presents the correlation matrix
15
In order to avoid potential collinearity in the regressors, a direct measure of profitability was not included in the specifications. Indeed, in the correlation matrix included in the Appendices
Sec-tion of this Chapter, we can observe thatDEBT COVERAGE andINTEREST COVERAGEare highly
correlated with the profitability indicator (PROFITABILITY), measured by operational returns over total assets.
16
between the variables.
1.3.3
Descriptive statistics
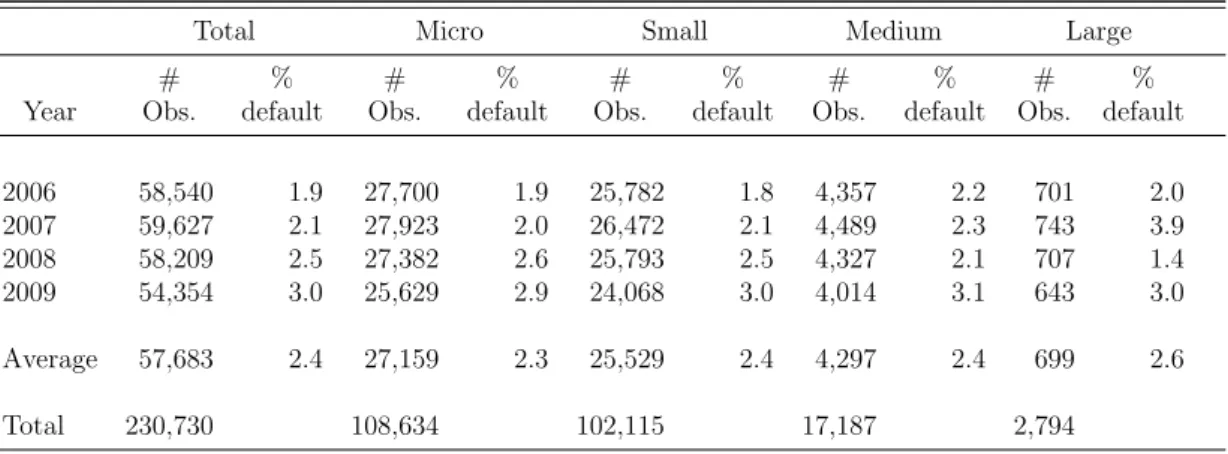
This sub-section presents some summary statistics of the data set used in this study, including a breakdown by default and non-default firms and by firms’ size (based on the recommendation of the European Commission).17 In Table 1.1 we see that micro and small firms represent most of the data set (around 90 per cent). In turn, in the sample period, the fraction of default events is small in the total sample, as well as in each firm’s dimension class. Nonetheless, there is a gradual increase of this fraction, in general, over the period under analysis, which is in line with macroeconomic and financial developments, and supports the cyclicality of default events.
Table 1.1: Sample summary statistics
Total Micro Small Medium Large
# % # % # % # % # %
Year Obs. default Obs. default Obs. default Obs. default Obs. default
2006 58,540 1.9 27,700 1.9 25,782 1.8 4,357 2.2 701 2.0
2007 59,627 2.1 27,923 2.0 26,472 2.1 4,489 2.3 743 3.9
2008 58,209 2.5 27,382 2.6 25,793 2.5 4,327 2.1 707 1.4
2009 54,354 3.0 25,629 2.9 24,068 3.0 4,014 3.1 643 3.0
Average 57,683 2.4 27,159 2.3 25,529 2.4 4,297 2.4 699 2.6
Total 230,730 108,634 102,115 17,187 2,794
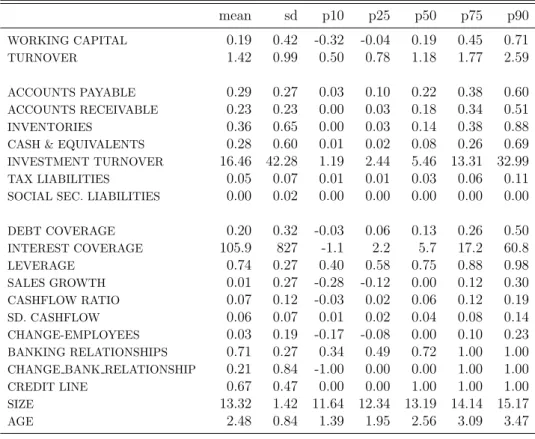
The differences between default and non-default firms are illustrated in Table 1.2. This table has some descriptive statistics of firm characteristics included in the two groups of firms. It is noteworthy that the sample mean of firm characteristics for the
17
two groups are statistically different according to the Welch test.18 Thus, firms that do not fulfill their credit commitments seem to present some particular features.
Default firms reveal lower levels of working capital and turnover in comparison to non-default firms. They also show lower coverage of liabilities and interest by ebitda, sales growth and employees changes. Moreover, these firms show lower levels of cashflows and higher volatility. In turn, default firms have significantly higher leverage ratios. Note that the leverage ratio of the percentile 25 of default firms is close to the percentile 50 figure of non-default firms. Looking at bank lending relationships variables, default firms show a lower concentration of total debt, which means that these firms tend to establish more banking relationships than non-default firms (or at least, tend to have greater dispersion of credit among their lenders).
Looking at some components underlying working capital and turnover indicators, default firms have higher levels for the activity indicators,i.e. for accounts payable, accounts receivable, and inventories indicators. Default firms show lower cash re-serves, and investment turnover. These firms also present a significantly higher proportion of tax liabilities over total assets.
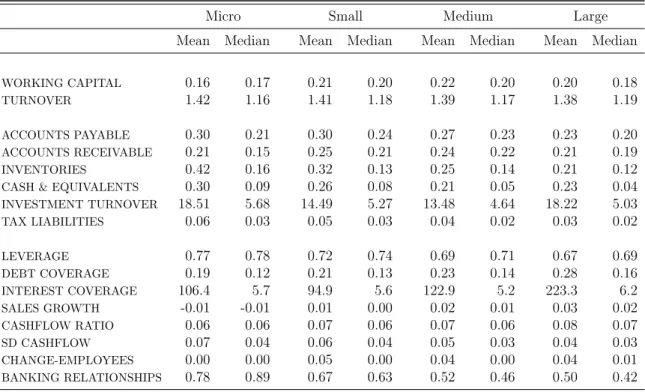
Table 1.3 has the mean and median figures of some variables by firm size, given the potential difference of some of these characteristics by firm dimension, in line with diversified activity and information opaqueness of firms.
A positive relationship is broadly observed for working capital, while there is no significant variation for assets turnover. Concerning activity indicators, there is a negative relationship for inventories and accounts payable, while for accounts re-ceivable the relationship is not monotonic. Investment turnover seems to present a U-shape relationship. The same path applies, in general, for the coverage of interest
18
Table 1.2: Descriptive statistics: Non-default versus default firms
Panel A - Non-default firms
mean sd p10 p25 p50 p75 p90
WORKING CAPITAL 0.19 0.42 -0.32 -0.04 0.19 0.45 0.71
TURNOVER 1.42 0.99 0.50 0.78 1.18 1.77 2.59
ACCOUNTS PAYABLE 0.29 0.27 0.03 0.10 0.22 0.38 0.60
ACCOUNTS RECEIVABLE 0.23 0.23 0.00 0.03 0.18 0.34 0.51
INVENTORIES 0.36 0.65 0.00 0.03 0.14 0.38 0.88
CASH & EQUIVALENTS 0.28 0.60 0.01 0.02 0.08 0.26 0.69
INVESTMENT TURNOVER 16.46 42.28 1.19 2.44 5.46 13.31 32.99
TAX LIABILITIES 0.05 0.07 0.01 0.01 0.03 0.06 0.11
SOCIAL SEC. LIABILITIES 0.00 0.02 0.00 0.00 0.00 0.00 0.00
DEBT COVERAGE 0.20 0.32 -0.03 0.06 0.13 0.26 0.50
INTEREST COVERAGE 105.9 827 -1.1 2.2 5.7 17.2 60.8
LEVERAGE 0.74 0.27 0.40 0.58 0.75 0.88 0.98
SALES GROWTH 0.01 0.27 -0.28 -0.12 0.00 0.12 0.30
CASHFLOW RATIO 0.07 0.12 -0.03 0.02 0.06 0.12 0.19
SD. CASHFLOW 0.06 0.07 0.01 0.02 0.04 0.08 0.14
CHANGE-EMPLOYEES 0.03 0.19 -0.17 -0.08 0.00 0.10 0.23
BANKING RELATIONSHIPS 0.71 0.27 0.34 0.49 0.72 1.00 1.00
CHANGE BANK RELATIONSHIP 0.21 0.84 -1.00 0.00 0.00 1.00 1.00
CREDIT LINE 0.67 0.47 0.00 0.00 1.00 1.00 1.00
SIZE 13.32 1.42 11.64 12.34 13.19 14.14 15.17
AGE 2.48 0.84 1.39 1.95 2.56 3.09 3.47
Panel B - Default firms
mean sd p10 p25 p50 p75 p90
WORKING CAPITAL 0.03 0.45 -0.55 -0.23 0.04 0.30 0.61
TURNOVER 0.86 0.71 0.28 0.44 0.68 1.05 1.59
ACCOUNTS PAYABLE 0.58 0.45 0.08 0.25 0.49 0.80 1.22
ACCOUNTS RECEIVABLE 0.33 0.31 0.00 0.06 0.26 0.49 0.78
INVENTORIES 0.51 0.91 0.00 0.02 0.17 0.56 1.41
CASH & EQUIVALENTS 0.12 0.29 0.00 0.01 0.02 0.09 0.33
INVESTMENT TURNOVER 11.93 37.94 0.63 1.25 2.86 7.64 21.50
TAX LIABILITIES 0.13 0.14 0.01 0.03 0.07 0.18 0.33
SOCIAL SEC. LIABILITIES 0.03 0.06 0.00 0.00 0.00 0.03 0.12
DEBT COVERAGE 0.07 0.20 -0.12 -0.02 0.06 0.13 0.23
INTEREST COVERAGE 25.41 447 -5.78 -0.58 1.91 5.04 14.39
LEVERAGE 0.92 0.28 0.62 0.76 0.88 1.00 1.25
SALES GROWTH -0.13 0.35 -0.57 -0.33 -0.12 0.05 0.26
CASHFLOW RATIO 0.00 0.14 -0.16 -0.05 0.02 0.06 0.13
SD. CASHFLOW 0.08 0.09 0.01 0.03 0.05 0.10 0.18
CHANGE-EMPLOYEES -0.05 0.21 -0.29 -0.17 -0.06 0.00 0.20
BANKING RELATIONSHIPS 0.58 0.25 0.28 0.38 0.52 0.80 1.00
CHANGE BANK RELATIONSHIP 0.02 0.99 -1.00 0.00 0.00 0.00 1.00
CREDIT LINE 0.60 0.49 0.00 0.00 1.00 1.00 1.00
SIZE 13.60 1.37 12.05 12.68 13.42 14.37 15.43
AGE 2.45 0.78 1.39 1.95 2.48 3.00 3.43
by ebitda. In turn, a negative relationship is observed between firm size and lever-age, tax liabilities, cashflow volatility (even though small), as well as weighted bank relationships. Debt coverage and sales growth show a positive relationship with firm size.
Table 1.3: General statistics description by firm dimension
Micro Small Medium Large
Mean Median Mean Median Mean Median Mean Median
WORKING CAPITAL 0.16 0.17 0.21 0.20 0.22 0.20 0.20 0.18
TURNOVER 1.42 1.16 1.41 1.18 1.39 1.17 1.38 1.19
ACCOUNTS PAYABLE 0.30 0.21 0.30 0.24 0.27 0.23 0.23 0.20
ACCOUNTS RECEIVABLE 0.21 0.15 0.25 0.21 0.24 0.22 0.21 0.19
INVENTORIES 0.42 0.16 0.32 0.13 0.25 0.14 0.21 0.12
CASH & EQUIVALENTS 0.30 0.09 0.26 0.08 0.21 0.05 0.23 0.04
INVESTMENT TURNOVER 18.51 5.68 14.49 5.27 13.48 4.64 18.22 5.03
TAX LIABILITIES 0.06 0.03 0.05 0.03 0.04 0.02 0.03 0.02
LEVERAGE 0.77 0.78 0.72 0.74 0.69 0.71 0.67 0.69
DEBT COVERAGE 0.19 0.12 0.21 0.13 0.23 0.14 0.28 0.16
INTEREST COVERAGE 106.4 5.7 94.9 5.6 122.9 5.2 223.3 6.2
SALES GROWTH -0.01 -0.01 0.01 0.00 0.02 0.01 0.03 0.02
CASHFLOW RATIO 0.06 0.06 0.07 0.06 0.07 0.06 0.08 0.07
SD CASHFLOW 0.07 0.04 0.06 0.04 0.05 0.03 0.04 0.03
CHANGE-EMPLOYEES 0.00 0.00 0.05 0.00 0.04 0.00 0.04 0.01
BANKING RELATIONSHIPS 0.78 0.89 0.67 0.63 0.52 0.46 0.50 0.42
1.4
Econometric analysis
1.4.1
Econometric specification
The econometric approach adopted in this study relies on a logit model for panel data. The dependent variable,di,t, is a dummy variable that takes the value one if firmi, in period t, presents a credit default event and zero otherwise. This variable is related to another latent unobserved random variable, d∗
i,t, which can be defined as:
d∗i,t =α+x
′
i,tβ+z
′
tδ+εit
where the error term, εi,t, conditional on xi,t, and zt, follows a logistic distribution.
xi,tis the set of time-varying specific characteristics of firmi, whileztis time specific variables.
If we have di,t = 1 ifd∗i,t >0 and zero otherwise, we obtain:
Prob (di,t = 1|xi,t;zt) = Prob d∗i,t >0|xi,t;zt
= Prob εit >−(α+x′i,tβ+z
′
tδ)
= 1−F −(α+x′
i,tβ+z
′
tδ)
=F α+x′i,tβ+z
′
tδ
where, Prob (di,t = 1|xi,t;zt) is the probability of default of firm iin periodt, and
F(.) is the cumulative probability function of the error term, εi,t.
The variable d∗
As shown above, the probability of default is defined as a function of the firm’s characteristics (xi,t), and some factors common to all firms (zt).
The logit model uses the maximum likelihood methodology and the characteristics of firms that have survived and failed to efficiently determine the optimal weight of each explanatory variable in an index of likelihood of failure, which is then mapped into a probability between 0 and 1. The model estimated was based on unbalanced panel data, with random effects.19
1.5
Econometric Results
1.5.1
Do activity indicators and tax liabilities contain
rele-vant information?
The analysis carried out above shows a significant difference between default and non-default firms. In particular, we observe differences regarding operational man-agement. In this Section we intend to corroborate some of these findings through econometric analysis. For this purpose we focus on new episodes of default,i.e. we exclude from the data set observations that recorded default events in two consecu-tive years.20 The underlying idea of this option is to identity the main characteristics of firms that may justify transaction events,e.g. transaction from a regular position to a default event.
We begin by presenting the results for a baseline specification that includes work-19
Note that it would not be possible to adopt a firm fixed-effect specification, as some variables under analysis are constant at the firm level. Moreover, this approach would collapse the data set to firms that changed their position in the sample period, excluding from the analysis firms that did not record default events. It is important to include these firms in the analysis in order to observe their characteristics, and so the main patterns of firms that default and those that do not.
20
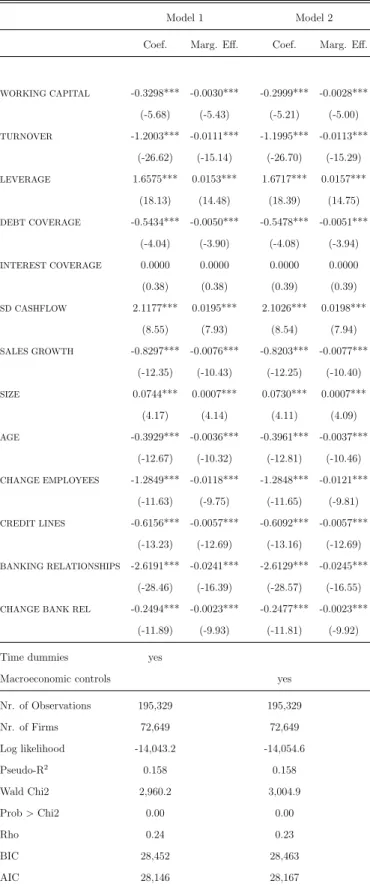
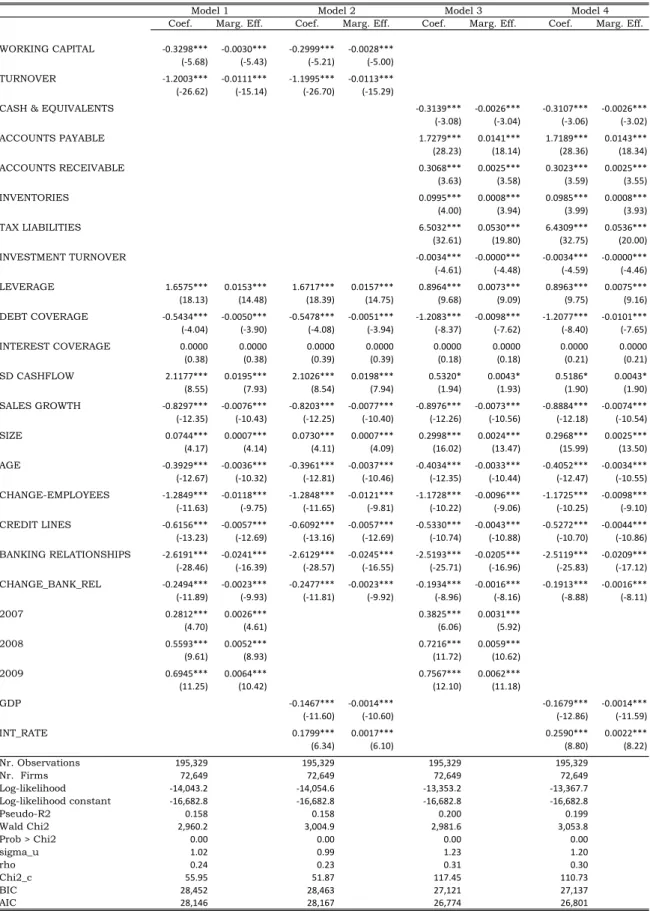
ing capital and turnover in the set of explanatory variables. The results are pre-sented in Models 1 and 2 of Table 1.4. For each model, the first column presents the estimated coefficient, while the second column shows the average marginal effects.
We observe that WORKING CAPITAL is statistically significant with a negative coefficient, meaning that firms with higher liquidity tend to present lower proba-bilities of default. TURNOVERalso presents a negative and statistically significant
coefficient. Thus, firms with higher operational efficiency have lower default proba-bilities.
Looking at the other firm characteristics included in the analysis, LEVERAGE
shows a positive coefficient, in line with the results reported in the literature (e.g.
Bonfim (2009), Bhimani et al. (2010), Bunn & Redwood (2003), and Benito et al. (2004)). This suggests that firms whose assets are highly financed by external fund-ing sources have a higher probability of default. This indicates that these firms are more vulnerable, i.e. they have lower ability to overcome a negative shock, such as lower profits (or even losses). DEBT COVERAGEshows a negative and statistically
significant relationship with default probability, while INTEREST COVERAGEis not statistically significant. These results suggest that the higher the ability of a firm to generate funds internally,ceteris paribus, the probability of default is lower.21 A negative coefficient was found for SALES GROWTH, which seeks to capture corpo-rate potential growth.22 CHANGE EMPLOYEES, which may be more deeply related
21
Lacerda & Moro (2008) found some evidence supporting a non-monotonic effect for the interest coverage variable. However, the results of the specifications with dummy variables based on the quartiles of the interest coverage’s distribution do not support this fact. We found a monotonic impact,i.e. the probability of default decreases as interest coverage ratio increases. Additionally, due to the low coefficients obtained, and the sample distribution, namely the tails’ levels, we redefined the interest coverage variable, winsorizing the observations below/above the percentile 10/90 at these figures. The magnitude of the coefficient obtained for this variable increased, as expected. However, the conclusions of the analysis continued to hold. Given these findings, in the remaining analysis in this Chapter, we preserve the initial definition of the interest coverage variable.
22
with a firm’s growth, shows a similar relationship. These results suggest that firms with higher growth opportunities have lower probability of default.23 AGE shows a negative and statistically significant coefficient, which means that younger firms have higher probability of default. Corporate size, measured by real total assets, shows a positive and statistically significant coefficient. As larger firms are typically perceived with lower risk, this result is somewhat counterintuitive.24 However, some studies also found a positive relationship between default and firm size (e.g. Bonfim (2009), Bhimani et al. (2010), and Benito et al. (2004)).
As far as bank lending relationships variables are concerned, BANKING
RELA-TIONSHIPShave a negative coefficient, which suggests that firms with a higher
con-centration of bank debt also present lower default probability. These findings are in line with empirical studies that argue that firms with higher credit quality tend to establish fewer lending relationships or, at least, preserve a main relationship, as discussed in Farinha & Santos (2002). However, regarding the dynamics of the total number of lending relationships in each year (CHANGE BANK REL), the estimated coefficient is negative. Thus, firms that increase the number of relationships tend to show lower probability of default. It should be mentioned that the two results are not contradictory. A firm may increase the number of banking relationships without major changes in the importance of its main lenders (and then without sizable effect on the concentration index). Firms with unused credit lines (CREDIT LINES) tend
to present lower default probabilities. This result suggests that firms have available funds to overcome unfavorable events (that could lead to default). However, the bank lending relationship variables may be related to a firm’s creditworthiness, in the sense that it is expected that banks provide credit (or credit lines) to firms that
impact of sales growth on default probability.
23
It should be noted that even though sales growth and employees changes may both be related to firm’s growth opportunities, the correlation between these variables is not high, as can be seen in the correlation matrix presented in the Appendices Section of this Chapter.
24
are assessed as “good credit quality” firms. This potential relationship is addressed in the robustness section of this Chapter.
The business risk, measured by the volatility of cashflow over total assets, shows a positive and statistically significant coefficient. Firms whose cash flows are more volatile, as expected, have higher probabilities of default.
Following the literature that highlights the relevance of global developments, time dummies were also included (Model 1). These variables are all statistically signifi-cant and jointly relevant, supporting the contribution of global factors in determin-ing default events. Accorddetermin-ing to these variables, the progressive deterioration in the macroeconomic and financial environment observed in the sample period had a negative impact on default probability. Therefore, common factors related to the global conditions affect the probability of default in addition to the firm’s idiosyn-cratic components. If we try to disentangle the time dummies in some economic drivers, despite the very short period under analysis, we find that the probability of default decreases with the GDP growth but increases with the average interest rate
applied on bank credit granted to non-financial corporations (Model 2).25
Finally, as mentioned above, all the specifications include business sector dum-mies, given the structural differences between economic activity sectors. For simplic-ity, the coefficients of these variables are not presented in the tables. Even though they were not all individually statistically significant, the relevance of their inclusion in the econometric regressions was confirmed by the statistical tests.26 This result is in line with the findings highlighted in Antunes & Martinho (2012), namely the
25
The hypothesis of equality of GDPgrowth and average interest rate coefficients was rejected by statistical tests.
26
heterogeneity across business sectors regarding credit quality.
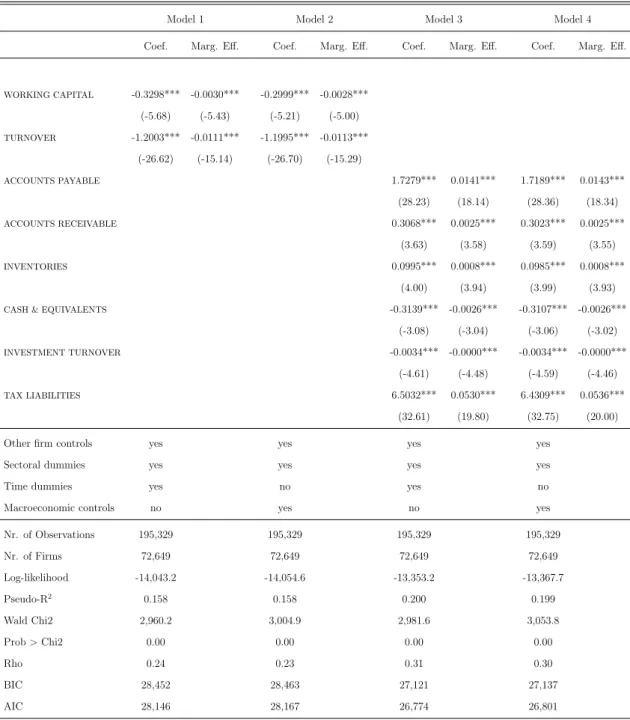
Models 3 and 4 of Table 1.5 present the results of the specifications in which working capital and turnover are replaced by the variables related with cash reserves, accounts receivable, accounts payable, inventories, investment turnover, and tax liabilities.
The activity indicators, namely accounts payable, accounts receivable, and inven-tories, have positive and statistically significant coefficients. These results suggest that firms that take longer to repay their suppliers, firms that wait longer to be paid by their customers, and firms that build up inventories for longer periods present higher probabilities of default. In turn, firms with more cash reserves present lower probability of default. The result is in line with the empirical literature on credit default (such as Benito et al. (2004), and Lacerda & Moro (2008)).27 Investment turnover also presents a negative and statistically significant coefficient. Finally, the share of tax liabilities has a positive and statistically significant coefficient. There-fore, firms with higher shares of those liabilities tend to have higher probabilities of default.
Looking at the average marginal effects, accounts payable and tax liabilities are worthy of mention, with greater impacts on the firm’s probability of default (based on a one standard-deviation increase). The results suggest that these variables are closely related to a firm’s financial fragility, and consequently firm’s creditworthiness.
The remaining variables included as regressors preserve the results discussed above. Table I.3 in the Appendices Section of this Chapter presents the estimated coefficients for all variables (in line with the structure presented in Table 1.4).
27
Table 1.4: Logit regression - Dependent variable: default
Model 1 Model 2
Coef. Marg. Eff. Coef. Marg. Eff.
WORKING CAPITAL -0.3298*** -0.0030*** -0.2999*** -0.0028***
(-5.68) (-5.43) (-5.21) (-5.00)
TURNOVER -1.2003*** -0.0111*** -1.1995*** -0.0113***
(-26.62) (-15.14) (-26.70) (-15.29)
LEVERAGE 1.6575*** 0.0153*** 1.6717*** 0.0157***
(18.13) (14.48) (18.39) (14.75)
DEBT COVERAGE -0.5434*** -0.0050*** -0.5478*** -0.0051***
(-4.04) (-3.90) (-4.08) (-3.94)
INTEREST COVERAGE 0.0000 0.0000 0.0000 0.0000
(0.38) (0.38) (0.39) (0.39)
SD CASHFLOW 2.1177*** 0.0195*** 2.1026*** 0.0198***
(8.55) (7.93) (8.54) (7.94)
SALES GROWTH -0.8297*** -0.0076*** -0.8203*** -0.0077***
(-12.35) (-10.43) (-12.25) (-10.40)
SIZE 0.0744*** 0.0007*** 0.0730*** 0.0007***
(4.17) (4.14) (4.11) (4.09)
AGE -0.3929*** -0.0036*** -0.3961*** -0.0037***
(-12.67) (-10.32) (-12.81) (-10.46)
CHANGE EMPLOYEES -1.2849*** -0.0118*** -1.2848*** -0.0121***
(-11.63) (-9.75) (-11.65) (-9.81)
CREDIT LINES -0.6156*** -0.0057*** -0.6092*** -0.0057***
(-13.23) (-12.69) (-13.16) (-12.69)
BANKING RELATIONSHIPS -2.6191*** -0.0241*** -2.6129*** -0.0245***
(-28.46) (-16.39) (-28.57) (-16.55)
CHANGE BANK REL -0.2494*** -0.0023*** -0.2477*** -0.0023***
(-11.89) (-9.93) (-11.81) (-9.92)
Time dummies yes
Macroeconomic controls yes
Nr. of Observations 195,329 195,329
Nr. of Firms 72,649 72,649
Log likelihood -14,043.2 -14,054.6
Pseudo-R2 0.158 0.158
Wald Chi2 2,960.2 3,004.9
Prob>Chi2 0.00 0.00
Rho 0.24 0.23
BIC 28,452 28,463
AIC 28,146 28,167
Note: ***, **, and * denote statistical significance levels at 1, 5, and 10 per cent, respectively. All models estimated using a random-effects logit estimator, where the dependent variable, default, is a binary variable related to credit overdue. Z-scores are presented in parentheses. The first column of each Model presents the estimated coefficients, while the second column shows the marginal effects, namely the average marginal effects, assuming as baseline firms with credit lines. In all regressions a constant and business sector dummies were included. The Pseudo-R2 is a
measure of goodness of the fit, being computed as function of the models log-likelihood and of the log-likelihood of the constant-only model, for the sub-sample used in each estimation. The Wald test evaluates the overall statistical significance of the estimated coefficients. Rho measures the proportion of the total variance resulting from the panel-level variance component. If Rho is zero, the panel-level variance is not relevant and the panel estimator is
Table 1.5: Logit regression - Dependent variable: default - Activity indicators
Model 1 Model 2 Model 3 Model 4
Coef. Marg. Eff. Coef. Marg. Eff. Coef. Marg. Eff. Coef. Marg. Eff.
WORKING CAPITAL -0.3298*** -0.0030*** -0.2999*** -0.0028***
(-5.68) (-5.43) (-5.21) (-5.00)
TURNOVER -1.2003*** -0.0111*** -1.1995*** -0.0113***
(-26.62) (-15.14) (-26.70) (-15.29)
ACCOUNTS PAYABLE 1.7279*** 0.0141*** 1.7189*** 0.0143***
(28.23) (18.14) (28.36) (18.34)
ACCOUNTS RECEIVABLE 0.3068*** 0.0025*** 0.3023*** 0.0025***
(3.63) (3.58) (3.59) (3.55)
INVENTORIES 0.0995*** 0.0008*** 0.0985*** 0.0008***
(4.00) (3.94) (3.99) (3.93)
CASH & EQUIVALENTS -0.3139*** -0.0026*** -0.3107*** -0.0026***
(-3.08) (-3.04) (-3.06) (-3.02)
INVESTMENT TURNOVER -0.0034*** -0.0000*** -0.0034*** -0.0000***
(-4.61) (-4.48) (-4.59) (-4.46)
TAX LIABILITIES 6.5032*** 0.0530*** 6.4309*** 0.0536***
(32.61) (19.80) (32.75) (20.00)
Other firm controls yes yes yes yes
Sectoral dummies yes yes yes yes
Time dummies yes no yes no
Macroeconomic controls no yes no yes
Nr. of Observations 195,329 195,329 195,329 195,329
Nr. of Firms 72,649 72,649 72,649 72,649
Log-likelihood -14,043.2 -14,054.6 -13,353.2 -13,367.7
Pseudo-R2 0.158 0.158 0.200 0.199
Wald Chi2 2,960.2 3,004.9 2,981.6 3,053.8
Prob>Chi2 0.00 0.00 0.00 0.00
Rho 0.24 0.23 0.31 0.30
BIC 28,452 28,463 27,121 27,137
AIC 28,146 28,167 26,774 26,801
Note: ***, **, and * denote statistical significance levels at 1, 5, and 10 per cent, respectively. All models estimated using a random-effects logit estimator, where the dependent variable, default, is a binary variable related to credit overdue. Z-scores are presented in parentheses. The first column of each Model presents the estimated coefficients, while the second column shows the marginal effects, namely the average marginal effects, assuming as baseline firms with credit lines. In all regressions a constant and business sector dummies were included. The Pseudo-R2 is a
1.5.2
Heterogeneity by firm size
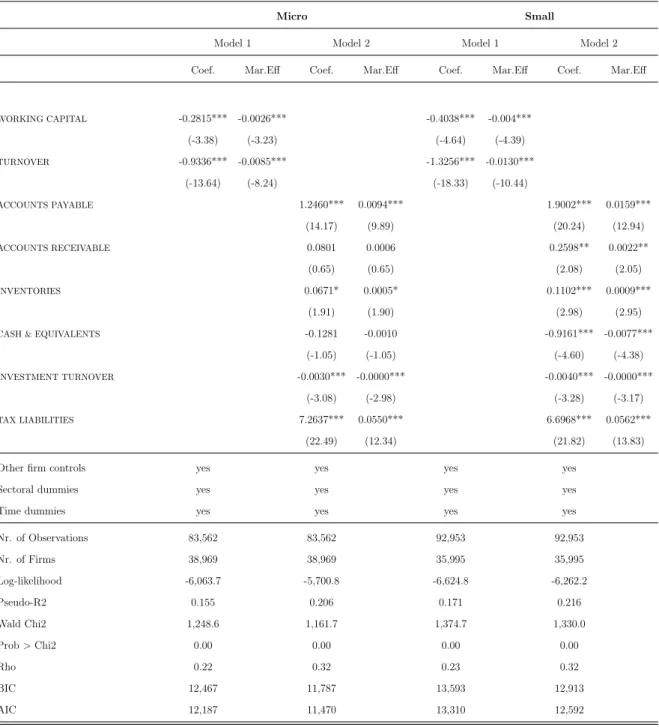
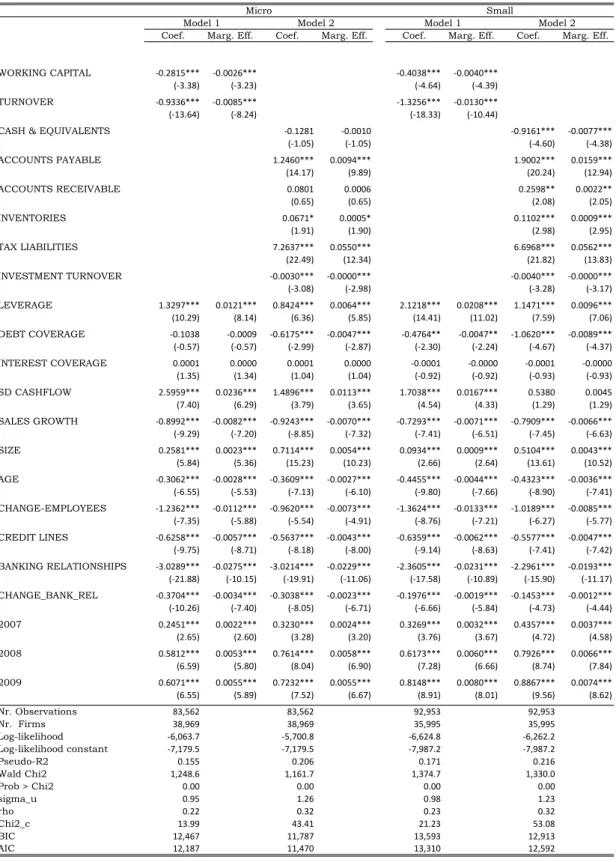
Firm size has usually been associated with activity diversification, which may affect the firm’s ability to react to idiosyncratic and external shocks. Moreover, it is also related to the available information, and is therefore a proxy for firm’s information opaqueness to general economic agents. The uniqueness of the data set used in this study allows a deeper analysis of corporate segments. Against this background we ran the previous specifications partitioning the sample by firm dimension.28 Table 1.6 presents the main results under this set up (the estimates for all variables are presented in Table I.4 in the Appendices Section).
In general, the results described for the full sample apply for micro and small firms, as illustrated in Panel A, even though with some exceptions. Looking at the specification that includes the decomposition of working capital and turnover (Model 2 for each size cohorts), the activity indicators and tax liabilities are relevant variables in determining the probability of a default event. However, for micro firms accounts receivable and cash reserves are not statistically significant. Comparing the two models, the specifications with the breakdown improve the performance of the baseline specifications.
For firms classified in the medium and large classes, presented in Panel B, some variables lost statistical significance, notably in the case of larger firms. For medium firms, and as far as decomposition of working capital and turnover is concerned, accounts payable and tax liabilities are statistically significant, with positive coef-ficients. However, unlike the results in the other regressions, accounts receivable shows a negative and statistically significant coefficient. For large firms, fewer vari-ables are statistically significant. Given the specificities of these firms, the results
28
suggest that accounting data are less informative among large firms. This fact may be underlying the weak statistics properties recorded in these specifications.
Table 1.6: Logit regression by firm dimension - Dependent variable: default
(Continues)
Panel A - Micro and small firms
Micro Small
Model 1 Model 2 Model 1 Model 2
Coef. Mar.Eff Coef. Mar.Eff Coef. Mar.Eff Coef. Mar.Eff
WORKING CAPITAL -0.2815*** -0.0026*** -0.4038*** -0.004***
(-3.38) (-3.23) (-4.64) (-4.39)
TURNOVER -0.9336*** -0.0085*** -1.3256*** -0.0130***
(-13.64) (-8.24) (-18.33) (-10.44)
ACCOUNTS PAYABLE 1.2460*** 0.0094*** 1.9002*** 0.0159***
(14.17) (9.89) (20.24) (12.94)
ACCOUNTS RECEIVABLE 0.0801 0.0006 0.2598** 0.0022**
(0.65) (0.65) (2.08) (2.05)
INVENTORIES 0.0671* 0.0005* 0.1102*** 0.0009***
(1.91) (1.90) (2.98) (2.95)
CASH & EQUIVALENTS -0.1281 -0.0010 -0.9161*** -0.0077***
(-1.05) (-1.05) (-4.60) (-4.38)
INVESTMENT TURNOVER -0.0030*** -0.0000*** -0.0040*** -0.0000***
(-3.08) (-2.98) (-3.28) (-3.17)
TAX LIABILITIES 7.2637*** 0.0550*** 6.6968*** 0.0562***
(22.49) (12.34) (21.82) (13.83)
Other firm controls yes yes yes yes
Sectoral dummies yes yes yes yes
Time dummies yes yes yes yes
Nr. of Observations 83,562 83,562 92,953 92,953
Nr. of Firms 38,969 38,969 35,995 35,995
Log-likelihood -6,063.7 -5,700.8 -6,624.8 -6,262.2
Pseudo-R2 0.155 0.206 0.171 0.216
Wald Chi2 1,248.6 1,161.7 1,374.7 1,330.0
Prob>Chi2 0.00 0.00 0.00 0.00
Rho 0.22 0.32 0.23 0.32
BIC 12,467 11,787 13,593 12,913
(Table 1.6 Continued)
Panel B - Medium and large firms
Medium Large
Model 1 Model 2 Model 1 Model 2
Coef. Mar.Eff Coef. Mar.Eff Coef. Mar.Eff Coef. Mar.Eff
WORKING CAPITAL -1.1330*** -0.0116*** 0.7042 0.0072
(-4.41) (-3.92) (1.07) (0.97)
TURNOVER -1.9127*** -0.0196*** -1.0691** -0.0109*
(-8.78) (-5.66) (-2.53) (-1.87)
ACCOUNTS PAYABLE 3.2408*** 0.0307*** 2.3131*** 0.0219***
(10.06) (7.07) (2.69) (2.67)
ACCOUNTS RECEIVABLE -0.7111* -0.0067* 2.4170** 0.0229
(-1.82) (-1.76) (2.17) (1.60)
INVENTORIES -0.1671 -0.0016 0.2420 0.0023
(-0.99) (-0.99) (0.48) (0.48)
CASH & EQUIVALENTS -0.7762 -0.0073 0.5171 0.0049
(-0.99) (-0.98) (1.51) (1.25)
INVESTMENT TURNOVER -0.0034 -0.0000 -0.0032 -0.0000
(-0.88) (-0.86) (-0.54) (-0.53)
TAX LIABILITIES 6.5764*** 0.0622*** 1.7118 0.0162
(8.16) (6.23) (0.35) (0.35)
Other firm controls yes yes yes yes
Sectoral dummies yes yes yes yes
Time dummies yes yes yes yes
Nr. of Observations 16,204 16,204 2,610 2,610
Nr. of Firms 5,951 5,951 906 906
Log-likelihood -986.0 -946.4 -139.6 -132.5
Pseudo-R2 0.258 0.288 0.289 0.325
Wald Chi2 287.1 270.3 67.4 67.3
Prob>Chi2 0.00 0.00 0.00 0.00
Rho 0.21 0.25 0.05 0.10
BIC 2,263 2,222 515 533
AIC 2,032 1,961 339 333
Note: ***, **, and * denote statistical significance levels at 1, 5, and 10 per cent, respectively. All models estimated using a random-effects logit estimator, where the dependent variable, default, is a binary variable related to credit overdue. Z-scores are presented in parentheses. The first column of each Model presents the estimated coefficients, while the second column shows the marginal effects, namely the average marginal effects, assuming as baseline firms with credit lines. In all regressions a constant and business sector dummies were included. The Pseudo-R2 is a
1.5.3
Determinants
versus
predictors of default
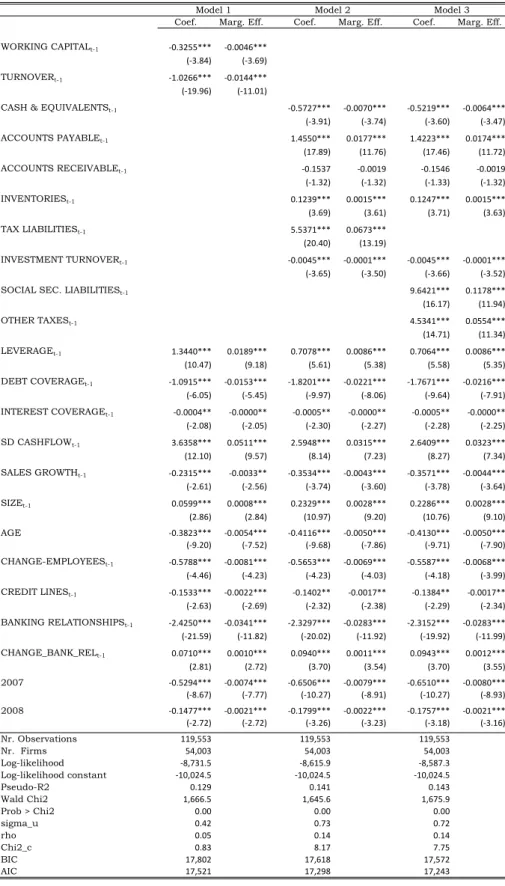
The previous results highlight the relevance of activity indicators, investment turnover, cash reserves, and tax liabilities in estimating a firm’s probability of default. In this sub-section we re-estimate the specifications presented above, but now including as regressors the firm-specific variables with a lag instead of the contemporaneous ones (with exception of age).
This approach allows us to check if these variables play a role as predictors of default events. In other words, in this specification we investigate if a default event can be influenced by the characteristics of firms at the end of the previous year,
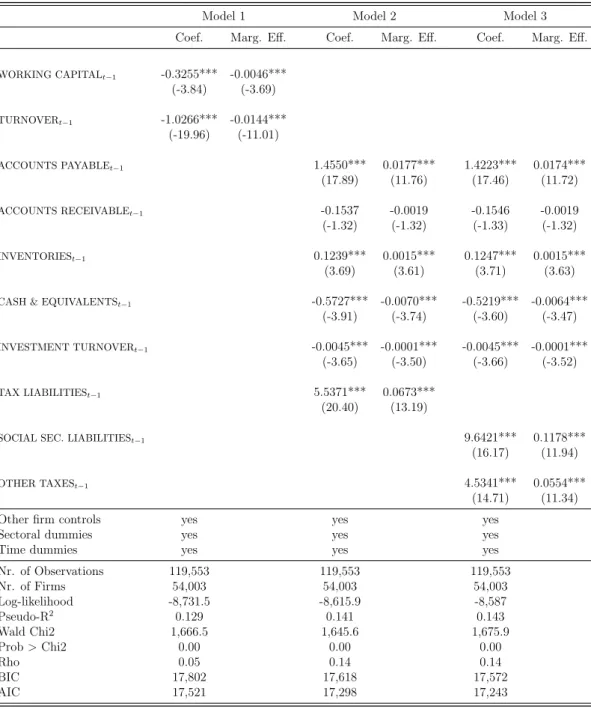
t−1. This specification may also be useful, as accounting data are obtained with a significant delay. Even though a close banking relationship may minimize the lack of updated information about the firm’s performance, some data are not disclosed in a timely way (there is a considerable delay in obtaining accounting data). Moreover, this approach allows us to minimize potential contemporaneous issues in the previ-ous specifications related with a firm’s creditworthiness and the respective financial position at the end of each year. The main results of this approach are presented in Table 1.7.
probability of default. In turn, the share of tax liabilities retains a positive and statistically significant coefficient. Thus, firms with higher shares of tax liabilities have a higher probability of default in the following year.
Looking at the impacts of each variable on a firm’s probability of default (based on an increase of one standard-deviation), cash reserves and investment turnover reinforced their relevance, in comparison to the previous specifications. This analysis also confirms the importance of accounts payable and the share of tax liabilities on a firm’s probability of default. Thus, these variables seem to be relevant indicators of a firm’s financial vulnerabilities, and its credit risk.
For the remaining explanatory variables, there are also some differences. In these specifications changes in the number of banking relationships shows a positive and statistically significant coefficient. This result suggests that firms that changed the number of lending relationships have higher probabilities of default in the following year. It thus seems that firms look for other lenders when they face some financial challenges. For simplicity, the estimates for these variables are presented in Table I.5, in the Appendices Section.
Tax liabilities
In the previous specifications, tax liabilities over total assets showed to be a relevant indicator in the analysis. Against this background we explore more deeply the role of this component.
We decompose tax liabilities in tax related with Social Security (at overdue) and the remaining taxes (TLSS, and TLOTHER, respectively), having in mind that the failure of commitments in Social Security taxes may be related to financial difficulties for a firm (in particular if employees’ contributions are involved). Model 3 in Table 1.7 presents the results under this conjecture.29
In this specification the new variables are statistically significant and both show positive coefficients, especially the variable related with Social Security taxes. For the remanning explanatory variables the results described above continue to hold. Thus, firms with higher levels of Social Security taxes over total assets have higher probabilities of default in the following year.
29
Table 1.7: Logit regression - Dependent variable: default - with lag regressors
Model 1 Model 2 Model 3
Coef. Marg. Eff. Coef. Marg. Eff. Coef. Marg. Eff.
WORKING CAPITALt−1 -0.3255*** -0.0046*** (-3.84) (-3.69)
TURNOVERt−1 -1.0266*** -0.0144***
(-19.96) (-11.01)
ACCOUNTS PAYABLEt−1 1.4550*** 0.0177*** 1.4223*** 0.0174***
(17.89) (11.76) (17.46) (11.72)
ACCOUNTS RECEIVABLEt−1 -0.1537 -0.0019 -0.1546 -0.0019
(-1.32) (-1.32) (-1.33) (-1.32)
INVENTORIESt−1 0.1239*** 0.0015*** 0.1247*** 0.0015***
(3.69) (3.61) (3.71) (3.63)
CASH & EQUIVALENTSt−1 -0.5727*** -0.0070*** -0.5219*** -0.0064***
(-3.91) (-3.74) (-3.60) (-3.47)
INVESTMENT TURNOVERt−1 -0.0045*** -0.0001*** -0.0045*** -0.0001***
(-3.65) (-3.50) (-3.66) (-3.52)
TAX LIABILITIESt−1 5.5371*** 0.0673***
(20.40) (13.19)
SOCIAL SEC. LIABILITIESt−1 9.6421*** 0.1178***
(16.17) (11.94)
OTHER TAXESt−1 4.5341*** 0.0554***
(14.71) (11.34)
Other firm controls yes yes yes
Sectoral dummies yes yes yes
Time dummies yes yes yes
Nr. of Observations 119,553 119,553 119,553
Nr. of Firms 54,003 54,003 54,003
Log-likelihood -8,731.5 -8,615.9 -8,587
Pseudo-R2 0.129 0.141 0.143
Wald Chi2 1,666.5 1,645.6 1,675.9
Prob>Chi2 0.00 0.00 0.00
Rho 0.05 0.14 0.14
BIC 17,802 17,618 17,572
AIC 17,521 17,298 17,243
Note: ***, **, and * denote statistical significance levels at 1, 5, and 10 per cent, respectively. All models estimated using a random-effects logit estimator, where the dependent variable, default, is a binary variable related to credit overdue. Z-scores are presented in parentheses. The first column of each Model presents the estimated coefficients, while the second column shows the marginal effects, namely the average marginal effects, assuming as baseline firms with credit lines. In all regressions a constant and business sector dummies were included. The Pseudo-R2 is a