Genetic divergence in
Tetragonisca angustula
Latreille, 1811 (Hymenoptera,
Meliponinae, Trigonini) based on rapd markers
Rosana de Cássia Oliveira1, Francis de Morais Franco Nunes1, Ana Paula Soraggi Campos1, Soraya Matos de Vasconcelos2, David Roubik3, Luiz Ricardo Goulart2and Warwick Estevam Kerr2
1
Universidade de São Paulo, Departamento de Genética, Ribeirão Preto, São Paulo, Brazil.
2
Universidade Federal de Uberlândia, Instituto de Genética e Bioquímica, Uberlândia, Minas Gerais, Brazil.
3
Smithsonian Tropical Research Institute, Balboa, República do Panamá.
Abstract
One of the commonest neotropical stingless bees isTetragonisca angustula (Latreille, 1811), popularly known in Portuguese asjataí, which occurs in variable nesting sites from Mexico to Argentina. We used 18 primers to generate 218 RAPD markers which we used to determined the genetic distance betweenT. angustula populations from 25 localities in three different Latin America countries, usingTetragonisca weyrauchi from the Brazilian state of Acre and the common honey bee (Apis mellifera) as outgroups. Genetic distance, calculated as the Percentage of Dissimilarity (14%), based on all markers divided theT. angustula population into eastern (group 1) and western (group 2) groups. However, we were able to separate the two groups by using only two primers that have generated five specific molecular markers. The eastern group consists ofT. angustula angustula which occurs from Panama to the Brazilian states of Maranhão and northern Minas Gerais and has spread through the Brazilian Atlantic Forest as far as the southern Brazilian state of Santa Catarina. Group 2 is made up ofT. angustula fiebrigi which has a more southerly and western distribution, occurring only in the western Brazilian states of Mato Grosso and Mato Grosso do Sul as well as the west of some other Brazilian states (Goiás, Minas Gerais, São Paulo, Paraná and Santa Catarina) and northeastern Argentina.
Key words: Tetragonisca angustula, genetic divergence, molecular markers, UPGMA.
Received: July 17, 2003; Accepted: December 16, 2003.
Introduction
One of the most common neotropical stingless bees is Tetragonisca angustula (Latreille, 1811) (Hymenoptera, Meliponinae), popularly known in Portuguese as jataí, which are generalist foragers and more efficient native pollinators of the American flora. AlthoughT. angustulais widely distributed in the Americas from the south of Mex-ico to Argentina, it has not been observed in Andean cordil-lera, the scrubland (caatinga in Portuguese) of northeastern Brazilian and some regions of the Amazon.
There are two subspecies ofT. angustulawhich can be separated morphologically,T. angustula angustula (La-treille) with a black mesepisternun andT. angustula fiebrigi (Schwarz) with a yellow mesepisternun (Castanheira, 1995). According to Nogueira-Neto (1970),T. a. angustula
is distributed as described above (i.e. from Mexico to Ar-gentina with some exceptions) while T. a. fiebrigiis re-stricted to sites in southern Brazil (the Paraná river valley in São Paulo state, part of the state of Paraná and the state of Santa Catarina) and Argentina and Paraguay.
The biological, behavioral, morphological and bio-chemical aspects ofT. angustulahave been studied since the beginning of the twentieth century. Castanheira (1995) investigated 228T. angustulacolonies from five Brazilian states (Mato Grosso, Bahia, Minas Gerais, São Paulo and Paraná) for genetic differences in six enzyme systems and found variation at the hexokinase, glycerol-3-phosphate dehydrogenase and malate dehydrogenaseloci, the correla-tion between the degree of subspecies hybridizacorrela-tion in the São Paulo populations and the frequency of the hexokinase Hk88allele indicating that this allele is a marker for theT. a. fiebrigisubspecies. Diniz-Filhoet al.(1998) studied geo-graphical variation in morphology based on fifteen morphometric characters in eight local populations occur-ring in western-central and southeastern Brazil. These
au-www.sbg.org.br
Send correspondence to Rosana de Cássia Oliveira. Universidade Federal de Uberlândia, Instituto de Genética e Bioquímica, Bloco 2E 33, Campus Umuarama, 38400-902 Uberlândia, MG, Brazil. E-mail: [email protected].
thors found significant differences in all the characters analyzed, with body-size showing a north-south clinal vari-ation in which larger bees occurred mainly in the south, this being attributable to adaptation to a cooler climate (e.g. Bergmann’s rule).
The study described in this paper used polymerase chain reaction - random amplified polymorphic DNA (PCR-RAPD) markers (Williamset al.,1990; Welsh and McClelland, 1990) to investigate the relationship between
differentT. angustulapopulations, the results providing in-teresting insights into future research on this species.
Material and Methods
Bee samples and DNA extraction
We sampled worker bees from 26T. angustulaL. col-onies from 25 sites (Table 1), the colony representing Pilar do Sul was in fact situated at Ribeirão Preto where it had been maintained for three years prior to sampling. For
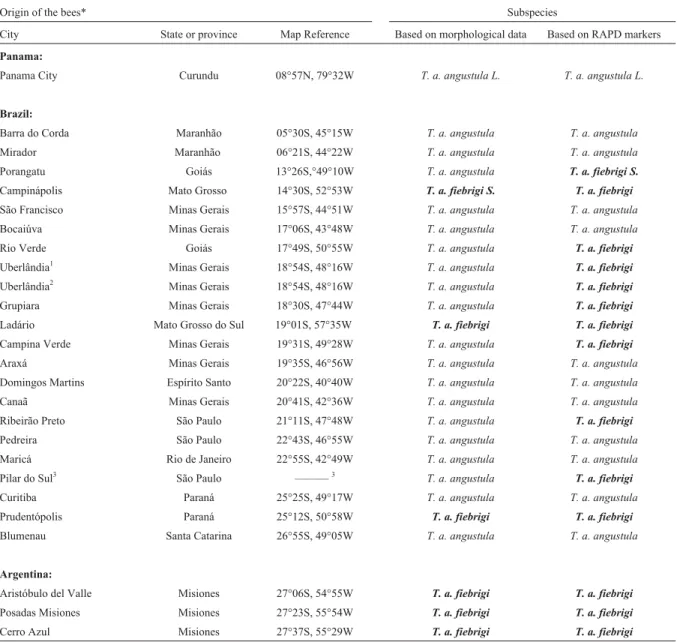
Table 1- Origin of theTetragonisca angustulaspecimens studied and their identification based on the morphological characteristics given by Nogueira Neto (1970) as compared with RAPD markers.
Origin of the bees* Subspecies
City State or province Map Reference Based on morphological data Based on RAPD markers
Panama:
Panama City Curundu 08°57N, 79°32W T. a. angustula L. T. a. angustula L.
Brazil:
Barra do Corda Maranhão 05°30S, 45°15W T. a. angustula T. a. angustula
Mirador Maranhão 06°21S, 44°22W T. a. angustula T. a. angustula
Porangatu Goiás 13°26S,°49°10W T. a. angustula T. a. fiebrigi S.
Campinápolis Mato Grosso 14°30S, 52°53W T. a. fiebrigi S. T. a. fiebrigi
São Francisco Minas Gerais 15°57S, 44°51W T. a. angustula T. a. angustula
Bocaiúva Minas Gerais 17°06S, 43°48W T. a. angustula T. a. angustula
Rio Verde Goiás 17°49S, 50°55W T. a. angustula T. a. fiebrigi
Uberlândia1 Minas Gerais 18°54S, 48°16W T. a. angustula T. a. fiebrigi
Uberlândia2 Minas Gerais 18°54S, 48°16W T. a. angustula T. a. fiebrigi
Grupiara Minas Gerais 18°30S, 47°44W T. a. angustula T. a. fiebrigi
Ladário Mato Grosso do Sul 19°01S, 57°35W T. a. fiebrigi T. a. fiebrigi
Campina Verde Minas Gerais 19°31S, 49°28W T. a. angustula T. a. fiebrigi
Araxá Minas Gerais 19°35S, 46°56W T. a. angustula T. a. angustula
Domingos Martins Espírito Santo 20°22S, 40°40W T. a. angustula T. a. angustula
Canaã Minas Gerais 20°41S, 42°36W T. a. angustula T. a. angustula
Ribeirão Preto São Paulo 21°11S, 47°48W T. a. angustula T. a. fiebrigi
Pedreira São Paulo 22°43S, 46°55W T. a. angustula T. a. angustula
Maricá Rio de Janeiro 22°55S, 42°49W T. a. angustula T. a. angustula
Pilar do Sul3 São Paulo ———3 T. a. angustula T. a. fiebrigi
Curitiba Paraná 25°25S, 49°17W T. a. angustula T. a. angustula
Prudentópolis Paraná 25°12S, 50°58W T. a. fiebrigi T. a. fiebrigi
Blumenau Santa Catarina 26°55S, 49°05W T. a. angustula T. a. angustula
Argentina:
Aristóbulo del Valle Misiones 27°06S, 54°55W T. a. fiebrigi T. a. fiebrigi
Posadas Misiones Misiones 27°23S, 55°54W T. a. fiebrigi T. a. fiebrigi
Cerro Azul Misiones 27°37S, 55°29W T. a. fiebrigi T. a. fiebrigi
*For each country the sites are ordered in terms of increasing latitude. Bold-faced type is used only to make it easier to read the table. 1,2Different samples of same colony.
outgroups we used twoTetragonisca weyrauchi(Schwarz) colonies from the Brazilian state of Acre (09°58’S, 67°48’W) and anApis melliferacolony from Uberlândia (18°54’S 48°16’W). In all cases, the samples consisted of a worker bee collected at the entrance of each colony and kept in absolute alcohol at -80 °C until DNA extraction (Postet al., 1993).
Each bee was washed three times in buffer (TrisCl 0.01 M, pH 8.0; NaCl 0.1 M and MgCl20.001 M) for
15 min (Dowton and Austin, 1994) and the DNA extracted as using a modified Shusteret al.(1992) protocol,i.e. incu-bation with proteinase K and Rnase, phenol-chloroform ex-traction and DNA precipitation using 70% ethanol.
RAPD-PCR amplification and separation and visualization of products
We used eleven decamer short primers (OPA 03, 09, 10, 13; OPF 13; OPL 04, 11, 13; OPO 06; OPV 07 and 10) from Operon Technologies, USA and seven 20 to 24 mer long primers (GOU 07, 10; MAU 101, B1, B2, 402 and 801) which we synthesized in our laboratory. Each amplifi-cation was performed in a total of 25µL of reaction mixture consisting of 10 mM Tris-HCl, 50 mM KCl, 2 mM MgCl2,
100 mM of each dNTP (dCTP, dATP, dGTP, dTTP), 10 pmoles of primer, 1U ofTaqDNA polymerase and 10 ng of bee genomic DNA. Reactions were performed in a PTC-100 thermal cycler (MJ Research) for three cycles of 94 °C for 1 min, 35 °C for 1 min and 72 °C for 2 min, fol-lowed by 34 cycles of 94 °C for 10 s, 40 °C for 20 s and 72 °C for 2 min with a final cycle of 72 °C for 5 min. A neg-ative control reaction was prepared for each primer used in all PCR amplifications to identify contamination of reac-tions with non-target template DNA. All amplification re-actions were repeated twice in order to test reproducibility.
Amplified products were separated by electrophore-sis in 1% (w/v) agarose gel for 1.5 h at 0.5 V cm-2using 0.5X TBE (tris- EDTA borate) buffer, stained with ethidium bromide and photographed using a VDS Image Master (Pharmacia Biosciences). A DNA molecular weight marker (Gibco-BR) was also included.
Amplicon analyses
Only those fragments that were consistently repro-duced were used. A binary matrix was prorepro-duced in accor-dance with the presence (1) or absence (0) of bands, the fraction of bands matching in two bees (M) being calcu-lated using the formula M = NAB/NTwhere NABequals the
total number of matches (i.e.both bands absent or both bands present) in individuals A and B and NTis the total
number of fragments scored. Genetic distance (GD) was calculated as GD = 1 - M and cluster analyses performed on the GD values using an unweighted pair-group method with averages (UPGMA) algorithm, the resultant dendro-grams being generated using the version 4.5 of the Statistica program (Puterkaet al.,1993).
Results and Discussion
Cluster analysis ofT. angustula genetic distance values
The RAPD method has been reported to be an effi-cient tool to differentiate geographically and genetically isolated populations, and has been used to verify the exis-tence of populations of species that have arisen either through genetic selection under different environmental conditions or as a result of genetic drift (Fuchset al., 1998).
Samples ofT. angustulaanalyzed using RAPD pro-files generated by 18 primers resulted in 218 intense and re-producible polymorphic fragments. The cluster analysis dendrogram (Figure 1) divided theT. angustulapopulation into two groups with 14% of genetic dissimilarity. One group clustered 12 populations (Panama, Mirador, Barra do Corda, Domingos Martins, Araxá, Bocaiúva, Canaã, São Francisco, Curitiba, Blumenau, Maricá and Pedreira), while the other group (Porangatu, Rio Verde, Grupiara, Campina Verde, Uberlândia 1 and 2, Campinápolis, Ladá-rio, Ribeirão Preto, Pillar do Sul, Prudentópolis, Posadas, Aristóbulo del Valle and Cerro Azul) consists of 13 popula-tions from the western side of South America. The genetic distance between groups 1 and 2 suggests that this species is undergoing genetic differentiation, a process which can be driven by ecological, evolutionary or historical factors. Genetic differentiation ofT. angustulabetween the differ-ent groups of sampling sites is to be expected because the sites extend over a wide geographical area and are subject to different environmental factors, such factors including the temperature gradient from the equator to Argentina, vegetation patterns which vary from rain forest to cerrado (savanna-like vegetation) and the pampas of southern Bra-zil and Argentina, differences in rainfall and other, un-known, environmental factors and processes.
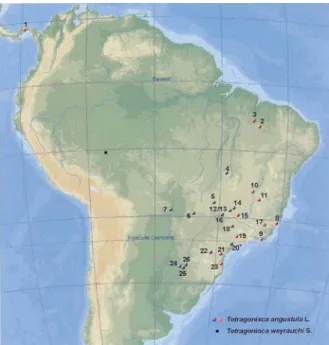
Group 1 (T. a. angustula) occurs in the east of the col-lection area, from Panama to southern Brazil, while Group 2 (T. a. fiebrigi) was distributed in the Brazilian states of Mato Grosso and Mato Grosso do Sul, the western parts of the Brazilian states of Goiás, Minas Gerais, São Paulo and Paraná, and northeastern Argentina (Figure 2). Our RAPD marker study shows that 56% of the 25 geographical sites were colonized byT. a. fiebrigi, showing that this subspe-cies is more widely distributed than is apparent when this subspecies is identified by mesepisternun color which iden-tifiedT. a. fiebrigiin only 24% of the sites (Table 1). Previ-ously (Nogueira-Neto, 1970), morphological data suggested that T. a. fiebrigi occurred only in southern Brazil in parts of São Paulo, Paraná and the River Paraná valley and the state of Santa Catarina, and in Paraguay and Argentina.
The occurrence ofT. a. fiebrigicould be the result of intraspecific hybridization. In our RAPD maker study there was only one possible intraspecific hybridization event, which can be seen in Figure 2 where the Pilar do Sul geno-type (allocated to group 2 (T. a. fiebrigi) by our RAPD anal-ysis) appears to be introgressing into group 1 (T. a. angustula). As explained in the materials and methods, the Pilar do Sul colony (morphologicallyT. a. angustula) was actually in Ribeirão Preto where it had been maintained for three years prior to sampling while the other colony sam-pled (also morphologically T. a. angustula) had always been in Ribeirão Preto, and it may have been that intraspecific hybridization occurred between these two col-onies to produceT. a. fiebrigi. Intraspecific hybridization would be expected to result in co-dominant bands but this did not occur in this case, probably because RAPD markers usually yield dominant bands. Another way of demonstrat-ing intraspecific hybridization would be by monitordemonstrat-ing the introgression of RAPD markers in haplodiploid crossings, which also was not the case. However, Castanheira (1995) has demonstrated that rare alleles have been constantly in-troduced into the Ribeirão PretoT. a. angustulapopulation due to importation of colonies of bees from other sites by beekeepers and researchers, isozyme markers of T. a. fiebrigihaving been found in natural populations of Ribei-rão Preto bees.
The zone of allopatry between these subspecies in the interior of South America has never been clearly estab-lished. The work related to the presence of subspecies ofT. angustuladates from the beginning of the 20th century and
Figure 2- Geographic distribution of the twoT. angustulaclusters: Group 1 (red) includes: 1- Panama, 2- Mirador, 3- Barra do Corda, 8- Domingos Martins, 9- Maricá, 10- São Francisco, 11- Bocaiúva, 15- Araxá, 17-Canaã, 19- Pedreira, 21- Curitiba and 23- Blumenau. Group 2 (black): 4-Porangatu, 5- Rio Verde, 6- Campinápolis, 7- Ladário, 12 and 13- Uber-lândia, 14- Grupiara, 16- Campina Verde, 18- Ribeirão Preto, 20- Pilar do Sul, 22- Prudentópolis, 24- Posadas, 25- Aristóbulo del Valle, and 26-Cerro Azul. The asterisk indicates the sample collected from a three-year-old colony from Pilar do Sul which had been maintained for three years prior to sampling in Ribeirão Preto.
has incorporated only one morphologic character for dis-crimination, the coloration of the mesepisternun. This seems unreliable because morphologic characters can be under quantitative, epistatic or pleiotropic genetic control, which can mask the geographic distribution of populations. The use of more discriminatory and complementary tools such as RAPD analysis and methods for the detection of en-zymatic systems that reveal heterozygotes could be used to detect population polymorphisms and a systematic revision of the genus could clarify the results of more preliminary work. Our sampling procedure was too limited to establish range limits.
By removing specific markers belonging to the outgroups we produced two other dendrograms (not shown), one with allA. melliferamarkers removed and the other with allA. melliferaand T. weyrauchi markers re-moved. However, neither of the dendrograms showed any alterations in theT. angustulagenotype clusters for either of the groups, although the genetic distance between groups 1 and 2 slightly increased to 16.7% when theA. mellifera markers were removed and 24.5% when both the A. melliferaandT. weyrauchimarkers were removed. It may be that the 24.5% genetic distance betweenT. angustula group 1 (T. a. angustula) and group 2 (T. a. fiebrigi) may be
a more reliable distance estimate because the presence of data for other species (the outgroups) may influence the di-vergence analysis by minimizing distance within the same species.
Population markers
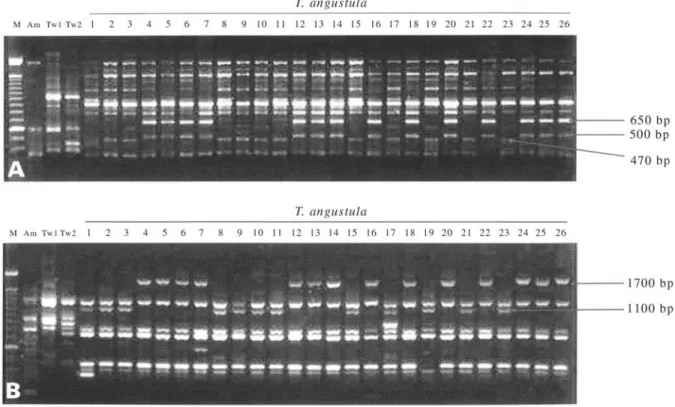
In our search for genetic markers we found two prim-ers, MAU-B2 (GCCAGGCAGCA AGTTCTCAGTAAT) and OPL11 (ACGATGAGCC), each of which could differ-entiate between the two geographically well-characterized T. angustulaclusters. The MAU-B2 primer (Figure 3-A) presents three informative polymorphic bands of approxi-mately 470, 500 and 650 bp, with the 470 bp band identify-ing group 1 (T. a. angustula) and the 500 and 650 bp bands segregating together in group 2 (T. a. fiebrigi, found only in the southwest of the area studied). The OPL11 primer (Figure 3-B) was also able to distinguish the two T. angustulaclusters based on two bands, a 1100 bp band oc-curring only in group 1 genotypes and a band of about 1700 bp present only in group 2 genotypes.
It was thus possible to distinguish between the twoT. angustulagroups using only two primers, a significant fact because RAPD markers are easy to obtain and make possi-ble genetic evolutionary studies simpler to conduct. Suazo
et al. (1998) have also detected specific RAPD markers which are able to distinguish betweenA. mellifera races from Africa and Europe, while Waldschmidtet al.(2000) used the same technique to identify a DNA marker present inMelipona quadrifasciata quadrifasciatabut absent inM. q. anthidioides.
The findings reported in this paper have important implications for future research onT. angustula.The char-acterization and monitoring of natural species, using other molecular markers such as microsatellites, single-strand conformation polymorphism (SSCP-PCR) and sequencing of conserved genes will be of great value in establishing a clear picture of the distribution and dynamics of T. angustulain neotropical regions.
Acknowledgments
We thank Dr. João M. Franco de Camargo (USP-Ribeirão Preto, Brazil) for the identification of ours bees; Dr. Vera Lúcia Imperatriz-Fonseca, Dr. Robin F. A. Moritz and Dr. Maria Cristina Ramos Costa for valuable sugges-tions; and the beekeepers who supplied the samples used in this study. This work was supported by the Brazilian agen-cies CNPQ (RHAE), CAPES and FAPEMIG.
References
Castanheira EB (1995) Marcadores genéticos e sua utilização em estudos populacionais emTetragonisca angustulaePlebeia droryana (Hymenoptera, Apidae, Meliponinae). Tese de Doutorado, Faculdade de Medicina de Ribeirão Preto, Uni-versidade de São Paulo, 86 pp.
Diniz-Filho JAF, Balestra R, Rodrigues FM and Araújo ED de (1998) Geographic variation of Tetragonisca angustula angustulaLatreille (Hymenoptera, Meliponinae) in Central and Southeastern Brazil. Naturalia 23:193-208.
Dowton M and Austin AD (1994) Molecular phylogeny of the in-sect order Hymenoptera: Apocritan relationships. Proc Natl Acad Sci USA (91):9911-9915.
Fuchs H, Gross R, Stein H and Rottmann O (1998) Application of molecular genetic markers for the differentiation of bream (Abramis bramaL.) populations from the rivers Main and Danube. J Appl Ichthyol 14:49-55.
Nogueira-Neto PN (1970) A criação de abelhas indígenas sem ferrão (Meliponinae). 2ªa. ed. Ed. Chácaras e Quintais, São Paulo, pp 74-76.
Post RJ, Flook PK and Millest AL (1993) Methods for the preser-vation of insects for DNA studies. Bioch System and Ecol-ogy 21(1):85-92.
Puterka GJ, Black IVWC, Steiner WM and Burton RL (1993) Ge-netic variation and phylogeGe-netic relationships among world-wide collections of the Russian wheat aphid, Diuraphis noxia (Mordwilko), inferred from allozyme and RAPD-PCR markers. Heredity 70:604-618.
Shuster DE, Kehrli ME, Ackermann MR and Gilbert RO (1992) Identification and prevalence of a genetic defect that causes leukocyte adhesion deficiency in Hostein cattle. Proc Natl Acad Sci USA 89:9225-9229.
Suazo A, MacTiernan R and Hall HG (1998) Differences between African and European honey bees (Apis melliferal.) in ran-dom amplified polymorphic DNA (RAPD). J Hered 89:32-36.
Waldschmidt AM, Barros EG and Campos LAO (2000) A molec-ular marker distinguishes the subspecies Melipona quadrifasciata quadrifasciataandMelipona quadrifasciata anthidioides(Hymenoptera: Apidae, Meliponinae). Gen and Mol Biol 23(3):609-611.
Welsh J and McClelland M (1990) Fingerprinting genomes using PCR with arbitrary primers. Nucl Acid Res 18:7213-7218. Williams JGK, Kubelik AR, Livak KJ, Rafalski JA and Tingey
SV (1990) DNA polymorphisms amplified by arbitrary pri-mers are useful as genetic markers. Nucl Acid Res 18:6531-6535.