THE ROLE OF NUTRITIONAL DEFICIENCY IN MORTALITY
FINDINGS OF THE INTER-AMERICAN INVESTIGATION OF MORTALITY IN CHILDHOOD’
Ruth Rice Puffer, Dr. P.H.,2 and Carlos V. Serrano, M.D., Ph.D.3
The Inter-American Investigation of Mortality in Childhood,
carried out by the Pan American Health Organization in col-
laboration with the various countries in the years 1968-1972,
has for the first time provided an epidemiologic description of
mortality due to nutritional deficiency, by age and by type of
deficiency, for several areas in Latin America. Material from
Chapter IX of the volume Patterns of Urban Mortality in
Childhood-Report of the Inter-American Investigation of Mortality in Childhood (1) is presented here so as to make this
information widely available as a basis for action to improve
the health of children and thus of families, communities, and
countries of the Americas.
Introduction
The overall objective of the Inter-American Investigation of Mortality in Childhood was to carry out in selected communities of the Ameri- cas research projects designed to establish death rates for infancy and early childhood that would be as accurate and complete as possible, taking into account biological as well as nutri- tional, sociological, and environmental factors. The field work of the Investigation was directed by the principal collaborators in 15 projects widely distributed over the Hemisphere, as shown on the map appearing as frontispiece to this issue. Six of the projects (indicated on the map by circles) were carried out only in cities while the other nine (shown by squares) were conducted in suburban or rural areas as well as a central city. Deaths over a period of 24 con-
IThis research project was made possible by a contract with the Agency for International Develop
ment of the United States of America and the Pan
American Health Organization.
The report on the findings was prepared with the assistance of those listed in the Appendix to this arti- cle.
2Principal Investigator, Inter-American Investiga-
tion of Mortality in Childhood.
3Medical Officer, Pan American Health Organiza- tion.
secutive months4 were investigated in accor- dance with standard procedures developed during the Investigation’s planning phase in 1966-1968. The initial phases of the work as well as the specific projects were described in an earlier paper (2).
Although the basic sources of information were the registered deaths in the two-year period, non-registered deaths were included as well. Many neonatal deaths were discovered through searches of delivery records and obstet- rics records in hospitals.
In each of the projects, the principal collabo- rator was in charge of a team of physicians, nurses, and social workers who carried out the field work, making visits to the homes of de- ceased children and to hospitals, clinics, and physicians’ offices in order to complete a de- tailed questionnaire with information regarding the parents, mother’s reproductive history, prenatal care, extent of breast feeding, medical attention received, complete clinical record of infant’s status at birth if delivered in a hospital, and clinical history of events leading to death, including autopsy findings.
aWith the exception of the project in California, which covered a one-year period.
4 ENGLISH EDITION-BOLETIN DE LA OSP ’ Vol. VII, No. I, 1973
The first Inter-American Investigation of Mortality (3) in adults (aged 15-74 years) in- dicated clearly that hospital and autopsy records contained additional information which, when combined with clinical data, made possible more precise definitions of causes of deaths. It was found that the selection of a sin- gle cause was often difficult, if not impossible, and that suitable methods for handling multiple causes and combinations of causes needed to be developed. It was recommended, moreover, that modem computer techniques be used, on an experimental basis, for studying the epidemi- ology of diseases, not as isolated entities but as combinations of pathological states.
The use of the multiple-cause approach in the Investigation of Mortality in Childhood has provided a much greater understanding of the role of immaturity and nutritional deficiency, two causes of death which are assigned as asso- ciated causes much more frequently than as underlying causes. Also, important interrela- tionships such as the synergistic action of in- fectious diseases and nutritional deficiency and the effects of complications of pregnancy on the product of gestation, as measured by weight and condition of the newborn, have been clari- fied.
Analysis of the findings of the Investigation, in which extensive data were collected on 35,095 deaths, has uncovered and measured health problems for which solutions must be sought. The patterns of mortality in each of the 25 areas of the I5 projects appeared to be dis tinct; no two areas had the same type or size of problems. Thus the information provided for each area constitutes a unique contribution to knowledge of conditions and problems in the city, state, province, and country in which the area is situated, as well as adding to the under- standing of health problems of the Hemisphere and of the world. Nutritional deficiency was found to be the outstanding and most serious health problem uncovered in the Investigation, as measured by its involvement in mortality.
Fortunately, the International Classification of Diseases (#), for the first time in the 1965 Revision, includes a group for ‘rAvitaminoses
and Other Nutritional Deficiency” (categories 260-269). Whereas in earlier Revisions some of the deaths due to nutritional deficiency were assigned to nutritional maladjustment (category 772) in the section on “diseases of early in- fancy,” the new grouping brings together in one section all deaths from these important causes, and thus facilitates measurement of the size of the problem.
Classification and Diagnostic Evidence
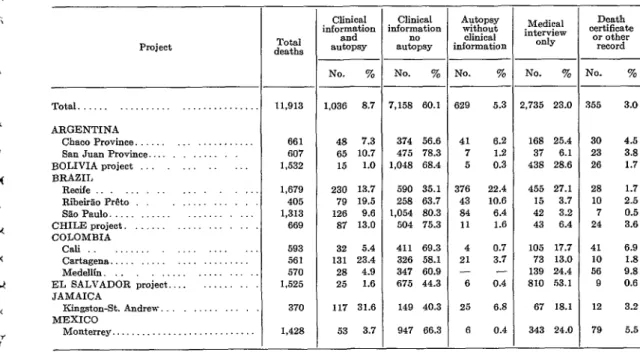
All the information available from the clini- cal histories, autopsy findings, and medical interviews in the home was used to assess the nutritional state of the deceased infants and young children and the role of nutritional de% ciency as underlying or associated cause of death (Table 1). Autopsy findings provided valuable supportive evidence of malnutrition in areas where the size of this important health problem had not previously been recognized.
Weights at birth and in successive age periods were also used whenever available on records. For grading the nutritional state of the de- ceased child, the Gbmez classification and scale (5, 4), based on the weight/age relationship, was applied to the weight standards developed at the Harvard School of Public Health (7). Since these standards are utilized widely and others differed only slightly from them, they appeared to be the most satisfactory for use in the Investigation.
Puffer and Serrano * NUTRITIONAL DEFICIENCY IN MORTALITY IN CHILDHOOD 5
TABLE I-Evidence for diagnosis of nutritional deficiency as underlying or associated cause of death in children under 5 years of age in 13 Latin American projects.
Project
Total. ARGENTINB
Chaco Province. San Juan Province. BOLIVIA project _. BRAZIL
Recife Rib&?& P&o SE0 Paula. CHILE project. COLOMBIA
cali Cartsgem%. Meddlfn . EL SALVADOR project.. JAMAICA
Kingston-St. Andrew. .,... MEXICO
370 117 31.6
Monterrey.. . 1,428 53 3.7
-
- Tots1 deaths
11,913 1,036 8.7
661 607 1,532
48 7.3 65 10.7 15 1.0 1,679 230 13.7 405 79 19.5 1,313 126 9.6 669 87 13.0 593 32 5.4 561 131 23.4 570 28 4.9 1,525 25 1.6
- Clinical information and autopsy Clinical nformation no autopsy
No. %
7,158 60.1
374 56.6 475 78.3 1,048 68.4 590 35.1 258 63.7 1,054 80.3 504 75.3 411 69.3 326 58.1 347 60.9 675 44.3 149 40.3 947 66.3
i , --
t
-
No. %
-
_- No. 70 No. 70 329 5.3 !,735 23.0 355 3.0
41 6.2 7 1.2 5 0.3 376 22.4 43 10.6 84 6.4 11 1.6 4 0.7 21 3.7
- -
6 0.4 25 6.8 6 0.4
168 25.4 30 4.5 37 6.1 23 3.8 438 28.6 26 1.7 455 27.1 2s 1.7 15 3.7 10 2.5 42 3.2 7 0.5 43 6.4 24 3.6 105 17.7
73 13.0 139 24.4 810 53.1 67 18.1 343 24.0
41 6.9 10 1.8 56 9.8 9 0.6 12 3.2 79 5.5 - Medical interview only Death certificate
or other record
For coding and classification purposes, category 267 (protein malnutrition) of the In- ternational Classification of Diseases was as- signed for deaths in which the clinical history of illness due to nutritional deficiency or the clinical or pathologic examination clearly re- vealed the so-called “pluricarential syndrome” or ‘kwashiorkor,” characterized by low weight and the presence of edema, among other signs. This form (even when weight was not available) was always graded as severe.
Nutritional marasmus (category 268) was assigned when the clinical history specified that the deceased child was marasmatic, cachetic, or emaciated (with or without gradation by weight). Severe forms of nutritional deficiency in infants under 6 months of age frequently fell in this category. Category 269.9 (other nutri- tional deficiency, unspecified) was used for all deaths in which Grade II deficiency or equiva- lent was found, in those for which data were not available for assigning a Grade III defi- ciency to a more specific type, and in those for which no type or grade was indicated in the records.
In projects where high proportions of deaths occurred in hospitals (as in San Juan Province in Argentina, RibeirZo P&o and SZo Paul0 in Brazil, and the project in Chile), 90 per cent or more of the diagnoses of nutritional deficiency were supported by clinical or autopsy evidence. In Cartagena, Colombia, 85.2 per cent of the deaths had such evidence. In several projects (as in El Salvador), the medical interviews con- ducted in the home$rrovided the basic data for assignment of nutritional deficiency as under- lying or associated cause in many deaths.
In areas where clinical data from hospital records were limited, special caution was exer- cised in assigning nutritional deficiency as a cause, and thus the rates in those areas may be too low because of the lack of supportive evi- dence. This appeared to be the case in the Bolivia project.
6 ENGLISH EDITION-BOLETIN DE LA OSP ’ Vol. VII, No. I, 1973
in fact, were usually much lower than for other causes of death, because of the special caution exercised. In the 13 Latin American projects combined, the assignment to nutritional deti- ciency was based solely on the death certificate or other record for only 3.0 per cent of the deaths, while the percentage for all causes in the Latin American projects was 7.1. The Iind- ings, therefore, should be interpreted with care, as the problem may well be more serious in some areas than can be measured at this time. This confirms once again the need to improve the quality of clinical data and to strengthen education in disciplines such as pediatric pa- thology in many areas of Latin America.
The group “Avitaminoses and Other Nutri- tional Deficiency” (260-269) of the Interna-
tional Classification provides categories for specific avitaminoses (vitamin A deficiency 260, thiamine deficiency 261, etc.) and for the multiple deficiency syndromes (protein mal- nutrition 267, nutritional marasmus 268, and other nutritional deficiency states 269). In the Investigation only 15 deaths were found to be due to a single vitamin deficiency within cate- gories 260-266, and these categories are there- fore grouped in this report under the general heading of vitamin deficiency within the overall section 260-269, which in this report has been more properly named “nutritional deficiency,” because of the relative unimportance of the avitaminoses. For future revisions of the Classi- fication the group should be renamed “nutri-
tional deficiency” to give more weight to the multiple deficiency syndromes, which are of major importance in many countries.
As for categories 267-269, whenever diag- nostic evidence was sufficient the assignment was made to specific conditions (protein mal- nutrition, nutritional marasmus), though in many areas high proportions of the deaths had to be classified in the miscellaneous group (269). The methods for diagnosing nutritional
cording of diagnostic data are required if these deficiency states are to be properly identified and studied.
Nutritional Deficiency and Immaturity
Analysis of the interrelationships of nutri- tional deficiency and immaturity-both of which reflect deficits in the growth and devel- opment of the child-is essential to an under- standing of the impact of these two important causes of death.
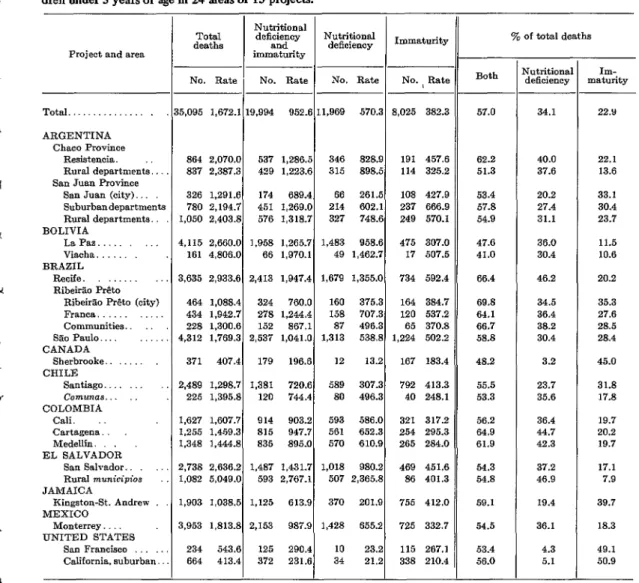
Of the 35,095 deaths under 5 years of age in the 15 projects, 19,994 or 57.0 per cent were due to these two conditions as underlying or associated causes (Table 2). In several areas two-thirds of the deceased children had such evidence of increased vulnerability to disease and high risk of death.
Immaturity and low birth weight, which indicate deficient growth and development at the time of birth, were found to be unusually frequent in infants dying in the neonatal period in several areas. These conditions are believed to be attributable at least in part to the poor nutritional state of the mother, as has been pointed out by Lechtig et al. (9) and Birch (IO), though immaturity may be due to other hazards in pregnancy as well.
The assignment of immaturity (category 777) as associated cause was made when the
clinical diagnosis showed immaturity and the
birth weight was 2,500 grams or less for infants dying in the neonatal period. Birth weights were not available for infants born at home or in several hospitals; therefore in these cases (17.9 per cent of the total) the classification of immaturity was made on the basis of clinical information alone.
Immaturity was assigned as underlying cause only when other clinical information was lim- ited or lacking and no cause other than imma- turity was stated. Immaturity was assigned for deficiency syndromes have improved consider- very few deaths occurring after the first month ably since the description of kwashiorkor (in of life.
.A
Y
L
Puffer and Semano * NUTRITIONAL DEFICIENCY IN MORTALITY IN CHILDHOOD 7
TABLE 2-Mortalitya from nutritional deficiency and immaturity as underlying or associated cause in chil- dren under 5 years of age in 24 areas of 15 projects.
Project and area
Total. .
ARGENTINA Chaco Province
Resistenoia. Rural departments., San ‘Juan Province
San Juan (city) Suburbandepertnm Rural departments.. BOLIVIA
La Pas. Viacha BRAZIL
Recife. Rib&% P&o
Rib&% P&to (city) Franca.
Communities. SBoPaulo.... _::, CANADA
Sherbrooke CHILF:
Santiago. Comunas.. COLOMBIA
Cali. Cartagena. Medellin. EL SALVADOR
San Salvador. Rural municipios JAMAICA
Kingston-St. Andrew MEXICO
Monterrey UNITED STATES
San Francisco California. suburban
-
ts
n Rates per 100,000 population.
No. Rate No. Rate No. Rate No. I Rate
5,095 1,672.1 18,994 952.6 11,969 570.3 8,025 382.3
864 2.070.0 537 1,286s 346 828.9 191 457.6 837 2,387.3 429 L223.6 315 898.5 114 325.2 326 1,291.6 174 689.4 66 261.5 108 427.9 780 2,194.7 451 1,269.0 214 602.1 237 666.9 1,050 2,403.g 576 1,318.7 327 748.6 249 570.1 4,115 2,660.O 1,958 1.265.7 1,483 958.6 475 307.0 161 4,806.O 66 1,970.l 49 L462.7 17 507.5 3,635 2,933.6 2,413 1,947.4 1,679 1.355.0 734 592.4 464 1,088.4 324 760.0 160 375.3 164 384.7 434 1.942.7 278 1,244.4 158 707.3 120 537.2 228 1.300.6 152 867.1 87 496.3 65 370.8 4,312 1.769.3 2,537 1,041.O 1,313 538.8 1,224 502.2 371 407.4 179 196.6 12 13.2 167 183.4 2,489 L298.7 1,381 720.6 589 307.3 792 413.3 225 1,395.g 120 744.4 80 496.3 40 248.1 1,627 1.607.7 914 903.2 593 586.0 321 317.2 1,255 1.45Y.3 815 947.7 561 652.3 254 295.3 1,348 1.444.8 835 895.0 570 610.9 265 284.0 2,738 2.636.2 1,487 1,431.7 1,018 980.2 469 451.6 1,082 5,049.O 593 2,767.l 507 2,365.g 86 401.3 1,903 1,038.5 1,125 613.9 370 201.9 755 412.0 3,953 1,813.g 2,153 987.9 1,428 655.2 725 332.7 234 543.6 125 290.4 10 23.2 115 267.1 664 413.4 372 231.6 34 21.2 338 210.4
made to nutritional deficiency if both the clini- cal evidence and the weight indicated a serious deficiency state. Only one assignment, either immaturity (777) or a nutritional deficiency (one of the categories 260-269) was made, and thus the total number of infants and young children with either one of these conditions was obtained.
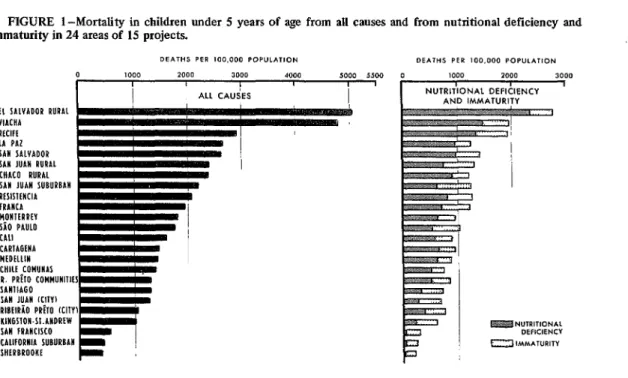
The seriousness of these two conditions as cont.ributors to mortality is clearly evident in Figure 1, which shows first the death rates from
Both
70 of total deaths
57.0 34.1 22.Y
62.2 40.0 22.1
51.3 37.6 13.6
53.4 20.2 33.1
57.8 27.4 30.4
54.9 31.1 23.7
47.6 36.0 11.5
41.0 30.4 10.6
66.4 46.2 20.2
69.8 34.5 35.3
64.1 36.4 27.6
66.7 38.2 28.5
58.8 30.4 28.4
48.2 3.2 45.0
55.5 23.7 31.8
53.3 35.6 17.8
56.2 36.4 19.7
64.9 44.7 20.2
61.9 42.3 19.7
54.3 37.2 17.1
54.8 46.9 7.9
59.1 19.4 39.7
54.5 36.1 18.3
53.4 4.3 49.1
56.0 5.1 50.9
- Nutritional
deficiency maturity IIll-
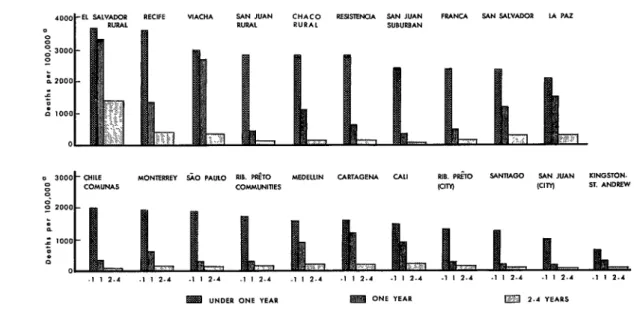
all causes in 24 areas, in descending order, and then the rates for immaturity and nutritional deficiency.
8 ENGLISH EDITION-BOLETIN DE LA OSP l Vol. VII, No. I,1973
FIGURE l-Mortality in children under 5 years of age from all causes and from nutritional deficiency and immaturity in 24 areas of 15 projects.
DEPITHS PER 100.000 POPULATION DE/\THS PER 100.000 POP”LAT,ON
*oLlo 3000 4000 1000 3000
EL SALVADOR RURAl VIACHA RlClfE LA PAZ SAN SAlVADOR SAH JUAII RURAL WACO RURAL SAW JUAN SUGUPGAW RESISKHCIA iRAliCA HOHIERREV SiO PAUL0 CA11 CARlAGtWA MEDELLIN CHILE COMUHAS
1. PRflO COMMUHllltS SAllllAGO SAlI JUAN ICIIVI RlGElRiO PRh KIIY) KIRGSlON.Sl.AHDREW SAW IRAHCISCO CALIFORNIA SUBURBAH SHLRGROOKE
deficiency indicate that the impact of the lack of growth and development was even greater after the neonatal period.
In a few areas, however, the reverse was true, as in the city of San Juan (San Juan Province, Argentina), where the death rate of 427.9 for immaturity was much higher than that for nutritional deficiency (261.5 per 100,000 population). On the other hand, within this same project in San Juan Province the rural departments had a much higher rate for nutri- tional deficiency (748.6), thereby indicating the marked difference in these problems of child growth and development in geographic areas of one project. The deficiency in the rural area probably began at birth, as is suggested by the higher rate for immaturity, and thus the health and nutritional state of the mother may be involved.
In the Sherbrooke project in Canada and in the two areas of the California project immatur- ity was an underlying or associated cause of 45.0, 49.1, and 50.9 per cent respectively of the deaths of children under 5 years of age. Nutritional deficiency was rarely assigned in these areas, which had very low rates from all
causes. In these two projects more than 60 per cent of the deaths were in the neonatal period (61.7 per cent in Sherbrooke and 63.5 in Cali- fornia). The situation was thus distinctly dif- ferent from that found in the Latin American projects.
As can be seen in Figure 1, in areas where the overall death rates for children under 5 years of age were high, the rates were high also for nutritional deficiency. In areas with low death rates, nutritional deficiency was less important and immaturity was assigned in a high proportion of the deaths. Thus reduction of mortality, in childhood is dependent on measures to prevent both of these serious con- ditions.
The data for the Latin American projects suggest that the problem of nutritional defi- ciency begins with the future mother. There is clearly a need for measures to prevent low birth weights as well as for nutrition programs aimed at promoting normal growth and development. Age at Death
A full account is given below of mortality
i h
7
Puffer and Sewanb - NUTRITIONAL DEFICIENCY IN MORTALITY IN CHILDHOOD 9
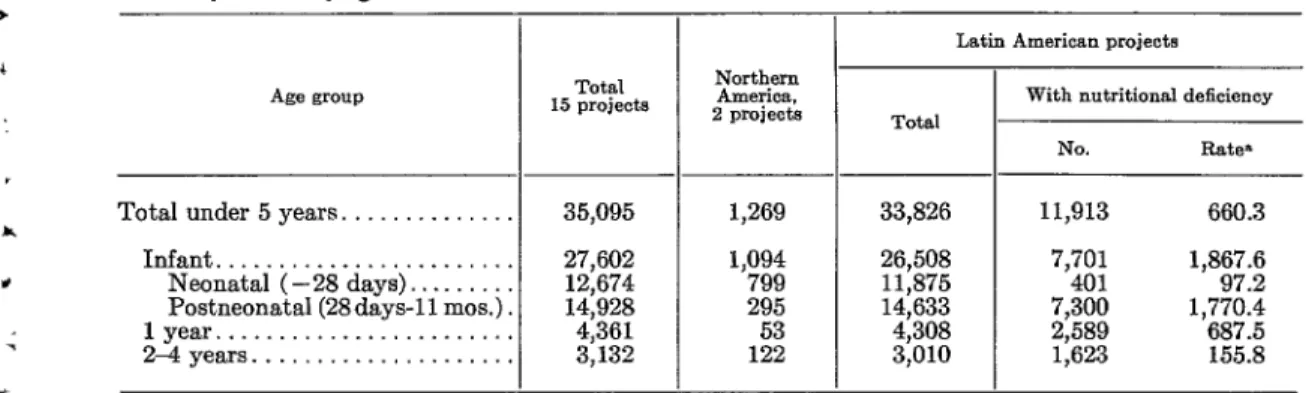
TABLE 3-Deaths under 5 years from all causes in 15 projects, by age group, and deaths from nutritional deficiency as underlying or associated cause in 13 Latin American projects combined.
Age group
Total under 5 years. ... Infant ...
Neonatal (-28 days). ...
Postneonatal (28days-11 mos.)
lyear ... 24 years. ...
Total 15 projects
35,095
27,602 12,674
14,928
4,361 3,132
_-
-
1,269 1,094 799 295 1;;
-
_-
-
Latin American projects
Total
33,826 11,913 660.3
26,508 7,701 1,867.6
11,875 401 97.2
14,633 7,300 1,770.4
4,308 2,589 687.5
3,010 1,623 155.8
With nutritional deficiency
No. Rate*
a Rates under 1 year of age per 100,000 live births: others per 100,000 popul&ion.
from nutritional deficiency by age at death. This is the first time that such data for specific geographic areas have become available to permit an epidemiologic description of this important health problem. The study of deaths with this deficiency as an underlying or as an associated cause provides an excellent measure of the impact of this condition on mortality.
In the two projects in Northern America (Sherbrooke in Canada, and the California pro- ject) nutritional deficiency was underlying or associated cause of only 56 deaths (4.4 per cent) and the following analysis is therefore confined to the 13 Latin American projects. Table 3 shows, by age group, the conversion from 35,095 deaths in all 15 projects to 33,826 in the 13 Latin American projects which are analyzed in the remainder of this paper.
Of the 33,826 deaths of children under 5 years of age in the 13 projects, 11,913 or 35.2 per cent had nutritional deficiency as under- lying or associated cause. This represents an overall rate of 660.3 per 100,000 population. If neonatal deaths (under 28 days of age) are ex- cluded, 11,512 deaths out of 21,951, or 52.4 per cent, had this deficiency state as a cause.
Table 3 reveals clearly the seriousness of the problem among infants under one year of age. Infant deaths with nutritional deficiency as underlying or associated cause numbered 1,867.6 per 100,000 live births-or by the standard unit for infant mortality, 18.7 per 1,000 live births-a rate higher than the total
infant death rate in several countries of the world.
The problem is particularly severe in the postneonatal period (28 days-l 1 months of age) and during the second year of life. The onset of severe forms of malnutrition early in the first year of age in several projects, as reflected by this exceedingly high death rate in the post- neonatal period, has very serious implications. Winick and Ross0 (II) have shown that nutri- tional deficiency occurring in early stages of rapid growth may have more permanent effects on the child than that occurring during periods of slower growth.
In Table 4 and Figure 2 mortality from nutritional deficiency is shown for three age groups (under 1 year, 1 year, and 2-4 years) for 21 areas of the 13 projects. The rates for in- fants (as underlying or associated cause) ex- ceeded 2,000 per 100,000 live births in 10 areas. In nine others they were in excess of 1,000. Only in the city of San Juan, Argentina, and in Kingston-St. Andrew, Jamaica, were the rates less than 1,000 per 100,000 live births.
10 ENGLISH EDITION-BOLETIN DE LA OSP ’ Vol. VII, No. 1, 1973
TABLE 4-Mortalitya from nutritional deficiency as underlying or associated cause, by age group, in 21 areas of 13 Latin American projects.
Project and ares -
Total 13 projects.. . 11,913 660.3
ARGENTINA Chaco Province
Resistencia. . .
Rural departments. San Juan Province
San Juan (city).
Suburban departments.. .
Rural departments. .
BOLIVIA La Paz.
Viacha. . . . . 1
BRAZIL
Recife . , .
Rib+r?o-P&o
pL;;m P&to (city). Cromrn;,itie$:.:::::::‘::::: Siio Paula..
CHILE
Santiago... .._...
Comunas . .
CyJyyA . ..,..._...,...,
Cartagena. .
Medellin .
EL SALVADOR
San Salvador. .
Rural municipios. JAMAICA
Kingston-St. Andrew. .
MEXICO
1,018 980.2 507 2,365.8
370 201.9
Monterrey . . . . 1,428 655.2
Under 5 years Under 1 year 1 year
-
No. Rate
No.
Rate7,701 1,867.6 1,589 687.5
346 828.9 270 2,755.l 52 581.7 315 898.5 215 2,756.4 75 1,071.4
66 261.5
214 602.1
327 748.6
9450
1::
2i61'1269 2:796:3
8 158.1
2 279.3 396.8
1,483 958.6 746 2,029.4 489 1,477.3
49 1,462.7 25 2,941.Z 19 2,676.l
1,679 1,355.0 1,080 3,553.6 354 1,319.Q
160 375.3
158 707.3
87 4Q6.3
1,313 538.8
589 307.3
80 496.3
116 1,246.0
119 2,337.g
64 1,666.7 1,062 1,826.0
E 227.0 451.6
14: 249.3 269.7
494 1,229.5
66 1,941.2
5g3 fEEi
561 570 610:Q
306 1,450.2 278 1,553.l 308 1,587.6
597 2,330.2
198 3,666.7
243 593.3
1,003 1,892.l
66 177.8
9 288.5
169 836.6
197 1,145.3
154 828.0
262 1,146.6 147 3,259.4
90 230.1
247 548.6
No. Rate -
.- 1
-
2-4 years
No. Rate
,623 155.8
24 101.7
25 120.3
3 19.8
2; 32.6 86.7
248 285.1
5 267.4
245 355.1
24 96.5
18 139.5
1;: 136.7 78.2
29 24.7
5 50.6
118 194.4
86 166.7
108 192.9
159 278.0
162 1,345.5
37 35.4
178 142.6
a Rates under 1 year of age per 100,000 live births; others per 100,000 population
Rates in the group aged 2-4 years were much lower and thus further subdivision is not shown for that age group.
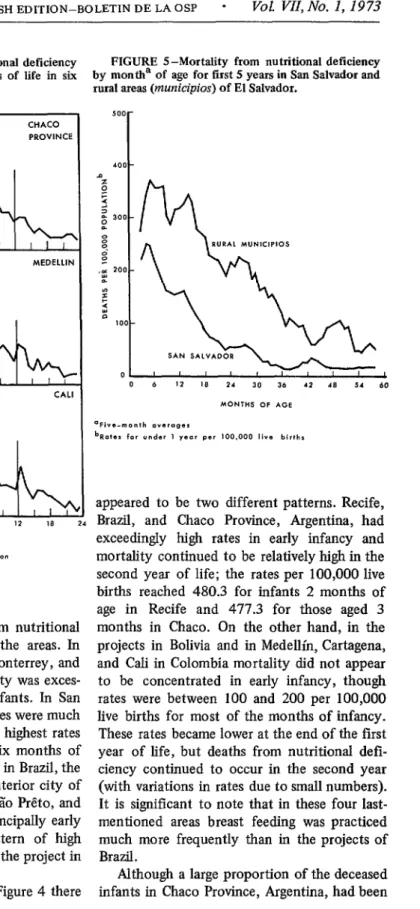
A comparison within projects shows that mortality was much higher in rural areas than in cities. For example, the rural areas (municipios) of El Salvador had the .highest death rate in infancy and appear in first place in Figure 2, while the city of San Salvador (appearing ninth) had much lower rates. The very low rates in the city of San Juan, Argentina (shown second from the last) are in distinct contrast to those in rural and suburban San Juan (appearing in fourth and seventh place). In the Bolivia pro- ject, the rates for the rural community of Viacha for the first two years of life were much
higher than those for the city of La Paz. This evidence of higher rates in rural areas than in the neighboring cities is of key importance for health planning and for further research. Health problems such as this in rural areas must be brought fully to light so that solutions may be sought.
To give a clearer picture of the problem, mortality by age at death was analyzed by month for the first two years of life and for six-month periods thereafter.5 Nutritional deli- ciency caused excessive mortality principally in the first year of life in six projects: San Juan
4
Puffer and Serrano * NUTRITIONAL DEFICIENCY IN MORTALITY IN CHILDHOOD 11
FIGURE 2-Mortality from nutritional deficiency in children under 5 years for three age groups in 21 areas of 13 Latin American projects,
.
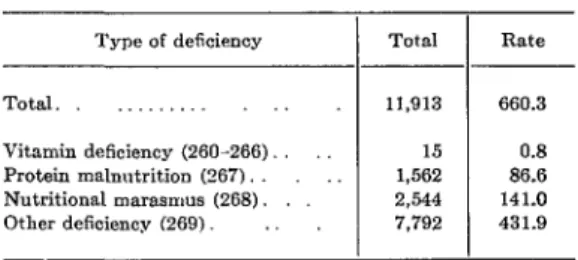
FIGURE 3-Mortality from nutritional deficiency by month of age for first 12 months of life in six
Province, Argentina; Monterrey, Mexico; SZo Medellin, Cartagena, and Cali in Colombia Paul0 and RibeirZo P&o, Brazil; Chile; and (Figure 4). In the rural areas of El Salvador the Kingston-St. Andrew, Jamaica (Figure 3). The rates continued to be relatively high throughout rates continued to be relatively high in the first the first five years of life, as can be seen in two years of life in six other projects: Recife, Figure 5, which shows both the rural rates and Brazil; Chaco Province, Argentina; Bolivia; and those for the city of San Salvador.
12 ENGLISH EDITION-BOLETIN DE LA OSP - Vol. VII, No. 1, 1973
FIGURE 4-Mortality from nutritional deficiency FIGURE 5 -Mortality from nutritional deficiency by month of age for first 24 months of life in six by montha of age for first 5 years in San Salvador and
rural areas (municipios) of El Salvador. piojects. -
CHACO PROVINCE
SOLlVlA PROJECT
MEDELLIN
CARTAGENA CALI
The patterns of mortality from nutritional deficiency varied widely among the areas. In San Juan Province, SZo Paulo, Monterrey, and RibeirZo P&o (Figure 3) mortality was exces- sive principally in very young infants. In San Juan Province, where the rural rates were much higher than those in the city, the highest rates in both areas were in the first six months of life. In the RibeirZo P&o project in Brazil, the rates were much higher in the interior city of Franca than in the city of RibeirZo P&o, and in both the problem affected principally early infancy. Although a similar pattern of high mortality in early life was seen in the project in Chile, the rates were much lower.
appeared to be two different patterns. Recife, Brazil, and Chaco Province, Argentina, had exceedingly high rates in early infancy and mortality continued to be relatively high in the second year of life; the rates per 100,000 live births reached 480.3 for infants 2 months of age in Recife and 477.3 for those aged 3 months in Chaco. On the other hand, in the projects in Bolivia and in Medellin, Cartagena, and Cali in Colombia mortality did not appear to be concentrated in early infancy, though rates were between 100 and 200 per 100,000 live births for most of the months of infancy. These rates became lower at the end of the first year of life, but deaths from nutritional defr- ciency continued to occur in the second year (with variations in rates due to small numbers). It is significant to note that in these four last- mentioned areas breast feeding was practiced much more frequently than in the projects of Brazil.
In the six projects shown in Figure 4 there
Puffer and Serrano * NUTRITIONAL DEFICIENCY IN MORTALITY IN CHILDHOOD 13
breast fed, as had a relatively large proportion in San Juan Province, in Argentina, the high death rates there in early life were in distinct contrast to the patterns found in the Bolivia and Colombia projects.
Nutritional deficiency was a particularly serious problem in the El Salvador project (Figure 5). In the city of San Salvador, the rates were very high in early infancy and high mortal- ity continued into the second and third years of life. In the rural areas the death rates were exceedingly high in early infancy and approx- imately twice as high as those in the city of San Salvador for several of the months of age. In the remainder of the first 5 years they con- tinued to be high, and several times higher than those in San Salvador. In the rural areas 49.7 per cent of the deceased infants (excluding those dying in neonatal period) had been breast fed for one month or longer, while in San Sal- vador only 34.1 per cent had been breast fed. It therefore seems likely that there are other factors (apart from the lack of breast feeding) that are responsible for excessive mortality from nutritional deficiency in these rural areas. The protective value of breast feeding may vary and be diminished by unfavorable factors that produce mortality from nutritional deficiency.
Until complete data become available on the state of health and nutrition of mothers, on the distribution of births by weight, and on feeding practices in rural as well as urban areas, the reasons for such differences will remain ob- scure. The relationships of nutritional de& ciency to diarrheal disease and to breast feeding are discussed later in this article.
Types of Nutritional Deficiency
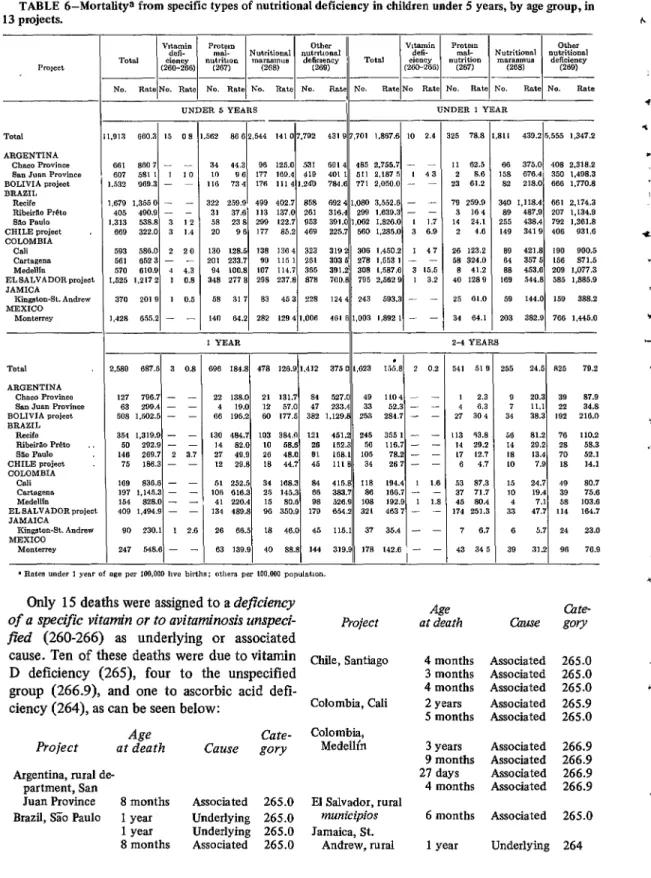
The data obtained in the Investigation make it possible, for the first time, to analyze mortal- ity from nutritional deficiency according to type of deficiency as well as age at death. The specific types assigned as underlying or associ- ated causes of 11,9 13 deaths of children under 5 years of age are given for the 13 Latin Ameri- can projects combined in Table 5, and by indi- vidual projects and age groups in Table 6. The
TABLE SMortalitya from nutritional deficiency, by type, in children under 5 years of age in 13 Latin American projects combined.
I I
Type of deficiency Total Rate
Total. 11,913 660.3
Vitamin deficiency (260-266) 15 0.8 Protein malnutrition (267). 1,562 86.6 Nutritional marasmus (268). 2,544 141.0 Other deficiency (269) 7,792 431.9
n Rates per 100,000 population.
division by type is: vitamin deficiency (260-266); protein malnutrition (267); nutri- tional marasmus (268); and other nutritional deficiency (269).
Protein malnutrition (267), or kwashiorkor, was assigned as a cause in 1,562 deaths, or 13.1 per cent of the total deaths from nutritional deficiency (11,9 13). This multiple deficiency syndrome is a severe form of generalized deti- ciency; it develops as the result of deficits in protein-rich foods over a period of several months or longer. For this reason the finding of this type of deficiency in infants less than one year of age indicates lack of sufficient food and damage by disease early in life. In those suffer- ing from this condition, the changes in body composition and function are profound.
Nutritional rnarasmus (268), which was assigned in 2,544 deaths (21.4 per cent of the total), is the result of an overall deficit in food intake or utilization and is apt to develop very early in life, that is, in the first few months. Infants suffering from this condition may re- cover partially or completely or they may develop the more serious kwashiorkor type of protein malnutrition and die from some compli- cation.
In the 13 projects, 7,792 deaths (65.4 per cent of the total) were assigned to category
14 ENGLISH EDITION-BOLETIN DE LA OSP ’ Voi. VU, No. 1, 1973
TABLE 6-Mortalitya from specific types of nutritional deficiency in children under 5 years, by age group, in 13 projects.
- 1.
-
562 8662 544 141 1. 07192 431 (* 8 701 11. t 1867.6 1 IO 2.4 25 78.8 1.8LI
I 439.2 I 5.555 1.347.2
TOtal ARGENTINA
Chaco Province flnn Juan Province BOLIVIA project BRAZIL
Recife Rib&to P&o sa.3 Paul0 CHILE nrojwt COLOMBIA
Cali C8l~tW.XlS Medcllln
EL SALVADOR project JAMICA
King&cm-St. Andrea MEXICO
,.!I,3 680.3 I.5 08
,;: 1(1/ 73 4 96 177 176 PB 125.0J 169.4 1114 3.24u 531 419 784.6 401 “’ .j 1 485 511 771 2 2:‘““il 2.050.0 167 5 - - I 48 - - 11 62.5
2 8.8 23 01.2 79 259.8 3 16.4 14 21.1 2 4.6
86 375.0 408 2.318.2 158 676.4 350 1.408.3 82 218.0 666 1,770.* 340 1.118.4 661 2.174.3 89 487.9 207 1.L34.0 255 438.4 782 1.301.8 149 3419 406 931.6 89 421.8 190 900.5 84 3575 150 87’1.5 88 453.0 209 1.077.3 189 544.8 585 1.885.9 59 144.0 159 388.2 203 382.0 766 1.44b.O 681 880 7 - -
607 581 1 I 10
632 9GD.3 - ~
679 1.3550 - - 405 400.9 - - ,313 538.8 3 1 2
GG9 322.0 3 1.4 583 588.0 2 20
561 6523 - -
570 610.9 1 4.3 ,525 1.2172 1 0.8 370 2019 1 0.0 ,428 655.2 -
322 259.9 489 402.7 858 692 4 1.080 3.552.6 - - 31 37.6 113 137.0 261 316.4 290 1.839.3 - - 58 23 8 299 122.7 953 391.0 1,062 1.826.0 L 1.3 20 9 G 177 85.2 409 225.7 560 1.285.0 3 6.9 130 128.5 138 ,364 323 3192 306 1.450.2 1 4 7 201 233.7 90 115 1 281 3035 278 I.5581 - -
94 100.8 LO7 114.7 385 391.2 308 L.587.G 3 15.5 348 277 8 298 237.8 878 700.8 795 2.5029 1 3.2
58 317 83 45 3 228 1244 243 593.3 - -
14” 84.2 282 1294 I.006 401 G 1.003 1.892 1 - -
a.
r 26 123.2
58 324.0 8 41.2 40 1289 25 01.0 34 G4.l
1 YEAR
II - 2-4 YEARS
I
- -
-
I I
690 184.8 1 478 128.9 1412 ( , 3’150 ,623 1 , I5i.81 2 0.2 541 519 155 24.5 825 78.2
1 2.3 9 20.3 39 87.9
4 6.3 7 11.1 22 34.8
27 304 31 38.3 192 210.0
13 43.8 14 29.2 ,7 L2.7 G 4.7 53 37.3 37 71.7 45 80.4 174 251.3
56 81.2 76 110.2
14 29.2 28 58.3
18 13.4 70 52.1
10 7.9 I8 14.1
15 24.7 19 80.7
10 19.4 38 75.6
4 7.1 58 103.6
33 47.7 114 164.7
7 6.7 6 5.7 24 23.0
43 34 5 39 31.2 96 76.9
TOtIll ARGENTINA
Chnco Province San Jan Province ROLIVIA project BRAZIL
Reds Rib&Z0 P&o saa Paul0 CHILE project COLOMBIA Cnli CnrtS&CllS Medellln ELSALVADORprojecl JAMAICA
Kingston-St. Andrew MEXICO
,588 687.5 3 0.8
127 796.7 - -
63 288.4 - -
508 1.602.5 - - 354 1.3193 - -
50 292.8 - -
140 269.7 2 3.7
75 186.3 - -
1G9 836.8 - - 197 1.146.3 - - 151 828.0 - - 409 1.494.9 - - 9” 230.1 1 2.E 247 648.8 - -
t- .i .
130 484.7 103 384.” 121 451.2 246 355 1 - -
I4 82.0 10 68.6 26 162.3 56 116.7 - -
27 49.9 26 48.0 91 188.1 105 78.2 - -
12 29.8 I8 44.7 45 Ill8 34 267- -
51 252.5 34 188.3 84 415.8 118 194.4 I 1.6
106 816.3 25 145.3 BG 383.7 86 1GG.7 - -
4, 220.4 15 80.6 9s 626.9 108 192.9 1 I.8
134 489.8 96 350.9 179 854.2 321 463, - -
26 66.5 18 48.0 45 115.1 37 35.4 - -
63 139.91 40 88.81 144 319.9~~ 178 142.6 1 - -
Only 15 deaths were assigned to a deficiency
of a specific vitamin or to avitaminosis unspeci-
fled (260-266) as underlying or associated Project
Age
at death
cause. Ten of these deaths were due to vitamin D deficiency (265), four to the unspecified group (266.9), and one to ascorbic acid de% ciency (264), as can be seen below:
Age
Project at death
Argentina, rural de partment, San
Juan Province 8 months
Brazil, SZo Paul0 1 year
1 year 8 months
Cate-
Cause gory
Associated 265.0
Underlying 265.0
Underlying 265.0
Associated 265.0
Chile, Santiago 4 months Associated 265.0
3 months Associated 265.0
4 months Associated 265.0
2 years Associated 265.9
5 months Associated 265.0 Colombia, Cali
Colombia,
Medelli’n 3 years Associated 266.9
9 months Associated 266.9
21 days Associated 266.9
4 months Associated 266.9
El Salvador, rural municipios Jamaica, St. Andrew, NIal
6 months Associated 265.0
Puffer and Serruno * NUTRITIONAL DEFICIENCY IN MORTALITY IN CHILDHOoD 15
The overall rate for all types of nutritional deficiency in children under 5 years of age in the 13 projects combined-660.3 per 100,000 population-is indicative of the seriousness of this health problem (Table 5). The combined rate for protein malnutrition was 86.6 per 100,000. In eight of the projects very few deaths were assigned to this category, and the rates there were under 100 per 100,000, but in the other five projects they ranged from 100.8 up to 277.8 (Table 6). The overall rate for nutritional marasmus was 141 .O. In all projects except that in Cartagena, Colombia, more than half the nutritional deficiency deaths were assigned to the unspecified group (269), for which the overall rate was 431.9 per 100,000 population.
With regard to infant mortality (under one year) for the 13 projects (Figure 6), nutritional marasmus and unspecified nutritional deficien- cy states accounted for most of these deaths. Only in the two projects in Recife and Carta- gena were the rates for protein malnutrition in this age group relatively high-259.9 and 324.0 per 100,000 live births, respectively.
The rates for children aged one year and 2-4 years (Figure 7) were lower. In five projects (El Salvador, Recife, Cartagena, Cali, and Medellin) protein malnutrition mortality was particularly high in the second year of life, with the rates
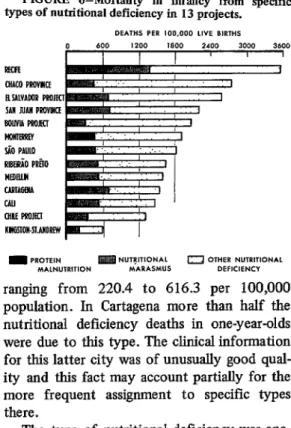
FIGURE 6-Mortality in infancy from specific types of nutritional deficiency in 13 projects.
DEATH.5 PER 100,000 LIVE BIRTHS cl 600 I200 l&l0 2400 3000 3600 Em
OIACO PRcvlcE
BYLVAWR MOJECI SAW NAII PWlllCE Bowl4 PmJEcl blcilnm I PAUL0 RlBtiO Ml0 nmnu CARlAGWl CAII ClllE FmJfo KllG!llou-sl.AnOREw
m PROTElN lg OTHER N”TRITION*L
M*LN”TRITION M*I(*sMUS DEFlClENCI
ranging from 220.4 to 616.3 per 100,000 population. In Cartagena more than half the nutritional deficiency deaths in one-year-olds were due to this type. The clinical information for this latter city was of unusually good qual- ity and this fact may account partially for the more frequent assignment to specific types there.
The type of nutritional deficiency was ana- lyzed for 12 projects by three-month age groups in the first two years of life, and for the El Salvador project in the first 5 years6
6Tables 94 and 95 in the volume Patterns of Mor- tality in Childhood (I) provide this basic information.
FIGURE 7-Mortality from nutritional deficiency, by type, in children one year and 2-4 years of age in 13 projects.
BOLIVIA PROJECT El SALVADOR PROJECI RECIFE
ENGLISH EDITION-BOLETIN DE LA OSP * Voc! VIZ, No. 1, 1973
Figure 8 shows the rates for protein malnu- FIGURE g-Mortality from nutritional deficiency trition along with the total rates-for nutritional and from pro
deficiency by three-month age groups for three Cartagena, and Cali). In
~~~~~i~o~o~ projects (Recife,
Ntein malnutrition for three-month age 5 years in San Salvador and rural areas Nf El Salvador.
Cartagena the peak rates for protein malnutri-
age, and in Recife -the rates were highest for “z “O” those aged 9-17 months. In Cali the highest rate $! was for children 15-l 7 months old. In all three projects, in the last age group of the two-year period (21 to 23 months) essentially half the
6oo g deaths from nutritional deficiency were due to i protein malnutrition.
FIGURE S-Mortality from nutritional deficiency and from protein malnutrition for three-month age groups in the first two years of life in three projects.
0 1 2 3 rI tion occurred among children 12-14 months of
FIGURE IO-Mostality from nutritional defi- ciency, protein malnutrition, and nutritional maras- mus by month of age in first two years of life in 13 Latin American projects combined.
4 300 t
For El Salvador, where nutritional deficien- cy was a particularly serious problem, the death
yG 2oo f rates in both urban and rural areas are shown i by three-month intervals for the first 5 years of i- ,50 life. In the rural areas protein malnutrition g mortality rose to the peak rate of 498.4 in the % group aged 27-29 months, and then declined in < ,oo the older groups, These rates are illustrated in % Figure 9. After the second year of life protein malnutrition was the type found in two-thirds of the deaths due to nutritional deficiency (109 out of 162).
Nutritional
For the 13 Latin American projects com-
bined, the role of the various types of nutri- 0 6 12 IS 24 tional deficiency as underlying or associated *GE IN MONTHS
Puffer and Serrano - NUTRITIONAL DEFICIENCY IN MORTALITY IN CHILDHOOD 17
TABLE 7-Mortalitya from nutritional deficiency, by type and by month of age, in first two years of life in 13 Latin American projects combined.
T - T
.- _- - Protein malnutrition w37) Nutritional marasmus (268) Total Avitaminoses
(260-266)
Month of age - --
-
NO. Rate NO. Rate NO. Rate NO. Rate NO. Rate
Under 1. 1. ... 2 ... 3 ... 4 ... 5 ... 6 ...
439 106.5 904 219.2 1,086 263.4 969 235.0 821 199.1 670
607 E 510 123:7 476 115.4 424 102.8 393 95.3 402 97.5 413 109.7 297 78.9 % 75.2 62.9 iii 64.8 59.8 218 57.9 164 43.6 141 37.4 135 35.9 111 29.5 121 32.1
1 0.2
- - - - - -
11;
358.70233 56:5 237 57.5 233 56.5 195 47.3 182 44.1 153 37.1 114 27.6 104 25.2 iii 22.3 21.3
405 98.2 757 183.6 850 206.1 726 176.1 578 140.2 463 112.3 399 96.8 . . . . . . . . . . . . . . . . . . . . . . . . . .
; 0.7
7 :-; ;; 217 6.1 . . . . . . . . . . . . . . . . . . . . 7.. .
. . . . . . . . . . . . . . . . . .
if
138-T
E 15:8 13.3 65 15.8
iii 23.4 18.3 :; 18.1 17.8 72 19.1 Eli 17.0 15.7 2; 12.7 11.2 it? 11.2 40 1:::
322 78.1 306 74.2 254 246 % 249 60:4 245 166 E: 157 41:7 120 31.9 113 30.0 125 33.2 117 31.1 :: 23.6 22.3 19.1 14.3 18.6 8.. 9.. 10. 11. 2 1 ;::
- -
12. 2 15.
80 21.2 ii 14.9 16.5
xi 13.3 15.4 z: 12; 27 6: i:: 20 s-z 11 2:9 . . . .
T
0.51 03
- - . . . . . . . . . . . . . . . . . . . . . . . . . . . . . . . . . . . . . . . . . . . . . . . . . . . . . . . . . . . it: 18. 19. 20. 21. 22. . . . . . . . . . . . . . . . , . . .
23. . . . . . . . . . . . . .
a Rates under 1 year of age per 100,000 live births; others per 100,000 population.
shown in Figure 10 and Table 7. The rate8 for all types combined were highest at 2 and 3 months of age and then declined in the older groups. Protein mahmtritkn was diagnosed for three infant8 at 2 months of age, for five at 3
months, and for seven at 4 months; the fre- quency then increased steadily until the largest number8 were recorded for children aged 12-16 months, and it decreased thereafter during the latter part of the second year of life. Table 8 shows for the 13 projects combined the protein malnutrition death rate8 for the group under 5 years as a whole as well as for infants and chil- dren 1 year and 24 years old. The death rate of 184.8 per 100,000 population for one-year-olds indicates that these children suffered the great- est mortality from this type.
This overall picture combining the rates for all projects does not reveal the gravity of the protein malnutrition problem in certain of the projects. Detailed analyses of the kind made for
the El Salvador project are advisable for other areas. For this purpose it is necessary to have available adequate data for rural areas as well as sufficient clinical evidence to distinguish pro- tein deficiency from the non-specific state8 when assigning the cause. Protein malnutrition is an indicator of a serious health problem whose impact extends far beyond childhood. Research is needed in order to ascertain the effect of damage by protein-calorie malnutri- tion on future mothers and determine whether there is a relationship to low birth weights in their offspring.
While mortality from protein malnutrition increased to the highest rates in the second year of life, the rates for nutritional marasmus reached a peak at 2 and 3 months of age and then gradually declined (Table 7). Some of the survivors of nutritional maraSmus probably later developed protein malnutrition and thus the damage was laid in this early period of life.
18 ENGLISH EDITION-BOLETIN DE LA OSP ’ vol. VII,No. I, I973
It is therefore clear that preventive measure8 are required very early in life not only to reduce mortality from nutritional deficiency of the intermediate and marasmatic types, but to pre- vent protein malnutrition in the survivors as well.
Since for all forms of nutritional deficiency combined the highest mortality was in infants 2 and 3 months of age (rate8 of 263.4 and 235.0, respectively), there is clear evidence of the development of severe forms in early life. This is an important finding, for in the past emphasis has been placed on deficiencies in the second year of life. The full significance of the finding is apparent from the fact that a high incidence of protein-calorie malnutrition at an early age, when the need for rapid growth and develop- ment is greatest, can result in irreparable damage to the survivors.
TABLE S-Protein malnutrition as underlying or associated cause of death under 5 years, by age group,’ in 13 Latin American projects combined.
Age group Total Rste
Under 5 years. . . . . . 1,562 86.6
~ycizk; I year. 325 78.8
2-4year$:::::::::::::: 696 541 184.8 51.9
n Rates under 1 year of age per 100,000 bve births; others per 100,000 population.
The use of the 1965 Revision of the Inter- nationai Classification of Diseases, which brought together in one section the various form8 of nutritional deficiencies, and the adop- tion of the multiple-cause approach to the study of mortality in this Investigation, have made it possible to arrive at these analyses and provide an epidemiologic description of nutri- tional deficiency by type as well as age at death. Such analyses should lay the foundation for new and effective approaches to the study of mea8ure8 for prevention of such deficiency.
Interrelationships of Causes
The various patterns of mortality due to diarrheal disease as underlying cause in the first
year of life were shown elsewhere in the report of the Investigation,’ while this account has
presented similar data for nutritional deficiency as underlying or associated cause. The pattern8 for these two important diseases of childhood are brought together in Figures 11 and 12, by three-month age groups in the first year of life.8
Figure 11 present8 the rates for 10 projects. In the first four (Recife, Chaco Province, Sb Paulo, and Monterrey) diarrheal disease mortal- ity was very high in the first three months of life and decreased sharply in infants 6-8 months and 9-11 months of age. A somewhat different pattern is observed for nutritional deficiency. In Recife and S;To Paulo the rates were lower than those for diarrheal disease in the first three month8 but were higher in infants aged 6-8 months and 9-11 months, thereby showing a delayed effect of the nutritional deficiency. Actually, in Recife the total number of infant deaths from nutritional deficiency a8 under- lying or associated cause (1,080) was only slightly less than the number from diarrheal disease (1,141). The same was noted in SZo Paul0 (with 1,062 and 1,149 deaths, respec- tively). The study of clinical records revealed that in many infants the nutritional deficiency resulted from repeated episodes of diarrheal disease; their deleterious effect8 caused the deficiency weeks or months after such episodes, and the final episode became fatal for the already malnourished infant. It is thus possible to see the interrelationship of these two causes. In other cases the diarrheal disease resulted in the deaths of very young infants whose poor nutritional states were probably the result of low birth weight, among other determining factors.
In five of the other project8 shown in Figure 11 (Cali, Bolivia, Medellin, Cartagena, and Kingston-St. Andrew), different patterns were found. Excessive rates from diarrheal disease were not noted in the first three months of life.
XZhapter VIII of Patterns of Mortality in Child- hood (I).
Puffer and Serrano - NUTRITIONAL DEFICIENCY IN MORTALITY IN CHILDHOOD 19
FIGURE 1 l-Infant mortality from diarrhea1 disease and nutritional deficiency by three-month age groups in 10 projects.
FIGURE 124nfant mortality from diarrhea1 disease and nutritionti-deficiency by three-month age groups in specific areas of three projects.
In these projects breast feeding was more commonly practiced and was continued longer than in the Brazilian projects. The pattern for nutritional deficiency was also different in these projects, showing only small variations. In the project in Chile the patterns for both diar- rheal disease and nutritional deficiency were similar to those in Recife and SZo Paulo, though the rates were much lower.
Two projects-El Salvador and San Juan Province-had sufficient data to illustrate the differences in rates in urban and rural areas, and
in RibeirZo P&o the differences between an interior city (Franca) and the city of RibeirZo P&o (which had more medical facilities and better environmental conditions)fl ‘be shown (Figure 12). Diarrheal disease ?&es were found to be much higher in rural areas than in the cities, the rural rates being about twice as high in the case of San Juan Province.
20 ENGLISH EDITION-BOLETIN DE LA OSP * Vol. VZI, No. 1,1973
TABLE 9-Nutritional deficiency as associated cause of death in children under 5 years of age (excluding neonatal deaths) by underlying cause group in 13 projects.
With nutritional rots1
leaths deficiency No. % - d -- - - - d With nutritionnl rotnl
kathB deficiency No. %
With nutritional rota1 deficiency eathe
No. % _ d
ARGENTINA ARGENTINA Chaco Province h Juan Province
With With
nutritional nutritionnl rota1 deficiency Total
eaths deaths deficiency
No. % No. %
BOLIVIA
project B:L%L RibeirSo P&o BRAZIL - I.250 579 410 96 73 70 343 258 1,185 1.713 904 578 171 69 1.061 342 611 362 278 46 38 27 91 131 - - --
1,395 43.8 2,562 1.039 60.7 1.731 657 68.2 1,122 288 49.8 396 94 55.0 213 147 311 29.3 383 45 13.2 301 ___- 1.133 677 548 53 76 48 225 183
1,490 58.2 1.188 68.6 766 68.3 294 74.2 128 60.1 177 46.2 125 41.5
372 60.9 276 76.2 217 78.1 31 67.4 28 73.7 43 47.3 63 40.5 All c~ueee
Infective and paraaitio diaeaees. Dinrrhenl disease. Meaelw Other.
Nutritional deficiency Dfeease of respiratory w&m Other e~ueee.
601 53.0 443 65.4 365 66.6 32 60.4 46 60.5 9fi 42.7 62 33.9
500 40.0 305 52.7 238 58.0 34 35.4 33 45.2 119 34.7 76 29.5 BRAZIL
880 Paul0 CHILE project “%S%EA 4
965 493 51.1 555 366 65.9 394 249 63.2 89 6Q 77.5 72 48 66.7 All c~ueee .
Infective and parasitio diseasea. Diarrhea1 dleesse Meaalea Other.
2,354 1,108 47.1 1.191 710 59.f
1.554 592 38.1 593 317 53.5 473 252 53.3 21 11 52.4 99 54 54.5
1,091 458 42.0 854 488 51.3 644 340 52.8 496 346 69.8 436 249 51.2 300 190 63.3 80 51 63.8 105 91 86.7 78 40 51.3 91 65 71.4
129 113
149 54 36.2 98 35 35.7 169 64 37.9 147 57 38.8 191 107 56.C
97
525 181 34.t 541 217 40.: EL SALVADOR
project Nutritional deficiency.
Diieaees of reepiratoiy system Other ceueea
55
452 125 27.7 454 150 33.c
72 134 204
41 30.6 86 42.2 JAMAICA
Cinaaton-St. Andrea M0nterrey MEXICO -- ) > 1 3 L - 2,903 2,073 1,667 177 229 179 375 276
1,317 45.‘ 1,123 54.: 876 52.! 126 71.: 121 62.1 111 29.1 83 30.
913 420 351 9 60 67 All caueee.
Infeotive and pameitio dieeases Diarrhea1 diieaee Measles. .
2,576 1,288 50.0 1,564 1,042 66.6 933 595 63.8 297 207 69.7 334 240 71.9
90
503 110 21.9 419 136 32.5 297 32.t
172 41.c 148 42.: 3 # 21 35.c 32 24S 93 31s
L
6 1 - Other.. ,
Nutritional defioienou.. Dleeeaes of reepirsto& eyatem. Other c~peee.. .
130 296 * Percentage is not calculated when the base is less than 16.
delayed deleterious effect of diarrheal disease was thus clearly evident in this age period. As in the projects shown in Figure 11, the numbers of infant deaths from the two causes (diarrheal disease as underlying and nutritional deficiency as underlying or associated) were practically the same. These data of the Investigation thus indi- cate the seriousness of this complex of diarrheal disease-nutritional deficiency in rural areas of Latin America and probably in interior cities as well.
The relationship of nutritional deficiency as associated cause of death to three broad groups of underlying causes in the 13 Latin American projects can be seen in Table 9; these groups are
Puffer and Serrano * NUTRITIONAL DEFICIENCY IN MORTALITY IN CHILDHOOD 21
FIGURE 13-Frequency of nutritional deficiency as associated cause of deatha by underlying cause group in 13 projects.
Rleuaio PRilO
CAR116EKA RECIR HOYIERREV MEDElllN CHACO PROVINCE BOLIVIA PROJECI SiO PAUL0 I1 SALVADOR PROJECI Ctlllt PROJECI Chll
S?K JUAN PROVINCE KIW6SIOK.SLARDREW
When the data for all 13 Lath-~ American projects are combined, the synergistic action of Infectious diseases and nutritional deficiency becomes evident (Table 10 and Figure 14). TABLE IO-Nutritional deficiency as associated cause of death under 5 years of age (excluding neo- natal deaths) by underlying cause group in 13 Latin American projects combined.
Nutritional deficiency a8 Underlying cause group deaths Total associated cltuse
No. %
All causes.. . 21,961 10,349 47.1 Infective and parasitic diseases. 12,598 7,667 60.9 Diarrhea1 disease.. . . 8,770 5,331 60.8
Measles 2,103 1,311 62.3
otter. . 1,725 1.025 59.4
Nutritional deficiency. . . 1,163
Diseases of respiratory system. 4.469 1,435 32.1 Other causes.. . 3.721 1,247 33.5
FIGURE 14-Nutritional deficiency as associated cause of deaths due to infectious diseases and other causes in children under 5 years of agea in 13 Latin American projects combined.
PER c.ENT
0 10 a0 30 40 50 60 70
IKFEtllOUS DISEASES OTHER CAUSESb
Nutritional deficiency was associated cause in 60.9 per cent of the deaths from infectious diseases, as compared with only 32.7 per cent of deaths from all other causes. These findings are in accord with previous research indicating the importance of the nutritional state of the host in the development of disease. For exam- ple, Schneider (12, 13) found that under cer- tain conditions dietary factors were capable of influencing resistance to infectious disease in mice. Recently Scrimshaw, Taylor, and Gordon (14) provided a comprehensive review of the interactiori of nutrition and infection. The Investigation provides the first extensive series of data on deceased children, based on the study of multiple causes, which show the fre- quent and serious involvement of nutritional deficiency with infectious diseases and its synergistic effects on those morbid conditions. The role of increased host susceptibility to such diseases can be measured by the degree in which nutritional deficiency is involved as an associated cause of death. As was pointed out in the report of the Investigation,g immaturity constitutes a state of high vulnerability particu- larly during the neonatal period. After this period, nutritional deficiency is an indicator of increased susceptibility to disease, as was shown in regard to measles. Infants and young children
22 ENGLISH EDITION-BOLETIN DE LA OSP l Vol. VII, No. 1. 1973
with evidence of immaturity or nutritional deficiency are more susceptible to infection, and thus health programs must center on pre- vention of both infectious diseases and nutri- tional deficiency. Since immaturity and nutri- tional deficiency in infants may be at least partially due to deficient nutrition in the mother, particular emphasis should be placed also on the health of women in the reproduc- tive period, especially during pregnancy. Infants of healthy mothers have better chances to be born with normal weight and with more resis- tance to infection.
Factors other than those mentioned in this account were also considered in relation to nutritional deficiency. A most important one was breast feeding, which was the subject of detailed analysis.’ ’ The extent of breast feed- ing was found to be limited; in three projects in Brazil and in El Salvador less than one half of the infants dying in the postneonatal period had been breast fed for at least one month, the lowest percentage (26.8) being that found in Recife, Brazil. Six months is the minimum period recommended for breast feeding; how- ever, in the 13 Latin American projects com- bined only 18.4 per cent of the infants dying at 6-11 months of age had been breast fed for six months. The percentages of infants breast fed and never weaned who had nutritional de% ciency as underlying or associated cau8e of death were lower than among infants breast fed not at all or for only limited periods. The high nutritional value of breast milk and the protec- tion it affords against infection make it an important factor in preventing nutritional defi- ciency. Action at the community level to encourage breast feeding, with the active par- ticipation of organized groups and of health authorities, is an urgent need in developing areas. Mothers in those areas should be made to
lochapter XIII of the report (1).
realize that breast feeding their young infants is vital for the child’s survival, and for that reason should constitute an integral part of effective reproductive function.
Discussion
What is now known about nutritional defi- ciency as well as about low birth weight and immaturity would seem to indicate that the deficient nutritional state of populations is perhaps the most important cause of excessive mortality in developing areas. A kind of vicious cycle is established whereby mothers who have been handicapped since early life by nutritional deficiency and other environmental factors may give birth to low-weight infants. Many of these infants die from infectious diseases because of their increased vulnerability, and those who survive continue being at greater risk of the hazards of the environment and of nutritional deficiency than those born with satisfactory weight. Measured in terms of mortality and reproductive wastage, the effects of inadequate nutrition on communities are exceedingly grave, especially in women who have numerous pregnancies. The consequences of this complex cycle are much more serious when the impact on the child’s intelligence and adaptive capacity is taken into account. Evidence of this impact is accumulating (II). A review of current knowl- edge about malnutrition and its effect8 on brain and behavior was published recently by the Pan American Health Organization (1.5) in a volume incorporating the research papers presented and discussions conducted at a seminar held in Jamaica in January 1972.
Measures to break this vicious cycle through adequate nutrition of future mothers and their offspring and through reduction of biological wastage are mandatory in order to safeguard the health and intelligence of children.
Summary
In the Inter-American Investigation of
Puffer and Serrano - NUTRITIONAL DEFICIENCY IN MORTALITY IN CHILDHOOD 23
r
vestigated through the study of hospital and cause of 13.1 per cent of the total deaths from autopsy records and through interviews nutritional deficiency in the 13 Latin American conducted in the homes of deceased children projects, and nutritional marasmus (category under 5 years of age. The analysis of multiple 268) in 21.4 per cent. The roles of the various causes of death proved essential in order to types of deficiency were shown first for the 13 reveal the interrelationships of causes and to projects and then for the projects combined. gain a fuller understanding of the determinants The rates for all types combined were highest at of excessive mortality in infancy and early 2 and 3 months of age, and then declined in the
childhood. older age groups.
Of the 35,095 deaths of children under 5 years of age in the 15 projects, 19,994 or 57.0 per cent were found to be due to immaturity or nutritional deficiency as underlying or associ- ated causes. In several areas two-thirds of the deceased children had such evidence of in- creased vulnerability to disease and high risk of death.
While mortality from protein malnutrition increased to the highest rates in the second year of age, the rates for nutritional marasmus reached a peak at 2 and 3 months of age and then gradually declined. Some of the survivors of nutritional marasmus probably later devel- oped protein malnutrition and thus the damage was laid in this early period of life.
In nearly all the Latin American areas mor- tality from nutritional deficiency was higher than that from immaturity. Since immaturity is assigned principally as a cause of neonatal deaths, these high rates for nutritional defi- ciency indicate that the impact of the lack of growth and development was even greater after the neonatal period.
Data on nutritional deficiency in the 13 Latin American projects, presented by age at death, clearly revealed the seriousness of the problem among infants under one year of age. To give a clear picture of mortality by age, death rates were shown by month of age for the first two years of life. In six projects, rates from this cause were excessive, principally in the first year of life. They continued to be relatively high in the first two years of life in six other projects. In the rural areas of El Salvador the rates continued to be relatively high throughout the first five years. Comparisons within projects showed that mortality was much higher in rural areas than in cities, a finding that is of key importance for health planning and further research. Health problems such as this in rural areas must be brought fully to light so that solutions may be sought.
Study of the relationship of nutritional defi- ciency as associated cause of death to three broad groups of underlying causes in the 13 Latin American projects (excluding neonatal deaths) revealed the synergistic action of infec- tious diseases and nutritional deficiency. The latter was an associated cause of 60.9 per cent of deaths from infectious diseases, compared with 32.7 per cent of deaths from all other causes.
The types of nutritional deficiency respon- sible for deaths under 5 years of age were ana- lyzed for the first time. Protein malnutrition, or kwashiorkor (category 267 of the InternationaE
Classification of Diseases), was assigned as a
The data obtained on nutritional deficiency as well as on low birth weight and immaturity would seem to indicate that the deficient nutri- tional state of populations is perhaps the most important cause of excessive mortality in de- veloping areas. Mothers who have been handi- capped since early life by nutritional deficiency and other environmental factors probably give birth to low-weight infants; many of these in- fants die from infectious diseases because of their increased vulnerability, while those who survive continue being at greater risk of the hazards of the environment and of nutritional deficiency. The consequences of this complex cycle are much more serious when the impact on the child’s intelligence and adaptive capacity is taken into account. Measures to break this cycle through adequate nutrition of future mothers and their offspring are mandatory in order to protect the health and intelligence of the child population.
REFERENCES
(I) Puffer, R. R., and C. V. Serrano. Patterns of Mor-
taiity in Childhood-Report of fhe Inter-
American Investigation of Mortality in Child-
hood. Pan American Health Organization,
Scientific Publication No. 262, Washington, D.C., 1973.
(2) Puffer, R. R. “Initial Phases of the Inter-Ameri-