M
ESTRADO EM
E
CONOMETRIA
A
PLICADA E
P
REVISÃO
T
RABALHO
F
INAL DE
M
ESTRADO
D
ISSERTAÇÃO
E
CONOMETRIC
S
TUDY OF
A
LTERNATIVE
O
PERATORS
’
I
NVESTMENT
D
ECISIONS
H
UGO
M
IGUEL DE
J
ESUS
B
RITO
M
ESTRADO EM
E
CONOMETRIA
A
PLICADA E
P
REVISÃO
T
RABALHO
F
INAL DE
M
ESTRADO
D
ISSERTAÇÃO
E
CONOMETRIC
S
TUDY OF
A
LTERNATIVE
O
PERATORS
’
I
NVESTMENT
D
ECISIONS
P
OR
H
UGO
M
IGUEL DE
J
ESUS
B
RITO
DISSERTAÇÃO APRESENTADA AO INSTITUTO SUPERIOR DE ECONOMIA E GESTÃO/UNIVERSIDADE TÉCNICA DE
LISBOA, COMO REQUISITO PARCIAL PARA A OBTENÇÃO DO GRAU DE MESTRE EM ECONOMETRIA APLICADA E
PREVISÃO
O
RIENTAÇÃO
:
P
ROFESSORA
D
OUTORA
I
SABEL
P
ROENÇA
i
AGRADECIMENTOS
Agradeço ao sonho de fazer e ao medo de falhar. É nesta aparente contradição que
vou percorrendo o caminho. Mesmo sendo um indivíduo não se trata de um caminho
solitário e de isolamento. É feito na companhia de todos os que trazem os sonhos e
afastam os medos.
Os passos dados são já incontáveis e o que hoje agradeço depende de todas as pessoas
que ao meu lado caminharam. Começo por agradecer a essas pessoas, mesmo aos que
não fazem ideia do seu papel na definição do caminho percorrido.
Há pessoas contudo que tiveram um papel preponderante no troço do mestrado e da
realização desta tese. Foram bengala. Foram água e alimento. Foram ilusão e miragem
quando disso dependia o próximo passo. Foram a palavra e o gesto certo no momento
certo, mesmo que não o tenham percebido. Agradeço-lhes e o bom da presente tese é
também deles.
Aos vários pais, irmãos e famílias agradeço as oportunidades, os valores transmitidos e
os exemplos de vida. O vosso apoio e compreensão foram tão essenciais agora como
nos primeiros passos.
Aos amigos das Caldas, de Lisboa e do Mundo agradeço a compreensão pela ausência
e por dias de menor entusiasmo e toda a motivação transmitida.
À confraria das teses e estudo agradeço o ombro amigo e a partilha de sentimentos,
momentos e viagens. Que venham outras viagens, desafios e momentos a partilhar.
Aos colegas e amigos de trabalho agradeço o conhecimento, a experiência e a partilha
do desejo de crescer profissionalmente. À ANACOM agradeço a confiança depositada e
a disponibilização de (in)formação.
Aos colegas e amigos de mestrado agradeço a paciência, a explicação e a partilha do
olhar de “não percebo nada disto”. Aos professores do mestrado agradeço a partilha
de saber e o saber torná-lo interessante e aplicável.
Porque no caminho é sempre preciso orientação deixo uma palavra de agradecimento
sentida para a sabedoria, disponibilidade, tranquilidade e humanismo da Professora
ii
Mesmo no bom caminho precisamos por vezes de uma outra visão e de um conselho
sobre os próximos passos: Obrigado ao Professor Pierre Hoonhout, ao Professor
Joaquim Ramalho, ao João, ao Paulo e a todos os que, em almoços, cafés e outro tipo
de refeições tiveram paciência para me ouvir e aconselhar.
Uma palavra de agradecimento aos elementos do júri de prova de mestrado,
nomeadamente ao Professor João Vareda e ao Professor José Passos que, com a
relevância dos seus comentários e questões enriqueceram o resultado final da tese.
À Rita agradeço por ter aceitado o desafio e por também ela me ter dado o exemplo.
Agradeço os conselhos, o amor, carinho e vontade de caminhar. Agradeço também
continuar a trazer o meu sorriso junto do seu.
Não posso deixar de agradecer a Portugal. Pelas raízes, pelas pessoas e pela educação
que me foi proporcionada dentro do espírito daquilo que considero o mais essencial
numa sociedade: igualdade de oportunidades. Que o país não o esqueça e que
definitivamente caminhe para lá com coragem e sonho. Que as pessoas que partem e
levam com elas conhecimento e muitos sonhos regressem em breve pois fazem(-me)
toda a falta.
Caminhemos então. Sonhemos ainda mais.
iii
ABSTRACT
The relation between regulation, the alternative operators’ investment decisions and
the degree of competition in the markets, has been an important policy issue over
time. The discussions on this matter are mostly related with the possibility to achieve
service-based competition in the short run, without compromising
infrastructure-based competition in the long run. The investment ladder theory argues that both
goals are achievable by appropriate regulatory intervention.
By using a rich dataset prepared specifically for this study, and taking into account
flaws pointed out in other studies, the present study finds reasonable evidence that
the Portuguese market’s data supports theoretical assumptions of the investment
ladder theory: (i) creating conditions for alternative operators entering the market is
an important step in creating conditions for investment in infrastructure; (ii) the
regulator has the necessary tools to neutralise the opportunity cost for infrastructure
investment created by service-based competition profits.
The investment in fibre networks by alternative operators is also taken into
consideration, with an evaluation of the investment determinants and their effect on
coverage level of alternative operator’s fibre networks. Particular attention is given to
achieve an appropriate model specification, specifically considering challenges raised
by the explained variable – a fractional variable with many zeros. It is concluded that it
is preferable to use a two-part model over a one part-model, which provides evidence
that the determinants of the decision to invest in a geographical area are not entirely
similar to the determinants of the decision on the coverage level in that area.
The present study found that the intrinsic demographic, economic and social
characteristics of a given geographical area significantly influence investment decisions
of alternative operators. This supports the argument that the regulator must consider
these characteristics when defining the obligations to imposed in the market and how
to differentiate them per geographical area.
It is undeniable that econometrics represents a valid and very useful decision tool for
regulators when deciding which regulation to apply, as well as to provide the “right”
iv
RESUMO
A relação entre a intervenção regulatória, as decisões de investimento dos operadores
alternativos e o grau de concorrência nos mercados de comunicações eletrónicas tem
sido intensamente discutida. O debate centra-se na possibilidade de obter um
compromisso entre concorrência baseada em serviços no curto prazo e concorrência
baseada em infraestruturas no longo prazo. A teoria da escada do investimento
defende a conciliação destes dois objetivos pela intervenção adequada do regulador.
Usando uma base de dados tão completa quanto o possível, preparada
especificamente para o presente estudo e, atendendo às fragilidades apontadas a
outros estudos, conclui-se que a informação sobre o mercado português comprova
alguns pressupostos teóricos associados à teoria da escada do investimento: (i) a
criação de condições para que os operadores alternativos entrem no mercado é um
passo importante para que invistam em infraestrutura própria, e (ii) o regulador possui
instrumentos regulatórios para neutralizar o custo de oportunidade criado ao
investimento em infraestruturas pelos lucros da concorrência baseada em serviços.
O investimento em redes de fibra ótica pelos operadores alternativos é também
considerado, avaliando os determinantes deste investimento e o respetivo efeito no
nível de cobertura de uma área geográfica. É dada particular atenção à obtenção de
uma especificação adequada para o modelo, ponderando os desafios colocados pela
variável a explicar: variável fracionária e com muitos zeros. Conclui-se que é preferível
utilizar um modelo a duas partes em detrimento de um modelo a uma parte, pois os
conjuntos de determinantes da decisão de investir numa área geográfica e da decisão
relativa ao nível de cobertura a atingir nessa área não são idênticos.
As características demográficas, económicas e sociais intrínsecas às áreas geográficas
influenciam significativamente as decisões de investimento dos operadores
alternativos, validando os argumentos dos que defendem a consideração destas
características pelo regulador aquando da decisão sobre as obrigações a impor no
mercado e a sua segmentação geográfica.
É inegável que a Econometria é um instrumento válido e muito útil para os reguladores
quando decidem sobre o tipo de intervenção regulatória que garanta os incentivos de
v
CONTENTS
1. INTRODUCTION ... 1
2. LITERATURE REVIEW ... 3
2.1 INVESTMENT, REGULATION AND THE INVESTMENT LADDER THEORY ... 3
2.2 ALTERNATIVE OPERATORS’ INVESTMENT IN FIBRE NETWORKS ... 7
2.2.1 COST DETERMINANTS ... 8
2.2.2 DEMAND DETERMINANTS ... 8
2.2.3 MARKET AND REGULATORY DETERMINANTS ... 9
2.3 EMPIRICAL ANALYSIS ... 10
2.3.1 DIFFICULTIES IN TESTING THE LADDER HYPOTHESIS ... 10
2.3.2 EMPIRICAL WORKS ... 10
3. MARKET OVERVIEW ... 13
4. THE DATA ... 15
4.1 EXPLAINED INVESTMENT VARIABLES ... 16
4.2 EXPLANATORY VARIABLES ... 17
4.2.1 GEOGRAPHIC CHARACTERISATION VARIABLES ... 17
4.2.2 MARKET CHARACTERISATION VARIABLES ... 18
5. THE ECONOMETRIC MODELS ... 18
5.1 MODEL A - POOLED ORDERED PROBIT MODEL ... 18
5.1.1 ENDOGENEITY OF REGULATION ... 20
5.1.2 ESTIMATION AND RESULTS OF MODEL A ... 22
5.1.3 CONCLUSIONS ON THE AVERAGE MARGINAL EFFECTS (AME) ... 23
5.2 MODEL B - FIBRE INVESTMENT PER BOROUGH ... 27
5.2.1 FRACTIONAL VARIABLES AND SPECIFICATION ... 27
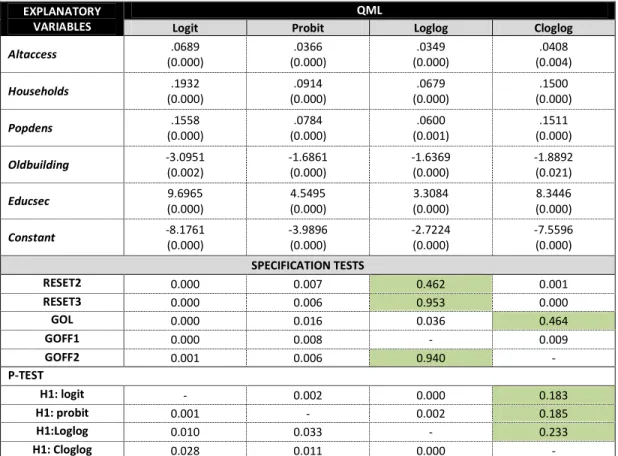
5.2.2 ESTIMATION AND RESULTS OF MODEL B ... 31
5.2.3 SPECIFICATION TESTS ... 32
6. CONCLUSIONS ... 34
REFERENCES ... 37
ANNEX 1 – TECHNICAL GLOSSARY ... 40
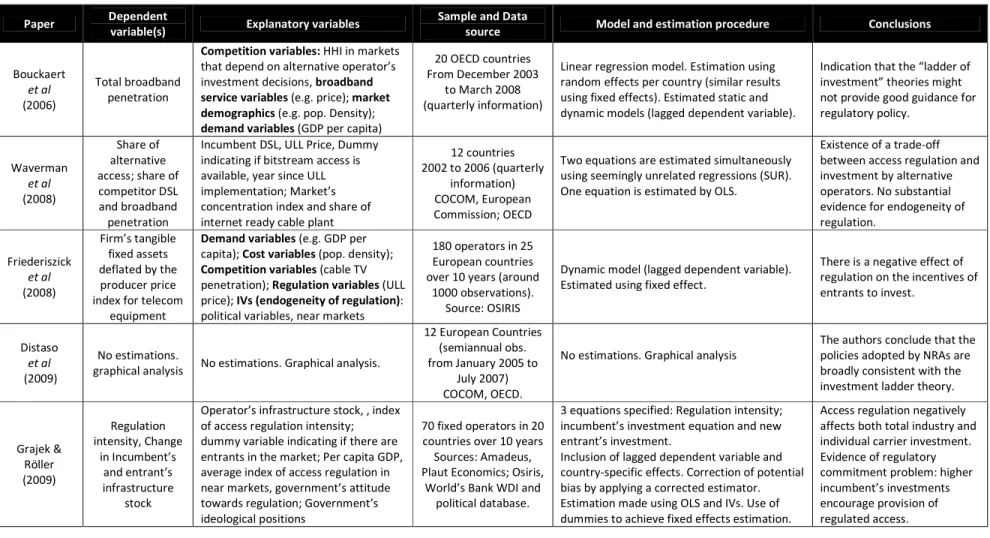
ANNEX 2 – DETAILS ON THE EMPIRICAL PAPERS CONSIDERED... 41
ANNEX 3 – MARKET OVERVIEW ... 42
ANNEX 4 – THE DATA ... 44
ANNEX 5 – RESULTS MODEL A ... 46
vi
LISTOFFIGURES
Figure 1. Martin Cave’s investment ladder(s) ... 5
Figure 2. BEREC’s NGA investment ladder ... 6
Figure 3. Investment ladder considering the investment type ... 17
Figure 4. Market share in broadband market and Pay-TV market – End of 2011 ... 43
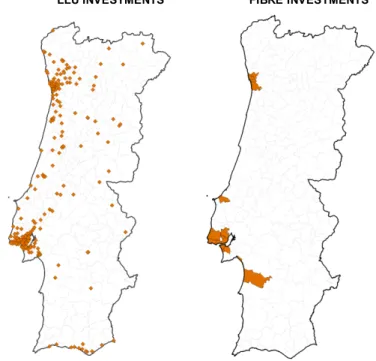
Figure 5. Location of the investments made by alternative operators ... 43
LISTOFCHARTS Chart 1. Alternative operators’ accesses per rung of the investment ladder ... 14
Chart 2. LLU price (€) evolution ... 15
Chart 3. Number of active accesses per type of access network ... 42
Chart 4. HHI – Retail active accesses ... 42
vii
LIST OF TABLES
Table 1. AME in Model A – Probability of using LLU 24
Table 2. AME effects in Model A – Probability of using own fibre network 24
Table 3. Details on the empirical papers considered 41
Table 4. ANACOM’s references to the investment ladder 43
Table 5. Explained variables 44
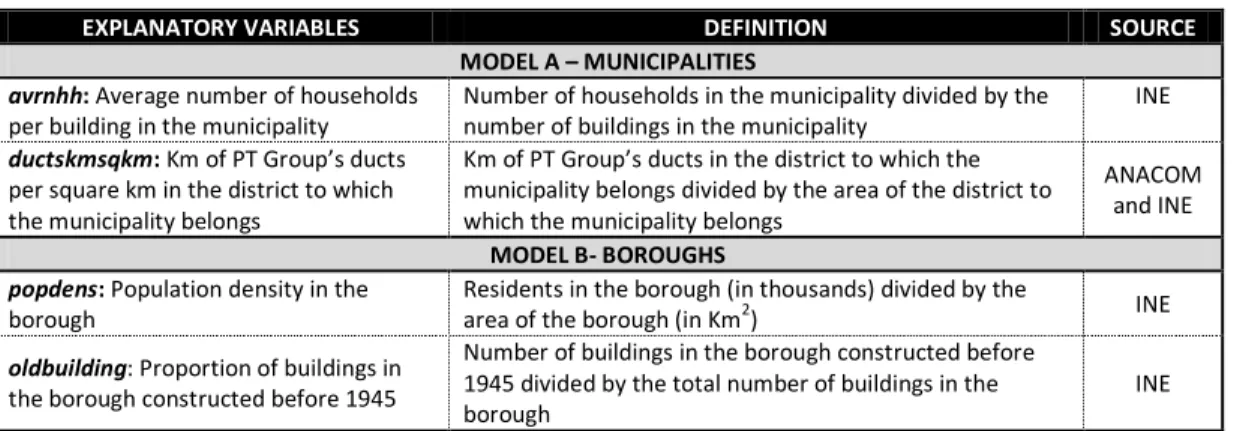
Table 6. Geographic explanatory variables 44
Table 7. Demand explanatory variables 44
Table 8. Market explanatory variables 45
Table 9. Regulatory explanatory variables 45
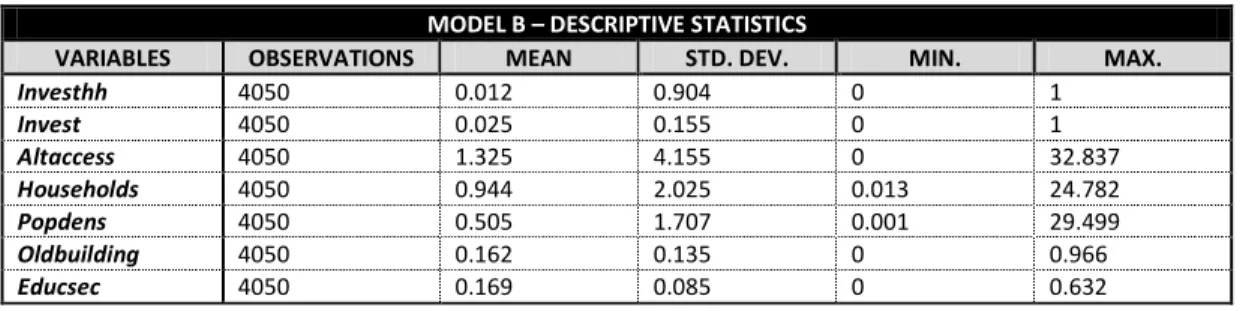
Table 10. Descriptive statistics of variables used in model A 45 Table 11. Descriptive statistics of variables used in model B 45
Table 12. Estimated coefficients in Model A 46
Table 13. AME in Model A – Probability of using bitstream access 46 Table 14. Estimated coefficients and Specification tests – One-part model 47 Table 15. Estimated coefficients and Specification tests – Two-part model 48
Table 16. Specification tests – Cloglog 48
Table 17. Specification tests – Cloglog + Cloglog 48
Table 18. Specification tests – Cloglog + Probit 49
Table 19. Specification tests – Cloglog + Logit 49
Table 20. Specification tests – Cloglog + Loglog 49
1
1. INTRODUCTION
Most European (and worldwide) electronic communications markets stem from a
monopolistic market structure in which all services were originally provided by a
state-owned monopoly. The liberalisation of the European markets marked a milestone for
the sector and announced the opening up of markets. This has been developed even
further thanks to several European directives on the subject.
One of the principles behind the European regulatory framework is to create
conditions for developing effective market competition. Until its development,
regulators should promote competition, investment and the European internal market
and defend citizen and consumer interests.
Regulators should carry out regular market analysis, defining the markets that should
be regulated and the dominant operators upon which obligations should be imposed.
Regulators may impose various obligations upon dominant operators, depending on
the specific market situation. One of these obligations concerns access to specific
network utilities of the dominant operator by alternative operators.
The relation between regulation (especially the access obligation imposition), the
operators’ investment decisions and the degree of competition in the markets has
been an important policy issue. Putting it simply, the discussion is as follows: if NRAs
give access to the dominant operator’s network, competition is achieved in the short
run. However, in the long run, this could lead to less investment in infrastructures both
by alternative operators and the dominant operator and therefore compromise
infrastructure-based competition.
There are conflicting theories explaining how regulatory decisions might alter
operators’ investment incentives. One of these theories is called the “investment
ladder” which basically defends that regulators should gradually offer different levels
of access to the dominant operator’s network. If this happens and if the regulator
provides the “right” incentives to alternative operators at each moment in time, the
theory says that alternative operators will “climb” from the easiest access level (e.g.
resale) to other access levels, which implies investment in their network and will
2
Consequently, the investment ladder theory achieves a compromise between
promoting competition (in services) in the short run and promoting investment in the
long run (infrastructure-based competition). This theory has been one of the
references in the intervention of the Portuguese regulator1 (and several other
European regulators), and has been put forward as an argument for its intervention in
the market.
The aim of this paper is firstly to analyse empirically what has happened in the access market in the last decade in Portugal regarding the investment made by alternative fixed operators that entered the market accessing the dominant operator’s2 network and to try to test empirically if what happened in the Portuguese market adheres to the investment ladder theory. We will also look at the types of investment chosen by these operators in the different Portuguese geographic areas and try to identify the determinants of the investment choices made.
Understanding the past may also be important in understanding what is happening
now or might happen in the future. The investment in fibre networks is reigniting the
discussion as to the way regulatory decisions affect operators’ investment decisions.
However, there is a significant difference: investments in fibre have yet to be made
countrywide. Consequently, the regulators have to consider that, in this case, both
alternative and dominant operators may have the option of not investing, while in the
copper networks, when the alternative operators entered the market, the dominant
operator had already a ubiquitous network.
Considering these differences and how they affect investment decisions and the
investment ladder theory, it is important to evaluate the possibility of deployment of
fibre networks by alternative operators. The regulator’s decisions regarding the
imposition of obligations in the dominant operator’s fibre network may depend on this
possibility.
Accordingly, though it is true that regulatory intervention may influence operators’
investment decisions, it is also true that there are other important variables affecting
1
Autoridade Nacional de Comunicações (ANACOM).
2
3
their investment decisions. Especially in investment in fibre, it is essential that the
regulator considers these other variables and their influence in investment decisions
when defining the obligations and how to differentiate them per geographic area. This
study is relevant not only to operators and regulators, but also to other public entities
deciding on state aid for investment in specific geographic areas.
Another goal of this paper is therefore to have a better understanding of what is happening regarding the decisions of alternative operators to invest in fibre, namely to estimate how the intrinsic characteristics associated with each geographic area may affect the investment decisions in fibre in that area.
The remainder of the paper is organized as follows. Section 2 provides a short but
extensive review of the relevant literature related with the determinants of alternative
operators’ investment, including regulation. Section 3 describes the main facts
characterizing the Portuguese market, while Section 4 presents the data used in the
empirical investigation. Section 5 explains the models used and the results achieved in
the empirical investigation. Section 6 concludes.
2. LITERATURE REVIEW
This section uses technical terms related with the electronic communications sector
which are explained in a simple way in a Technical glossary included in ANNEX 1.
2.1 INVESTMENT, REGULATION AND THE INVESTMENT LADDER THEORY
One relevant question the literature considers is the differences between the
investment motivations of alternative operators and those of the dominant operator.
According to Cave (2003), the dominant operator enjoys the advantages of usually
being the historic monopolist: networks that cover most of the country, established
market position, known brand and possible consumer inertia. This author also
mentions that the intrinsic characteristics of fixed networks may magnify the
differences between alternative and dominant operators3.
According to Cave (2003), these questions may imply cost advantages for the dominant
operator, leading to differences in the risk perception of investments and to a higher
3
4
required rate of profit for investment by alternative operators. The author defends
that the explained differences may justify the existence of transitory entry assistance
by the regulator to minimise the dominant operator’s advantages and push alternative
operator’s investment. The investment ladder theory has its roots in this need for
transitory entry assistance.
The basic principle behind the investment ladder consists of gradually offering
potential entrants different levels of access to the dominant operator’s network.
Alternative operators begin by accessing at a level requiring little investment but, as
their customer base grows, they are encouraged to invest in the next access level. This
sequential and dynamic investment by alternative operators makes them “climb” the
investment ladder and boost infrastructure-based competition.
Cave (2006) defends a proactive role of the regulator in promoting alternative
operator investment: “forcing” its investment in the next rung of the ladder, but also
“choosing” the right time to enhance this investment4. Regarding this question,
Bourreau et al (2010) clarify that this proactive attitude by the regulator is necessary
because alternative operators’ profits from service-based competition represent an
opportunity cost for investments in infrastructure, especially if access prices are low.
In order to clarify, the investment ladder theory does not say that service-based
competition is sufficient to achieve facility-based competition. This goal depends on
rigorous implementation of the theory by the regulator.
According to Cave (2006), proper implementation of the theory starts by defining the
replicable components of the network, non-replicable components of the network and
those in an intermediate position. On this issue, Bourreau et al (2010) mention that for
Cave “replicability is not a simple binary variable, depending on a range of changing
factors” (e.g. demand). Cave (2006) concludes that where a regulator finds a replicable
asset, regulation should not exist. On the other hand, if the regulator finds an asset
that is unquestionably non-replicable, access should be granted, allowing the benefits
of service competition. Consequently, the most relevant assets for implementing the
4
5
investment ladder are those classified as being in an intermediate situation in terms of
possible replication.
Considering these intermediate assets, Cave (2006, 2010) proposes a 6-step method,
involving the determination of the different access levels of the ladder and deciding on
the right regulatory tools available to make the alternative operators climb it.
Bourreau et al (2010) highlight that there are differences in the way the ladder was
defined by Cave and how the theory was implemented by regulators. The original
ladder proposed by Cave only foresees one access level available at each moment in
time. However, European regulators implemented a ladder in which multiple levels of
access are granted to the alternative operators at the same time5.
Bourreau et al (2010) discuss additional problems related to implementing this theory,
namely the insufficient information available to the regulator, the information
asymmetry between the regulator and the regulated operator(s), the credibility of
commitments assumed by regulators, the possible entrance of late entrants and the
emergence of Next Generation Access Networks (NGA).
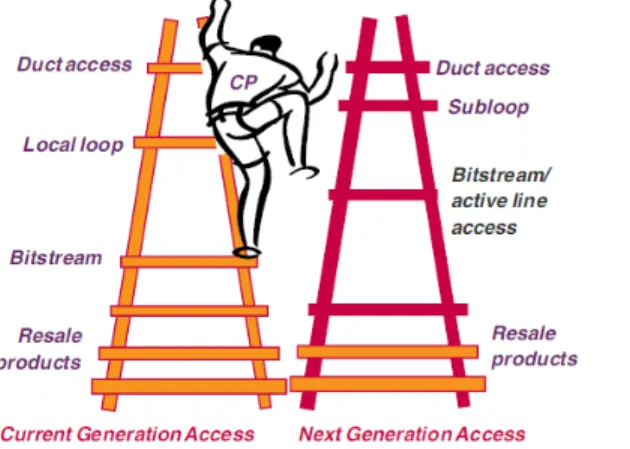
Cave (2010) discusses the main differences between the copper network investment
ladder and the NGA investment ladder (Figure 1).
Figure 1. Martin Cave’s investment ladder(s)
Source: Cave(2010)
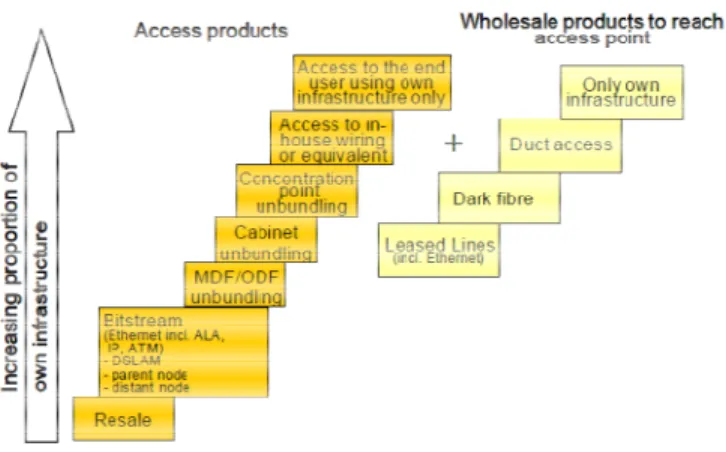
Also, BEREC6 (2010) presents a NGA version of the ladder (Figure 2).
5
Implementation justified considering (i) the geographical differences in the markets and (ii) the fact that different levels of access may correspond to different business models or phases of market entry.
6
6
Figure 2. BEREC’s NGA investment ladder
Source: BEREC (2009)
Again, the ladders presented are not identical. The ladder proposed by Cave clearly
identifies the differences between the possible access levels in a NGA world and in a
copper world. It considers the possible disappearance of local loop unbundling (LLU) at
the central exchange and the move of the “new” bitstream access a little closer to the
end user. It also highlights the important move that alternative operators must make
from the original ladder to the NGA ladder. The ladder presented by BEREC does not
tackle this issue. However, it considers wholesale backhaul products that may help
alternative operators reach the wholesale access products available. Despite the
differences described, both ladders foresee similar access levels to the NGA network.
In this set, Cave (2010) sees two options for alternative operators: (i) go up the new
version of the ladder by renting a duct and invest in their own NGA network, or (ii) go
down the ladder, moving away from the customers and using the “new” bitstream
access product. According to Cave, the ability to go up the new ladder will depend on a
variety of circumstances: the state of the ducts, housing density, etc.
If alternative operators must go down the ladder to bitstream access products, Cave
(2010) believes that it can be temporary and it is possible that these operators may
climb the ladder again after acquiring more fibre clients7.
Even though there are differences in the NGA investment ladder proposed by Cave and
BEREC, both agree that it exists and that regulators can and should continue to use
7
7
their powers to push operators up the ladder. Consequently, the logic of the
investment ladder is not disrupted.
2.2 ALTERNATIVE OPERATORS’ INVESTMENT IN FIBRE NETWORKS
The most important difference between fibre access networks and the copper access
networks lies in the fact that the first are still not completely developed and, as a
result, in some cases, no sunk costs are involved. Consequently, dominant operators
(as well as alternative operators) have the option of not investing or delaying the
investment. This question and the existence of uncertainty alter the investment
decision. Pindyck (2007) argues that, in uncertainty, the opportunity cost of losing the
option of investing in the future must be included as part of the total cost of the
investment. This creates additional challenges for regulator intervention.
Even though the most deeply discussed issue affecting investment is regulation, it is
obviously not the only one. Katz (2008) mentions that, even if regulation is a critical
variable in explaining investment, it must be considered to be an intermediate factor in
influencing investment decisions. In this regard, Katz defends that unless all the factors
affecting investment decisions are understood, it will be difficult to understand the
importance of regulation.
Additionally, ERG (2009) and BEREC (2010, 2011) show that alternative operators in
different European countries follow different NGA deployment strategies and identify
factors that may explain these different strategies: (i) population density and
geographic characteristics; (ii) costs of deployment; (iii) existence of demand; (iv)
willingness to pay for services; (v) competitive conditions (presence of cable); (vi)
potential penetration of NGA networks.
In the following sections the most relevant fibre investment determinants identified in
the existing theoretical literature and theoretical models will be presented. These
determinants may be classified as (i) cost determinants, (ii) demand determinants, (iii)
8
2.2.1 COST DETERMINANTS
Access to infrastructure
ARCEP (2007) concludes that, under some assumptions, the existence of access to
ducts by operators changes the coverage of Fibre to the Home (FTTH) networks in a
specific city8 from 1% of the area to 21% and the percentage of households covered
from 13% to 79%.
Broadband Stakeholder Group (2008) identifies differences in deployment costs of
NGA between different areas in the UK and argues that the access to infrastructure
may reduce costs by up to 16% for Fibre to the Cabinet (FTTC) and 23% for FTTH. Also
Soria & Hernández-Gil (2010), using a theoretical model, conclude that the number of
competing operators in the same geographic area grows with the availability of civil
infrastructure.
JP Morgan (2006) concludes that duct availability is one of the main determinants of
the existence of investment and states that civil works account for 68% of FTTH
deployment costs.
Population Density
Haydock et al (2012) identifies population density as a key driver in the viability of the
investment in fibre and other networks. Hoernig et al (2011) also mentions that the
viability of investment in access networks strongly depends on subscriber density.
Soria & Hernández-Gil (2010) and JP Morgan (2006) conclude that an increase in
population density has a positive effect on investment. JP Morgan specifically
mentions that FTTH deployment may be a feasible option for competitors, mainly in
metropolitan areas with a high population density, while in low density areas it may
not be possible for the alternative operators to invest.
2.2.2 DEMAND DETERMINANTS
Katz (2008) uses an investment model capturing commercial and financial variables to
assess financial viability of FTTH deployment and verifies that the results of the models
8
9
are very sensitive to the percentage of homes that are connected to fibre and the
retail ARPU9.
Also, the studies by Soria & Hernández-Gil (2010) and JP Morgan (2006) expect the
increase in ARPU and a higher penetration of the service to have a positive effect on
the number of competing networks.
2.2.3 MARKET AND REGULATORY DETERMINANTS
Competition from other infrastructures
Katz (2008) concludes that, in some cases, the operator does not have the chance not
to invest due to the pressure from upgraded cable networks. Portugal is mentioned as
one of the countries where this happens in some areas.
Hoernig et al (2011) concluded that lower profits for copper and fibre will be the result
of the existence of cable in the market. The effect of the presence of cable on the
dominant operator’s incentive to invest in fibre is ambivalent, since it affects both
copper and fibre profits.
Price of the wholesale (copper) access
We will focus on the conclusions reached on how wholesale access prices influence
alternative operators’ decisions to invest in fibre (not dominant operator’s or
aggregated total investment). Additionally, considering that the Portuguese alternative
operators’ investment decisions studied in this paper were taken when there were no
obligations imposed on fibre networks, we will also focus on the influence of the
wholesale copper price alone on investment10.
Bourreau et al (2011) conclude that alternative operators’ incentives to invest drop
with lower wholesale copper prices due to two effects: (i) replacement effect – when
the copper price is low, the alternative operator’s opportunity cost of investing in fibre
is high; (ii) business stealing effect - if the wholesale copper price is high, the copper
retail prices drop and clients will only migrate from copper to fibre with lower and less
attractive prices for investment. The other papers considered reach the same
conclusion about the way the copper price changes the alternative operators’
9
Average revenue per user. 10
10
incentives to invest in fibre11, The conclusions about the influence of the copper price
on the dominant’s operator investment decisions seem to be more controversial and
may depend on the assumed coexistence period of copper and fibre networks.
2.3 EMPIRICAL ANALYSIS
2.3.1 DIFFICULTIES IN TESTING THE LADDER HYPOTHESIS
Bourreau et al (2010) mention that the investment ladder theory relies on two main
assumptions: (1) the replacement effect12 created by service-based competition is
neutralised and service-based competition can be a stepping-stone to facility-based
entry; and (2) there are regulatory instruments available to neutralise the replacement
effect.
The difficulties in testing these assumptions econometrically are mentioned in several
papers. Cave (2010) explains the difficulties with the need to consider the effects of a
sequence of changing regulatory interventions, while Bourreau et al (2010) highlight
the difficulties caused by the imperfection in implementing the theory by regulators
and criticise the focus of some papers on countries where there is no assurance that
the theory has been implemented.
Cambini & Jiang (2009) identify areas in which empirical papers should evolve13:
(1) Use longer time-series data to capture the dynamics of the investment in
infrastructure and achieve a more robust empirical analysis.
(2) Data at the central exchange level is required for testing the significance of the
investment ladder theory.
(3) The use of structural models could provide more rigorous estimations and
could also be a relevant instrument in sustaining future policy interventions.
2.3.2 EMPIRICAL WORKS
In this section we will describe papers that studied empirically the effects of regulation
and other variables in the operators’ investment. We will focus our attention in the
description of the goal of the study and on the conclusions achieved. The details about
11
Cave (2010), Williamson et al (2011) and Hoernig et al (2011). 12
The profits from service-based competition act as an obstacle to investments in infrastructure by alternative operators.
13
11
the variables, sample, data sources, models and estimation procedures used in the
considered papers are presented in Table 3, ANNEX 2.
Bouckaert et al (2010) concludes that market demographics, in particular demand and
investment cost variables, explain differences in broadband penetration levels
between countries. Also the different modes of competition explain differences in
broadband penetration: inter-platform competition encourages broadband
penetration, whereas service-based intra-platform competition is neutral or hinders
penetration. The authors consider that these results suggest that the investment
ladder theory does not provide the justification to impose access obligations on
dominant operators.
The authors use the parameters estimated in the model applied to countries to assess
to what extent the determinants of differences in cross-country broadband
penetration may also explain regional differences within Belgium. The paper concludes
that demographic factors (population density and per capita income) explain most of
the regional differences (11% out of 12%). The difference in broadband performance is
marginally affected by differences in competition modes.
Distaso et al (2009) investigates empirically the investment ladder theory using a data
set considering the regulatory intervention adopted in 12 European countries. For each
country two graphics were plotted: (i) a “ternary diagram” showing the evolution over
time of the shares of bitstream access services, unbundling services and own network
used by alternative operators to provide retail access and broadband services; and (ii)
the ratio between the percentage changes in the regulated LLU price and the price of
bitstream access. The authors conclude that the policies adopted by regulators are
broadly consistent with the investment ladder theory.
Waverman et al (2008) analyse the impact of access regulation on investment. The
authors use econometric methods to test the impact of variations in the price of
unbundled local loops on the share of accesses provided through alternative access
platforms. The authors estimate that a 10% decline in the LLU price leads to an 18%
decline in the share of alternative access in overall broadband and evaluate this effect
12
Waverman et al (2008) consider the possibility of endogeneity of regulation: if
regulators set LLU prices considering the target levels of penetration or competition,
this variable is endogenous and the estimates will be unbiased. Endogeneity tests14
were performed and the authors conclude that there is no substantial evidence of
endogeneity.
Grajek & Röller (2009) study the relation between access regulation and investment
incentives. The estimated model includes a policy equation that endogenises access
regulation15, allowing empirical investigation as to whether a regulator is responding
differently to investments by dominant operators and entrants. The study concludes
that: (i) access regulation discourages investment by dominant and individual
alternative operators even as alternative operators’ total investment increases; (ii)
dominant operators invest more as alternative operators’ total investment increases;
(iii) access regulation is not affected by alternative operators’ investment but it
increases when investment by dominant operator increases, suggesting a regulatory
commitment problem; (iv) lagged infrastructure and regulation variables are
statistically significant and economically relevant, suggesting that there are both
short-term and long-short-term effects affecting these variables.
The study concludes that endogeneity of regulation exists and the results of the
models depend on their consideration: a significant impact of regulation on investment
is only identified when the regulation is endogenously determined by level of
infrastructure investment.
Friederiszick et al (2008) analyses the relationship between entry regulation and
investment by dominant and alternative operators. The model uses instrumental
variables (IVs) to control regulation endogeneity.
The authors reach the following conclusions regarding the fixed sector: (i) a dynamic
model controlling for endogeneity provides different results to a static model and
without considering endogeneity; (ii) the magnitude of the coefficient on the lagged
infrastructure variable is very close to 1, meaning that the stock of infrastructure is
highly time-persistent and suggesting that shocks to economic determinants of the
14
Hausman test using the lagged value of LLU as an instrument. 15
13
stock of infrastructure have very persistent effects; (iii) entry regulation discourages
infrastructure investment by alternative operators and also total investment; (iv)
dominant operators change their investment as a result of regulation.
3. MARKET OVERVIEW
To obtain a better understanding of the alternative operator investment decisions
being studied it is important to take into consideration the specific characteristics of
the Portuguese market (2001-2011) and how it evolved.
Looking at the types of networks used to supply services to end users (Chart 3, ANNEX
3), it can be seen that the number of copper accesses suffered a decline during this period16. This decline has increased since 2009, probably due to the deployment of
fibre networks by the copper operators and the “transfer” of their clients to fibre
networks. Cable accesses have increased in the analysed period and show a more
stable behaviour. The drop in the total number of accesses does not mean that fewer
users are being served. The development of bundled offers may play a role in this
decrease17.
Looking at the market competition through the evolution of the HHI18,19 concentration
index (Chart 4, ANNEX 3), it can be seen that, in general, market competition has been
on the increase. However, the most recent data shows a more stable pattern in the
evolution of the concentration index.
An access in itself has low value for the end user. Its value comes from the services
provided in that access. Consequently, it is important to consider how the services that
have been the main competition drivers in the retail market have evolved: broadband
Internet and pay TV (Chart 5, ANNEX 3). The number of television and broadband services provided has been steadily increasing. The current market shares in both
services shows (Figure 4, ANNEX 3) that these markets are dominated by the PT Group
16
A decrease of almost 1 million accesses. 17
E.g. it is possible that clients that had a cable access for receiving television services and a copper access for telephone services now have both services in the same access.
18
Herfindahl-Hirschman Index: measure of market concentration. It is calculated by squaring the market share of each firm competing in a market, and then summing the resulting numbers.
19
14
(the dominant operator) and ZON. The alternative operators that have entered the
market supported in PT’s networks using the access obligations imposed by the
regulator (e.g. Optimus and Vodafone) have gained some market share20 but do not
have an important position in these markets.
A simple graphical analysis of the data on the type of accesses in the retail broadband
market provided by alternative operators that entered the market by accessing PT
Group’s network shows us that these operators have in fact “climbed” the investment
ladder. These operators entered the market using the wholesale bitstream access
offer; they then invested in LLU and, finally, they invested in their own fibre
infrastructure (Chart 1).
Chart 1. Alternative operators’ accesses per rung of the investment ladder
The investments made by the alternative operators in LLU and in fibre networks are
concentrated mainly in coastal areas and in the main cities (Figure 5 – ANNEX 3). The identification of a “climb” up in the investment ladder by alternative operators
does not mean, however, that the investment ladder theory’s assumptions were
confirmed since (i) it was not showed that the existence of lower rungs in the ladder
(e.g. bitstream access) was important to achieve the higher rungs of the ladder (e.g.
LLU) and (ii) no causal effect between the regulator’s interventions and the
investments made by alternative operators was truly identified.
If a causal effect is to be proved between regulatory intervention and the investment
made by alternative operators, the regulatory interventions during this period must be
analysed. In this paper we will focus our attention on the regulated price of the local
20
Around 2.5% of the television market and 10% of the fixed broadband market.
0 50 100 150 200 250 300 350 400
Th
o
u
sa
n
d
s
o
f
ac
ce
ss
e
s
15
loop21, which is one of the most common regulatory variables used in the studies
considered in the literature review and is considered to be one of the most influential
regulatory interventions in alternative operators’ investment decisions22 (Chart 2).
Chart 2. LLU price (€) evolution
As mentioned in section 2.3.1, one of the flaws of previous econometric studies
looking at investment ladder theory assumptions is the use of information from
countries where regulators did not assume the goal of achieving its implementation.
Addressing this question, it is shown that, during the studied period, the Portuguese
regulator aimed to implement the investment ladder theory (Table 4, ANNEX 4).
4. THE DATA
Two datasets were prepared specifically for the development of this study. The first
dataset uses data at the municipality level and includes yearly observations from 2001
to 2011. The second dataset considers data from 2011 in terms of boroughs23. These
datasets will be used in two types of models: the first to explain alternative operators’
investment type per municipality in the long term (Model A) and the latter to explain percentage of households covered by fibre networks deployed by alternative
operators in the boroughs (Model B)24.
21
Installation price divided per 24 months plus the monthly rental price for the local loop. 22
The dataset prepared additional information about regulatory intervention during the studied period that could be used for future work.
23
Only the municipalities and boroughs located on the mainland were included in the data sets – Madeira and the Azores not included. It was considered that the investment conditions in these areas would be significantly different from those of the areas located on the main land.
24
In this model we will also explain the probability of fibre deployment by alternative operators (First part of a two-part model).
0 2 4 6 8 10 12 14 16 18
2001 2002 2003 2004 2005 2006 2007 2008 2009 2010 2011
Lo
ca
l l
o
o
p
u
n
b
u
n
d
lin
g
p
ri
16
The two main information sources are (i) ANACOM, which provided the information
about the market situation and the investment made by operators, and (ii) Statistics
Portugal25, which provided the variables characterising the geographic areas
demographically, socially and economically. Several variables were specifically created
and calculated for this dataset from the available information in order to achieve the
most appropriate information. This creation included handling and treating
geo-referenced information about the coverage of the networks and geographic
information on buildings and population.
With regard to understanding the time period of the dataset used, the use of yearly
data from 2001 to 2011 allows the alternative operators’ investment pattern to be
considered from the moment they entered the markets and conclusions to be drawn
on what happened in the Portuguese market during this period regarding these
operators’ investments.
The variables used in both models are presented26 in the following sections grouped
into different categories: (i) investment (the explained variable), (ii) geographic
characterisation variables and (iii) market characterisation variables. The variables
related to geographic characterisation will express deployment costs and expected
demand, while the market variables will address questions related to competition and
regulation.
4.1 EXPLAINED INVESTMENT VARIABLES
Three types of variables expressing the alternative operators’ investment (albeit in
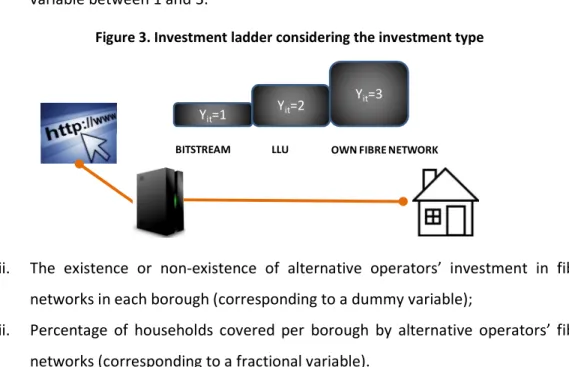
different ways) will be explained in the models:
i. The alternative operators’ investment type: may be expressed through an
“investment ladder” (corresponding to an ordinal variable), considering the
wholesale offers used and the deployment of own infrastructure to provide
25
Instituto Nacional de Estatística. 26
17
services to end users in each municipality27. Figure 3 presents in a very simplified
way the representation of the investment ladder achieved using this ordinal
variable between 1 and 3.
Figure 3. Investment ladder considering the investment type
ii. The existence or non-existence of alternative operators’ investment in fibre
networks in each borough (corresponding to a dummy variable);
iii. Percentage of households covered per borough by alternative operators’ fibre
networks (corresponding to a fractional variable).
Detailed explanation of these variables is presented in Table 5, ANNEX 4.
4.2 EXPLANATORY VARIABLES
The decision to invest in a fibre network depends on many complex factors. We
produced a rich set of variables, not only to consider all the complexity inherent in
alternative operators’ investment decisions, but also to avoid endogeneity issues
caused by omitted variables.
4.2.1 GEOGRAPHIC CHARACTERISATION VARIABLES
The first group of variables aims to express the specific characteristics of the
geographic areas in order to understand the social, demographic and economic
environment of the geographic areas. This data will allow the cost of the deployment
of a fibre network in the geographic area to be expressed, as well as the expected
demand and revenues for the operator.
27
1: If the alternative operator only supplies services to the end user in the municipality using the bitstream access; 2: If the alternative operator supplies services to the end user in the municipality using LLU;
3: If the alternative operator supplies services to the end user in the municipality using its own fibre network Yit=1
Yit=2
Yit=3
18
The variables related with the cost of the investment are presented in Table 6, ANNEX
5, while the variables related with the demand for the services are presented in Table
7, ANNEX 5.
4.2.2 MARKET CHARACTERISATION VARIABLES
Investment is not only “located” in a geographic area. Investment also occurs in a
market and the cost and the potential benefits arising from the investment will depend
on the market dynamics. Consequently, it is important to characterise the competitive
constraints under which the investment occurs. One additional constraint must be
considered: regulation, namely how access to the dominant operator’s network is
regulated.
The variables related with the competition in the market are presented in Table 8 –
ANNEX 4 and the variables expressing the regulatory intervention are presented in
Table 9 – ANNEX 4.
Regulatory variables are not considered in Model B because: (i) the regulatory
intervention in fibre networks is being decided by ANACOM28; (ii) the main goal of this
model is to consider the motivations for investment decisions without the existence of
any obligations applied in fibre networks and (iii) the use of sectional data29 combined
with the national nature of the regulatory intervention in copper access30 is an
obstacle to the consideration of these variables in this model.
Descriptive statistics of all the variables used in Model A and Model B are available,
respectively in Table 10 and Table 11in ANNEX 4.
5. THE ECONOMETRIC MODELS
5.1 MODEL A - POOLED ORDERED PROBIT MODEL
As explained above, the variable we are explaining is the type of investment
alternative operators made in each municipality (between 2001 and 2011). In short,
the real level of investment per municipality is not really observed. We only observe
28
A draft decision was published in February, 2012. This draft decision foresees the existence of geographic differentiation of the obligations to be imposed to the PT Group’s fiber network.
29
The use of dummy variables to express specific regulatory interventions (in access to ducts, for instance) in time is not possible.
30
19
the type of investment made by the alternative operators, which is, in fact, an
indicator of the investment level. The pooled ordered probit model is an appropriate
choice for addressing this situation because the ordinal variable (investment type) is
observed and can be seen as a form of censored data of the non-observed (latent)
variable: investment level performed by alternative operators, verifying:
; ~ 0,1
1; 2; 3;
where is the implicit variable expressing investment level; is the alternative
operators’ type of investment in municipality in year ; is a matrix of explanatory
variables; is a vector of the coefficients associated to the explanatory variables and
the error term.
Considering the normal distribution assumption for the distribution of the error term
of the implicit variable, it is possible to calculate the probability of each type of
investment conditioned on the explanatory variables used ( ):
1| | ! "
2| | ! " " ! "
3| | 1 " ! "
The probabilities of all the possible investment types will always sum 1.
The parameters and will be estimated by maximum likelihood (ML) and it will be
possible to estimate the marginal effects of each explanatory variable ( #) in the probabilities of occurrence of each type of investment ($ 1, 2,3 . For # continuous:
%& '()|*
%+, -./ )0 " *12 " ./ )" *123 #, with . being the standard normal
probability density function.
20
%& '()|+
%+, $| # 1, " $| # 0, ; where is the vector of all
the regressors except #
5.1.1 ENDOGENEITY OF REGULATION
As mentioned in section 2.3.2, the possible existence of endogeneity in the regulatory
variables has been addressed in other papers, however, with different approaches.
Therefore, it is prudent to consider the endogeneity of regulatory variables as an issue
to address. Otherwise there is the risk that the conclusions and results are not valid.
It is important to bear in mind that the possible regulatory endogenous variable used
in the model is the regulated price of the LLU. This price has always been defined by
the regulator equally for the whole country. Consequently, it did not vary between the
municipalities.
Grajek & Röller (2009) identify two main causes for the possible endogeneity of
regulatory variables:
(1) Relevant omitted variables correlated with regulatory variables
If the variables related to competition are not considered in the model, they will be in
the error term and if the regulator adapts the regulation imposed on the market
considering the competition level – more competition leads to less regulation – the
model may conclude that less regulation drives alternative operators’ investment.
However, the positive effect on investment may come from the existence of
competition and not from regulation. Therefore, the conclusions of the model will not
be valid.
Our model considers a competition variable – alternative operators’ market share in
broadband services in the municipality – as a control variable which solves the possible
endogeneity problems resulting from what is explained above.
There are, however, other possible sources of endogeneity caused by omitted
variables. For instance, it is possible that the error term may include alternative
operators’ expectations about future regulation since this is a non-observable variable
and it is to be expected that these expectations will affect investment decisions: if
21
invest less in the next access level of the rung. It is also probable that the expectations
about regulation are correlated with present and past regulation, causing endogeneity.
(2) Simultaneity
If there is investment by alternative operators, the regulator may be in a position to
decrease the strength of the regulation (competition will probably increase with
investment and less regulation will be needed to accomplish the regulator’s targets).
Without considering this possible source of endogeneity, it could be said that less
regulation leads to more investment, which is not the true causal relation between the
variables.
The use of IVs may solve the two possible endogeneity causes discussed above. The
inconsistency in the estimation is caused by the endogenous explanatory variable(s)
being correlated not only with changes in the explained variable, but also with changes
in the error term of the model. Using an instrumental variable (IV) allows only
exogenous variation in the endogenous explanatory variable to be generated and
unbiased estimations to be achieved.
The main difficulty in implementing estimations by IVs may be getting a valid one:
(1) The IV must be correlated with the endogenous regressor:
This assumption requires that there is some association between the IV and the
regulated price of the local loop.
(2) The IV must be uncorrelated with the error term:
The IV cannot be a relevant regressor in the model explaining the type of investment
made by alternative operators in each geographic area. This means that our IV can
only be associated with changes in the investment made by alternative operators in a
specific geographic area due to the influence it has on the LLU price or other variables
used in the model (a direct influence is not allowed)31.
31
22
Considering this, we believe that the use of an IV expressing the total local loops
unbundled in the country per year except the local loops unbundled in the municipality
(4556 7 8 fulfils the conditions of a valid IV:
(1) Regarding the LLU wholesale access, ANACOM defined an access obligation
with the LLU price oriented to the cost of providing the service. Consequently,
it is expected that the regulator will consider the wholesale LLU cost accounting
information to define the regulated price32. Considering that these services are
characterised by scale economies, it is also expected that the regulated price
will be influenced by the total number of unbundled accesses in the country
(diminished by the accesses unbundled in the municipality). In this case:
9:4 8; 7 556 , 4556 7 8 < 0. This assumption was empirically
confirmed using the results of the 1st step estimation33.
(2) It is also assumed that the investment decisions in each municipality do not
depend on 4556 7 8 . We believe, as discussed in this paper, that
alternative operators’ investment decisions mostly depend on the specific
characteristic of each geographic area and not on aggregated characteristics of
the national market, as proposed by the IV. In this case:
Cov 4556 7 8 , 0.
5.1.2 ESTIMATION AND RESULTS OF MODEL A
As mentioned above, the pooled ordered probit model is estimated by ML.
Additionally, it must be considered that inference in a pooled model needs to control
for the expected correlation of the error term over time for the same municipality
(within correlation34). To solve this question and allow valid inference, the model is
estimated using cluster-robust standard errors, which addresses heterokedasticity
issues also.
32
Other information was used according to ANACOM’s determinations on this matter: comparison of the prices defined in European countries. A variable constructed using this information could also be a viable option for an IV. 33 A negative relation between the LLU price and the IV is estimated. The p-value associated to the null hypothesis: Coefficient equals zero is 0.00.
34
23
The IV ordered probit estimation was performed considering a system of equations
nested by the Conditional (Recursive) Mixed-Process Model (CMP)35. The CMP can be
applied in two types of models: 1) those in which a recursive data-generating process
is assumed; and 2) those in which there is simultaneity, but instruments allow the
construction of a recursive set of equations (as in two-stage least squares) that can be
used to consistently estimate structural parameters in the final stage. The CMP
procedure calculates its estimators from a ML approach over a multivariate normal
distribution.
A simple dynamic model was also estimated using as a regressor the lagged investment
type made by alternative operators in each municipality. The main purpose of the
estimation of this model is to show that alternative operator investment decisions are
a dynamic process in which the current type of investment depends significantly on
past investment choices. It is obvious that, due to the expected time dependence of
investment and of the explanatory variables and the existence of unobserved
heterogeneity, the estimation of a dynamic panel data model in these conditions is a
matter for further work and improvement.
The resulting coefficients from the estimation of the models discussed are presented
in Table 12, ANNEX 5.
5.1.3 CONCLUSIONS ON THE AVERAGE MARGINAL EFFECTS (AME)
In this section the AME estimations are discussed and interpreted. Results of AME for
using LLU, using own fibre network and using bitstream are presented, respectively in
Table 1, Table 2 and Table13 (the latter in ANNEX5).
35
24
Table 1. AME in Model A – Probability of using LLU
EXPLANATORY VARIABLES
POOLED ORDERED PROBIT – AME – PROB(INVESTTYPE=2)
SIMPLE IV LAG INVEST IV+ LAG INVEST
lag.investype - - (0.000) 0.212 (0.000) 0.208
Avrnhh 0.092
(0.000) 0.093 (0.000) 0.023 (0.001) 0.019 (0.001)
Youngindex 0.018
(0.000) 0.018 (0.000) 0.004 (0.000) 0.004 (0.000)
Avrmrevenue 0.038
(0.001) 0.037 (0.001) 0.007 (0.008) 0.008 (0.004)
Altbbmkshare 0.400
(0.000) 0.400 (0.000) 0.044 (0.000) 0.039 (0.001)
priceLLU -0.065
(0.000) -0.065 (0.000) -0.006 (0.000) -0.003 (0.092)
Ductskmsqkm 0.046
(0.012) 0.046 (0.013) 0.016 (0.001) 0.016 (0.000)
Fibrenear 0.149
(0.000) 0.148 (0.000) 0.014 (0.375) 0.019 (0.247)
Note 1: In parenthesis we report the p-values associated to the null hypothesis: AME equals zero. Significance level=0.05 Note 2: Standard errors calculated using the Delta-Method.
Note 3: The dependent variable is the investment type in the municipality.
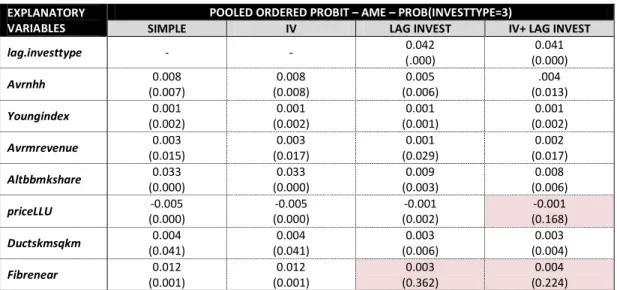
Table 2. AME effects in Model A – Probability of using own fibre network
EXPLANATORY VARIABLES
POOLED ORDERED PROBIT – AME – PROB(INVESTTYPE=3)
SIMPLE IV LAG INVEST IV+ LAG INVEST
lag.investtype - - 0.042 (.000) (0.000) 0.041
Avrnhh 0.008
(0.007) 0.008 (0.008) 0.005 (0.006) .004 (0.013)
Youngindex 0.001
(0.002) 0.001 (0.002) 0.001 (0.001) 0.001 (0.002)
Avrmrevenue 0.003
(0.015) 0.003 (0.017) 0.001 (0.029) 0.002 (0.017)
Altbbmkshare 0.033
(0.000) 0.033 (0.000) 0.009 (0.003) 0.008 (0.006)
priceLLU -0.005
(0.000) -0.005 (0.000) -0.001 (0.002) -0.001 (0.168)
Ductskmsqkm (0.041) 0.004 (0.041) 0.004 (0.006) 0.003 (0.004) 0.003
Fibrenear 0.012
(0.001) 0.012 (0.001) 0.003 (0.362) 0.004 (0.224)
Note 1: In parenthesis we report the p-values associated to the null hypothesis: AME equals zero. Significance level=0.05 Note 2: Standard errors calculated using the Delta-Method.
Note 3: The dependent variable is the investment type in the municipality.
It is important to highlight that the results and conclusions achieved with the models
using an IV to control for endogeneity of the LLU price are not significantly different of
the results and conclusions of the models not using an IV. This may mean that the
possible endogeneity of the LLU price is not affecting the estimations achieved. In fact,
in both static models (with and without IV) it was concluded that the effect on the
probability of alternative operators using LLU and fibre networks is opposite to the