HIGOR LUIS SILVA
HYBRID-ELECTRIC AIRCRAFT: CONCEPTUAL DESIGN,
STRUCTURAL AND AEROELASTIC ANALYSES
UNIVERSIDADE FEDERAL DE UBERLÂNDIA
FACULDADE DE ENGENHARIA MECÂNICA
HIGOR LUIS SILVA
HYBRID-ELECTRIC AIRCRAFT: CONCEPTUAL DESIGN,
STRUCTURAL AND AEROELASTIC ANALYSES
Projeto de Conclusão de Curso
apresentado ao Curso de Graduação em Engenharia Aeronáutica da Universidade Federal de Uberlândia, como parte dos requisitos para a obtenção do título de BACHAREL em ENGENHARIA AERONÁUTICA.
Área de concentração: Projeto Aeronáutico, Mecânica dos Sólidos e Vibrações.
Orientador: Prof. Dr. Thiago Augusto Machado Guimarães
STRUCTURAL AND AEROELASTIC ANALYSES
Projeto de conclusão de curso
APROVADO pelo Colegiado do Curso de
Graduação em Engenharia Aeronáutica da Faculdade de Engenharia Mecânica da Universidade Federal de Uberlândia.
BANCA EXAMINADORA
________________________________________ Prof. Dr. Thiago Augusto Machado Guimarães
Universidade Federal de Uberlândia
________________________________________ Prof. Dr. Leonardo Sanches
Universidade Federal de Uberlândia
________________________________________ Prof. Dr. Tobias Souza Morais
Universidade Federal de Uberlândia
ACKNOWLEDGEMENTS
I would like to thank all my family and especially my mom and dad, Alessandra and Sergio, for all the unconditional support they gave me during my journey in Uberlândia, helping me through difficult moments and encouraging me to always move on.
I would also like to thank my colleagues and professors from the Aeronautical Engineering Teaching Laboratory who participated actively in the development of this work, especially my friends Guilherme Miquelim, Gabriel Hernández, João Paulo Vieira, Kimberlly Costa, Luiz Santiago, Pedro Brito and Eduardo Gamba; professors Dr. Leonardo Sanches, MSc. Giuliano Venson and Dr. Roberto Finzi and my many other friends that I made during these five years at the Federal University of Uberlândia.
I would also like to thank my teammates who participated with me during the two years of the Tucano Aerodesign team. And I would like to thank the ISAE-ENSICA/SUPAERO and my mentor Prof. Dr. Daniel Alazard for all the learnings from the other side of Atlantic.
I would especially like to thank my advisor, Prof. Dr. Thiago Guimarães, for his teachings and encouragement during all these years of partnership.
I would like to wish a big “thank you” to my partner and friend, Higor, for being always present during the development of this work and for the teaching and stories shared on the days of work in the laboratory.
And finally, I would like to thank the members of the Examining Committee for their consideration and the time spent evaluating this work.
ACKNOWLEDGEMENTS
I would like to firstly thank my mom and dad, Dalmi and Gaspar, for being my first school, teaching me the essential values in life: humility and unconditional love. They always believed and inspired my goals, being directly responsible for everything I achieved and still intend to do. Especially to my brothers, Denes and Rubens, for the encouragement, examples, advices, and for being the backbone that kept me up and ready to face the challenges.
I would like to thank the complete support and advice given by Prof. Dr. Thiago Guimarães, our advisor and friend, throughout this project development. He has been a great source of inspiration and knowledge to me, putting his students in first place and teaching how to think out of the box.
I would like to acknowledge the Federal University of Uberlândia, the Faculty of Mechanical Engineering and all professors that guided my undergraduate life, specially Prof. Dr. Leonardo Sanches, for always being positive and believing in our abilities.
I would like to thank all my friends and colleagues that followed this journey with me, especially my project teammate João Paulo. Certainly, the path was less hard because of our alliance. Additionally, I want to thank the PETMEC group for the years of team-work and the friends from the United States, including those from Embry-Riddle Aeronautical University and Georgia Tech, who provided unique moments in my personal and professional life. A special acknowledgement to Prof. Dr. Dewey Hodges, who spent his summer time sharing part of his long years of experience.
I would also like to acknowledge the Examining Committee for their patience reading this work and constructive critical approaches.
The last but not the least, I would like to thank my partner and friend, Alexandre Gil, for withstanding all the long hours and dawn of hard work. Indeed, this work was only possible with his help and dedication.
Thank God for blessing and comforting all this journey.
GIL, A. A., SILVA, H. L. Hybrid-Electric Aircraft: Conceptual Design, Structural and Aeroelastic Analyses. 2017. 123p. Graduation Project, Federal University of Uberlândia, Uberlândia, Brazil.
ABSTRACT
This work presents the conceptual design of two hybrid aircrafts (four and six passengers) and the structural and aeroelastic analyses for the wing and empennages. The requirements in the conceptual phase were established by the aeronautical design competition held annually by the American Institute of Aeronautics and Astronautics (AIAA). The initial characteristics and geometries of a conventional aircraft were estimated through the study of historical trends. Then, the hybridization characteristics were evaluated using the series architecture, which affects mainly the range equations and the definition of the propulsive system elements that better fit the project, e. g., the internal combustion engine and batteries. To explore the multidisciplinary characteristics of the aircraft development, it was implemented an optimization procedure based on a genetic algorithm fully integrated with an aerodynamic module with performance and stability constraints, searching for the best values of the geometrical design variables. After finishing the conceptual design, the structural evaluation of wing and empennages (horizontal and vertical) was performed considering only static loads, but the failure index and the buckling instability were checked. The evaluated loads were extracted from aerodynamic models at the extreme conditions of flight envelope presented in V-n diagrams. First, the structural components were defined in aluminum 7050-T651 and later using composite material, specifically the carbon-epoxy Hexcel 8552 NMS 128/2. Additionally, only the aeroelastic analysis for the wing was evaluated, because in this work the fuselage analysis wasn't done. The results showed no flutter speed and no divergence phenomena within the aircraft's flight envelope, which is justified by the torsional rigidity obtained in the main box structure.
GIL, A. A., SILVA, H. L. Hybrid-Electric Aircraft: Conceptual Design, Structural and Aeroelastic Analyses. 2017. 123p. Projeto de Conclusão de Curso, Universidade Federal de Uberlândia, Uberlândia, Brasil.
RESUMO
O presente trabalho apresenta o projeto conceitual de duas aeronaves híbridas (quatro e seis passageiros) e as análises estruturais e aeroelásticas para a asa e empenagens. Os requisitos na fase conceitual foram estabelecidos pela competição de projeto aeronáutico realizada anualmente pelo American Insitute of Aeronautics and Astronautics (AIAA). A características e geometrias iniciais de uma aeronave convencional foram estimadas através do estudo de tendências históricas. Assim, as características de hibridização foram avaliadas utilizando a arquitetura em série, a qual afeta principalmente as equações de alcance e a definição dos elementos do sistema propulsivo que melhor se adequam ao projeto, isto é, o motor a combustão interna e as baterias. Para explorar as características multidisciplinares do desenvolvimento das aeronaves, foi implementado um processo de otimização baseado em um algoritmo genético totalmente integrado com um módulo aerodinâmico, juntamente com limitações de desempenho e estabilidade, buscando os melhores valores das variáveis geométricas do projeto. Após finalizar o projeto conceitual, a avaliação estrutural da asa e das empenagens (horizontal e vertical) foi feita considerando somente cargas estáticas, mas o índice de falha e instabilidade de flambagem foram checados. As cargas analisadas foram extraídas dos modelos aerodinâmicos nas condições extremas de voo apresentadas nos diagrama V-n. Primeiramente, os componentes estruturais foram definidos em alumínio 7050-T651 e, posteriormente, foi utilizado material compósito, especificamente o carbono-epoxy Hexcel 8552 NMS 128/2. Além disso, apenas a análise aeroelástica da asa foi avaliada, pois nesse trabalho a análise da fuselagem não foi realizada. Os resultados não apresentaram os fenômenos de flutter e de divergência no envelope de voo da aeronave, o que é justificado pela rigidez torcional obtida na estrutura principal da asa.
List of Figures
Figure 1 - History and prediction for the air traffic. Source: Airbus Global Market
Forecast 2010-2029. ... 4
Figure 2 - Example of a Degree-of-Hybridization trade-study conducted for a hypothetical Dual-Energy Storage-Propulsion-Power System (YEIS 2035). Source: Isikveren et al. [17] ... 6
Figure 3 - Series architecture diagram. ... 7
Figure 4 - Parallel architecture diagram. ... 8
Figure 5 - Aircraft development process chart. Source: Adapted [19]. ... 9
Figure 6 – Conceptual design diagram. Source: Venson [19]. ... 10
Figure 7 – Structural fatigue test in the fuselage. Source: Aviation Week. ... 12
Figure 8 - First iteration for aircraft gross weight estimate. Source: Venson [26]. ... 19
Figure 9 - Other iterations for aircraft gross weight estimate. Source: Venson [26]. .... 19
Figure 10 – Electric motor SP260D (on the left) and Siemens Extra 330LE (on the right). Source: Endless Sphere. ... 22
Figure 11 – Sketch of the 4 aircraft released by the initial concept design estimate: (a) twin-engine with tail, (b) twin-engine with conventional tail, (c) single engine with T-tail, (d) single engine with conventional tail. ... 24
Figure 12 - Series-architecture used in both 4PAX and 6 PAX aircraft. ... 26
Figure 13 – 4PAX aircraft typical flight mission. ... 31
Figure 14 - 6PAX aircraft typical flight mission. ... 32
Figure 15 - 4PAX aircraft AVL model. ... 37
Figure 16 - Genetic algorithm flowchart. ... 39
Figure 17 - 4PAX aircraft CATIA model. ... 41
Figure 19 - V-n diagram for 4PAX aircraft. ... 48
Figure 20 - V-n diagram for 6PAX aircraft. ... 49
Figure 21 - Maneuver boundaries for 4PAX aircraft. ... 50
Figure 22 - Maneuver boundaries for 6PAX aircraft. ... 51
Figure 23 – Aerodynamic analysis in XFLR5. ... 52
Figure 24 - 4PAX aircraft loads. ... 53
Figure 25 - 6PAX aircraft loads. ... 54
Figure 26 - Embraer Phenom 100 cutaway used as reference. Source: Patent US20130001356. ... 55
Figure 27 – Aircraft upper wing structure elements arrangement along the span. ... 56
Figure 28 - Aircraft lower wing structure elements arrangement along the span. ... 56
Figure 29 - Wing model drawn in CATIA. ... 57
Figure 30 - Wing model after meshing in HyperMesh. ... 57
Figure 31 - Exploded wing and groups classified by colors... 58
Figure 32 - Exploded wing and properties classified by colors. ... 60
Figure 33 - Maximum stress values envelope in MPa (on the left) and respective load cases envelope (on the right). ... 62
Figure 34 - Minimum stress values envelope in MPa (on the left) and respective load cases envelope (on the right). ... 62
Figure 35 - Shear stress values envelope in MPa (on the left) and respective load cases envelope (on the right). ... 62
Figure 36 - Wing buckling analysis with failure at 45.5% of current loads. ... 63
Figure 37 – Wing buckling analysis with failure at 108.1% of current loads. ... 64
Figure 38 – Thickness distribution along the wing [mm]. ... 64
Figure 39 - Tsai-Wu failure criterion analysis... 68
Figure 40 - Ribs maximum stress analysis [MPa]. ... 68
Figure 41 - Buckling analysis of the wing in composite material with failure at 106.3% of current loads. ... 69
Figure 42 - Final thickness distribution of the composite material layers along the wing structure [mm]. ... 69
Figure 43 - Empennages of the 4PAX (on the left) and 6PAX (on the right) aircraft. .. 70
Figure 45 - 4PAX (on the left) and 6PAX (on the right) horizontal tails exploded and
groups classified by colors. ... 72
Figure 46 - 4PAX (on the left) and 6PAX (on the right) horizontal tails exploded and properties classified by colors. ... 73
Figure 47 - Tsai-Wu failure criterion envelope (on the left) and load cases envelope (on the right) for the 4PAX horizontal tail... 75
Figure 48 - Tsai-Wu failure criterion envelope (on the left) and load cases envelope (on the right) for the 6PAX horizontal tail... 75
Figure 49 - Buckling analysis of the 4PAX (on the left) and 6PAX (on the right) horizontal tails in composite material with failure at 104.5% and 106.4% of current loads, respectively. ... 75
Figure 50 - Final thickness distribution of the composite material layers along the 4PAX (on the left) and 6PAX (on the right) horizontal tails... 76
Figure 51 - 4PAX (on the left) and 6PAX (on the right) vertical tails after meshing in HyperMesh. ... 77
Figure 52 - 4PAX (on the left) and 6PAX (on the right) vertical tails exploded and groups classified by colors. ... 78
Figure 53 - 4PAX (on the left) and 6PAX (on the right) vertical tails exploded and properties classified by colors. ... 79
Figure 54 - Tsai-Wu failure criterion envelope (on the left) and load cases envelope (on the right) for the 4PAX vertical tail. ... 81
Figure 55 - Tsai-Wu failure criterion envelope (on the left) and load cases envelope (on the right) for the 6PAX vertical tail. ... 81
Figure 56 - Buckling analysis of the 4PAX (on the left) and 6PAX (on the right) vertical tails in composite material with failure at 138.6% and 148.0% of current loads, respectively. ... 82
Figure 57 - Final thickness distribution of the composite material layers along the 4PAX (on the left) and 6PAX (on the right) vertical tails. ... 83
Figure 58 - Total displacements in mm (on the left) and total rotation in degrees (on the right) for the carbon-epoxy wing when applying the loads from Table 22. ... 85
Figure 59 - First four mode shapes of the wing. ... 87
Figure 60 - Fifth mode shape of the wing. ... 87
Figure 61 - Aerodynamic and structural meshes in Femap. ... 88
Figure 63 - V-g-f diagram for the aircraft velocities envelope. ... 89
List of Tables
Table 1 - AIAA general requirements. ... 15
Table 2 - AIAA requirements for the aircraft of 4 passengers. ... 16
Table 3 - AIAA requirements for the aircraft of 6 passengers. ... 16
Table 4 - Algorithm inputs for each aircraft configuration. ... 20
Table 5 - Algorithm outputs for each aircraft configuration. ... 22
Table 6 - Efficiencies for the hybrid-electric propulsive system. ... 27
Table 7 - Chosen mission characteristics for both aircraft design. ... 31
Table 8 - Specific energy density of current and future chemical battery systems. Source: Adapted [42]. ... 32
Table 9 - Main characteristics of Austro AE330 and Lycoming IO-580 engines. ... 33
Table 10 - 4-cylinder engine with proposed hybridization... 34
Table 11 - 6-cylinder with higher power required and without hybridization. ... 34
Table 12 - Maximum and minimum values for each optimization variable. ... 36
Table 13 - Specified criteria for genetic algorithm... 38
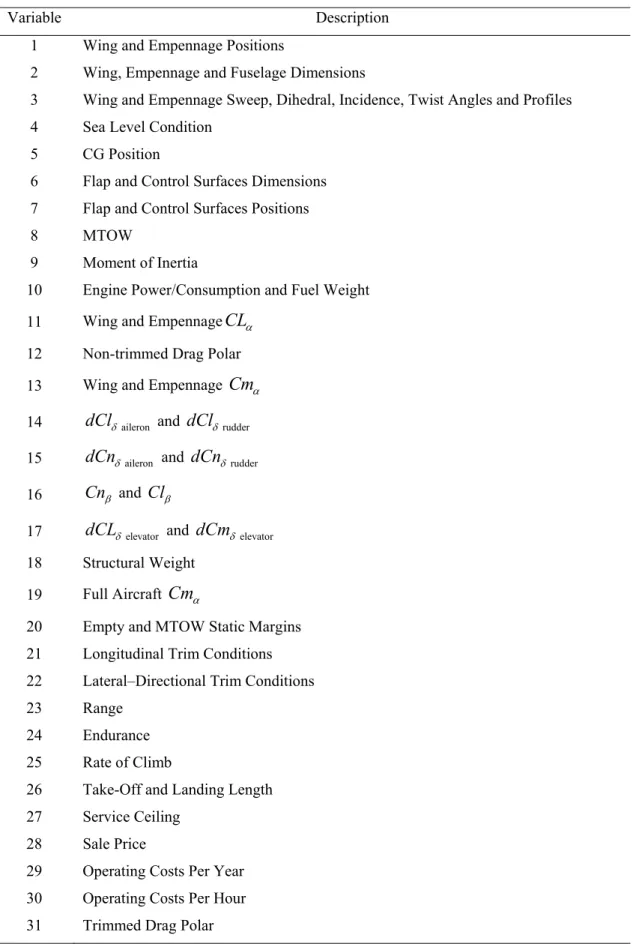
Table 14 - Variables used in the genetic algorithm and represented in Figure 16. ... 40
Table 15 - Final optimized configurations for both hybrid aircraft. ... 42
Table 16 - Aircraft of comparable role and configuration. ... 45
Table 17 - Parameters from V-n diagrams. ... 49
Table 18 - Trim conditions for 4PAX aircraft. ... 51
Table 19 - Trim conditions for 6PAX aircraft. ... 51
Table 20 - Aluminum 7050-T651 properties [58]. ... 59
Table 21 - Classification of aluminum properties in Femap. ... 59
Table 22 - Load cases classifications in Femap. ... 61
Table 23 - Composite material (Hexcel 8552 NMS 128/2) properties [58]. ... 66
Table 25 - Classification of properties in Femap. ... 73
Table 26 - Load cases classifications in Femap. ... 74
Table 27 - Classification of properties in Femap. ... 79
Table 28 - Load cases classifications in Femap. ... 80
List of Symbols
Angle of Attack
W
Wing Dihedral Angle
a
Aileron Deflection
e
Elevator Deflection
r
Rudder Deflection
bat
Battery Efficiency
cont
Controller Efficiency
em
Electric Motor Efficiency
eng
ICE Efficiency
generator
Generator Efficiency
inv
Inverter Efficiency
prop
Propeller Efficiency
wiring
Wiring Efficiency
HT
Horizontal Tail Taper Ratio
VT
Vertical Tail Taper Ratio
W
Wing Taper Ratio
Poisson’s Ratio
12 Poisson’s Ratio Direction 12 W
Wing Sweep Angle
air
Air Density
Bank Angle
Supplied Power Ratio
Degree-Of-Hybridization in Energy
a Trend Constant
LND D
a Constant for DLND Estimate
TO D
a Constant for DTO Estimate
fuselage
a Constant for Fuselage Estimate
wet S
a Constant for Swet Estimate T
a Constant for T Estimate
W S
a Constant for W S Estimate
0
W
a Constant for W0 Estimate
HT
AR Horizontal Tail Aspect Ratio
VT
AR Vertical Tail Aspect Ratio
W
AR Wing Aspect Ratio
HT
b Horizontal Tail Span
VT
b Vertical Tail Span
W
b Wing Span
c Trend Constant
fuselage
c Constant for Fuselage Estimate
l
c Rolling Moment Coefficient Related to
HT mac
c Horizontal Tail Mean Aerodynamic Chord
VT mac
c Vertical Tail Mean Aerodynamic Chord
W mac
c Wing Mean Aerodynamic Chord
m
c Pitching Moment Coefficient Related to n
c Yaw Moment Coefficient Related to
P
c Power-Specific Fuel Consumption
HT r
c Horizontal Tail Root Chord
VT r
c Vertical Tail Root Chord
W r
c Wing Root-chord
wet S
c Constant for Swet Estimate T
T
c Thrust Coefficient
W S
c Constant for W S Estimate
0
W
c Constant for W0 Estimate
D
C Aircraft Drag Coefficient
0
D
C Parasite Drag Coefficient
fe
C Friction Coefficient
L
C Aircraft Lift Coefficient
clean L
C Aircraft Lift Coefficient without Flaps
cruise L
C Cruise Lift Coefficient
max
L
C Maximum Lift Coefficient
LND L
C Landing Lift Coefficient
TO L
C Take-off Lift Coefficient
fuselage
d Fuselage Diameter
elevator
dCm Pitching Moment Variation Related to Elevator Deflection
aileron
dCl Rolling Moment Variation Related to Aileron Deflection
rudder
dCl Rolling Moment Variation Related to Rudder Deflection
aileron
dCn Yaw Moment Variation Related to Aileron Deflection
rudder
dCn Yaw Moment Variation Related to Rudder Deflection
elevator
dCL Lift Coefficient Variation Related to Elevator Deflection
D Drag
w
e Wing Oswald’s Coefficient
E Endurance
battery
E Battery Energy
electric
E Electric Energy
em
E Total Supplied Electric Motor Energy
total em
E Electric Motor Total Energy
gasturb
E Total Supplied Gas Turbine Energy
total shaft
E Shaft Total Energy
start
E Aircraft Initial Stored Energy
total
E Total Enery
E11 Young’s Modulus Direction 11
E22 Young’s Modulus Direction 22
G12 Shear Modulus Direction 12
G23 Shear Modulus Direction 23
G13 Shear Modulus Direction 13
battery
H Battery Energy Density
E
H Degree of Hybridization for Energy
fuel
H Fuel Energy Density
P
H Degree of Hybridization for Power
w
i Wing Incidence Angle
xx
I Moment of Inertia
yy
I Moment of Inertia
zz
I Moment of Inertia
2
k Induced Drag Constant
fuselage
l Fuselage Length
/
L D Aerodynamic Efficiency
cruise
M Number of Mach in Cruise
max
z
n Maximum Positive Load Factor
max
z Gust
n Maximum Positive Load Factor with Gust
min
z
n Maximum Negative Load Factor
min
z Gust
n Maximum Negative Load Factor with Gust
a
P Available Power
bat
P Battery Power
cont
P Controller Power
electric
P Electric Power
em
P Electric Motor Power
eng
P ICE Power
fuel
P Fuel Power
generator
P Generator Power
inv
P Inverter Power
total
P Total Power
wiring
P Wiring Power
f
R Range
x
R Constant for Moment of Inertia Estimate y
R Constant for Moment of Inertia Estimate z
R Constant for Moment of Inertia Estimate
S Degree-of-hybridization in Power
HT
S Horizontal Tail Area
VT
S Vertical Tail Area
w
S Wing Area
wet
S Wetted Area
final
t Final Mission Time
start
t Initial Mission Time
T Thrust
V Velocity
A
V Acrobatic Speed
C
V Cruise Speed
cruise
V Cruise Speed
D
V Dive Speed
G
V Gust Speed
HT
V Horizontal Tail Volume Coefficient
stall
V Stall Speed
VT
V Vertical Tail Volume Coefficient
cruise
W Cruise Weight
final
W Final Weight
fuel
W Fuel Weight
payload
W Payload Weight
start
W Initial Weight
0
W Gross Weight
1
W Initial Climb Weight
2
W Initial Cruise Weight
3
W Final Cruise Weight
4
W Final Descent Weight
5
W Landing Weight
6
CG
x Center of Gravity Position
HT
x Horizontal Tail Position
.
Landing gear
x Landing Gear Position
VT
x Vertical Tail Position
w
x Wing Position
C
x d Relation Between Cabin Length and Diameter
L
x d Relation between fuselage length and diameter N
x d Relation Between Nose Length and Diameter
T
x d Relation between tail length and diameter engine
y Engine Position
w mac
List of Abbreviations and Acronyms
4PAX 4 Passengers Aircraft 6PAX 6 Passengers Aircraft
AGAPE ACARE Goals Progress Evaluation
AGL Above Ground level
AIAA American Institute of Aeronautics and Astronautics
AR Aspect Ratio
ATAG Air Transport Action Group
AVL Athena Vortex Lattice
CFR Code of Federal Regulations
CG Center of Gravity
DESPPS Dual-Energy Storage-Propulsion-Power System
DoH Degree-of-Hybridization
EAS Equivalent Airspeed
FAA Federal Aviation Administration
FEA Finite Element Method
FL Flight Level
ICE Internal Combustion Engine
IFR Instrument Flight Rules
ISA International Standard Atmosphere KEAS Equivalent Airspeed in Knots
LHS Left-hand Side
MIT Massachusetts Institute of Technology
MTOW Maximum Take-Off Weight
NACA National Advisory Committee for Aeronautics
RBE Rigid Body Elements
RFP Request for Proposal
RHS Right-hand Side
ROC Rate of Climb
SFC Specific Fuel Consumption
SOL Solution
TAS True Airspeed
TZFW Total Zero Fuel Weight
VFR Visual Flight Rules
CONTENTS
CHAPTER I
INTRODUCTION
“When everything seems to be going against you, remember that the airplane takes off against the wind, not with it.” Henry Ford
The study of fully or partially electric aircraft has been the subject of discussion between researchers and engineers at universities and the aeronautics industry over the last years. The need to develop ever more efficient and greener aircraft leads to the motivation to expand technologies and move toward previously unfeasible concepts.
Currently, most General Aviation aircraft typically use internal combustion engines (ICE) as a power source. These engines burn fossil fuels with high energy densities, making this type of raw material very advantageous for aviation. However, they are highly polluting, since their burning generates the production of carbon dioxide (CO2),
which is the main responsible gas for global warming. The Air Transport Action Group (ATAG) points out that 2% of anthropometric carbon dioxide emissions come from aviation, and this number only tends to increase along with the number of aircraft in operation [1,2]. Under those circumstances, several targets have been defined in Vision 2020 and AGAPE 2020 for the next few years [3].
the future, the fossil fuel prices themselves tend to increase in the coming decades due to the fast growing worldwide energy demands and the uncertain political situation in the Middle East [4].
Thereby, all the situations mentioned above lead to consider and rethink in alternative ways of the power supply. Thus, the introduction of electric propulsion systems has been a great option. First of all, batteries can be used as a power source instead of conventional fuels. However, the battery use itself brings challenges such as the weight on board and its specific energy. Regarding the first one, aircraft are very sensitive when it comes to weight because as it increases on board, the available payload diminishes. Regarding the second one, the batteries currently have low specific energy when compared to high specific energy of conventional fuels. However, studies have shown great results for batteries in the future. Lithium-air batteries may show an impressive theoretical specific energy of 11,680 Wh/kg [5]. But in more realistic numbers, Zn-O2 batteries with specific energy of 400 Wh/kg in 2025 are expected [6]. It
is also worth remembering the challenge related to the international aviation regulations, which require that the minimum level of safety compared to the batteries be guaranteed.
Moreover, engines have a lower efficiency and power-to-weight ratio when compared to electric motors [7]. Hence, hybrid-electric systems are proposed to balance the advantages of both engine and motor systems, improving the performance. Such systems have potential advantages including low fuel costs, lower vibrations, lower pollution, and reduced noise.
After all, it is not an easy task to balance all these interests and to develop a wholly or partially electric propulsion system, but it is of great importance and necessity to carry on the study and improvement of physical limitations, fulfilling the requirements and guidelines for the future.
CHAPTER II
LITERATURE SURVEY AND THEORY
“Inventar é imaginar o que ninguém pensou; é acreditar no que ninguém jurou;
é arriscar o que ninguém ousou; é realizar o que ninguém tentou.” Alberto Santos Dumont
This chapter presents a literature review of the current papers and books that discuss new concepts and designs of hybrid aircraft, including their respective system architectures, advantages, and perspectives for the aviation future. Besides, the aircraft design philosophies adopted by most manufacturers will be presented.
2.1. Hybrid-Electric Aircraft
Triggered by the need for developing new sustainable technologies, the aerospace industry has recently spent a lot of effort on the designing of greener aircraft. Such alternative among the new concepts and linked to this perspective is the hybrid aircraft.
Earlier to the hybrid aircraft concept, it is worth coming up with the electric propulsion system of aircraft. There are many advantages and enough motivation to move toward the development of such systems. The air traffic is growing (Figure 1) and, likewise, the emission of carbon dioxide (CO2), the main responsible gas of the global warming. Thus, introducing
electric propulsion systems brings a new level of efficiency, in addition to the possibility of being zero-emission (no pollution), becoming environmentally friendly and reducing issues such as the noise that comes from the conventional engine nozzle.
Figure 1 - History and prediction for the air traffic. Source: Airbus Global Market Forecast 2010-20291.
Since fully electric aircraft do not use fossil fuels as energy source, the operational costs related to fuels and maintenance are reduced considerably. Moreover, the aircraft maneuverability and performance improve, considering the lack of attitude and altitude effects. Furthermore, the aircraft can reach a lower level of vibration and present a reliable start-up.
But not everything in the garden is rosy. The amount of battery to provide a reasonable endurance and the minimum required power of the aircraft would be enormous, since the energy capacity of the batteries is currently very small, which would result in a large weight of
batteries on board. In addition, the associated costs, availability, and project maturity are the major constraints.
Therefore, a synergy between the qualities of both conventional and full electric aircraft result in what is called hybridization, which means the integration of the propulsion system with energy stored source (batteries) and fuel source (conventional engine). The Degree-of-Hybridization (DoH) express the percentage of total power required by the aircraft that comes from the electric system [9]. Most commonly used in literature are the degree of hybridization for energy (HE) and power (HP) [17], defined as:
electric P total P H S P
(1)
and electric E total E H E
(2)
However, the degree of hybridization of power is not really a good parameter to measure how hybrid a design is [18]. Bogaert asserts:
“For example, having a large electric motor that is only for a short while will results in a large degree of hybridization of power while only a very small part of the mission is ‘hybrid’. In that regard, the degree of hybridization of energy is a better parameter. However, it is also not ideal since the specific energy of fuel is much larger compared to the battery specific energy, and the efficiency of the electrical systems much higher than that of the gas turbine. This results in values of HE being
generally quite low (< 0.2) even though the total supplied electric motor energy (Eem) might be higher than the total supplied gas turbine energy
(Egasturb).”
For this reason, another parameter is introduced: the supplied power ratio
[17]. This is defined as the total electric motor power over the entire mission in relation to the total shaft power over the entire mission.total total em shaft E E
The advantage of this parameter is that it is more intuitive than the degree of hybridization of energy. A value of 0 represents a conventional aircraft while a value of
1
represents a fully electric aircraft. When using a constant power Split over the entire mission the supplied power ratio will be approximately the same as this constant power split [18].
Figure 2 displays an example functional correlation between installed HP and HE for a
dual-energy storage-propulsion-power system (DESPPS) based upon kerosene and batteries as energy carriers targeting YEIS 2035 and were derived from assumed step values of .
Figure 2 - Example of a Degree-of-Hybridization trade-study conducted for a hypothetical Dual-Energy Storage-Propulsion-Power System (YEIS 2035). Source: Isikveren et al. [17]
Friedrich and Robinson assert that the parallel configuration provides the highest efficiency for aerospace applications [13]. The series and parallel configurations are further discussed in the following sections.
2.1.1. Series Architecture
Series architecture involves an internal combustion engine (ICE), a generator, a battery pack, an inverter, a controller and electric motors, as shown in the simplified diagram in Figure 3. The ICE is used to drive a generator, which in the sequence provides power to the controller. This controller also receives power from an inverter, which drains power from a battery pack. Thus, the controller combines both powers from the ICE and the battery pack, and finally provides power to the electric motors.
The main benefit of a series architecture is that the ICE driving the generator can be designed to operate at a consistent and optimum engine speed [8], because the ICE is not directly mechanically linked to the propellant of the aircraft. Also, the arrangement can be installed in different positions on the aircraft layout system. A drawback to a series architecture is that the electric motor must be sized based on the capability to provide the maximum power output the aircraft requires.
If so designed, the aircraft can operate fully electric using the battery pack, turning the ICE off, operating at its maximum efficiency point, leading to improved fuel efficiency and lower carbon emissions compared to other configurations.
2.1.2. Parallel Architecture
The parallel architecture comprises a turboshaft engine, a battery pack, an inverter, and an electric motor, as shown in the simplified diagram in Figure 4. Fuel is used to power a turboshaft engine, and batteries are used to power an electric motor. Both turboshaft engine and electric motor power the drive train coupled to the propellers.
Good performance is possible, in this case, because the power is generated with both engines [14]. Different control strategies are used in a preferred approach. If the power required by the transmission is higher than the output power of the turboshaft engine, the electric motor is turned on so that both engines can supply power to the transmission. If the power required by the transmission is less than the output power of the ICE, the remaining power is used to charge the battery pack [8]. Moreover, mechanical and electric power could be decoupled, and the system has a high operating flexibility enabling three modes of operation: purely combustion; purely electric and hybrid.
On the other hand, Miller comes up with other similar definitions, but in a different perspective. He splits the parallel hybrid-electric systems into three major types: mild, power-assist, and dual-mode [16]. The types are nominally classified based on the sizing and participation of the electric motor. In the mild system, for example, the electric motor is relatively small and it is used to aid in acceleration and utilizes excess power to recharge the batteries. The power-assist parallel system uses a larger electric-motor and a more substantial battery pack, what warrants a modest downsizing of the engine. Likewise, the dual-mode parallel system utilizes a yet even larger electric motor and larger energy storage bank (battery). In other words, the higher the participation of the electric-motor and the battery pack, the lower the turboshaft engine sizing.
3.2. Aircraft Design Theory
According to the convention commonly used by several manufacturers, and presented by Raymer [20], the aircraft development process is composed of the following sequential phases presented in Figure 5:
Figure 5 - Aircraft development process chart. Source: Adapted [19].
Phase 0 - Feasibility Study
The development of a new aircraft begins by defining the main flight requirements, e.g., range, payload, passenger capacity, cruise speed and service ceiling, which are defined through several analyzes of market, operators, buyers, and competitors. Next, a technical, economic and commercial feasibility study is made.
Phase 1 - Conceptual Design
In this phase, geometric and performance estimates are made for the aircraft through graphs, tables and analyzes of historical trends. But, throughout the conceptual design, new ideas and problems emerge as the project goes into details, making the process iterative, i.e., values are recalculated with each analysis.
performance ratios (thrust-to-weight ratio and wing loading), control surfaces, ending with all dimensions of the aircraft.
Usually, aircraft commonality strategy is also evaluated within the conceptual design, which allows different models of the same family to have common characteristics, as well as other advantages such as reducing the development time of new aircraft, sharing production and maintenance tools and reduction of aircraft certification time.
Phase 2 - Preliminary Design
The preliminary design of the aircraft initially involves the aerodynamic and structural design and the systems integration project. At the beginning of this stage, although the structural calculation has not yet been carried out, concepts regarding the materials to be used are already defined such as the use of aluminum and/or composite materials.
In this phase, the predominant loads in the structure are defined and the stability and control criteria of the aircraft are evaluated. In addition, wind tunnel tests are performed to determine loads, stresses and also engine integration parameters, considering the chosen motor-propulsion group.
One of the most important stages of aircraft development occurs during the preliminary design, which is the "freezing" of the aircraft configuration, i.e., from that point on the design and the propulsion system do not change anymore (it can even change, but it compromises the project).
Phase 3 - Detailed Design
In this phase, 2D drawings are made for the fabrication of the parts of the aircraft structure, and the 3D drawings for the assembly, including the structure along with the components and systems. The drawings and specifications involve the complete structures detailing, manufacturing materials, manufacturing tolerances, type of heat treatment, surface finish and applicable standards. The production tooling and assembly plan are elaborated, together with the construction of the flight simulators (iron birds) and the prototype aircraft.
Parallel to the functional tests, the flight test campaigns can be carried out with the prototype aircraft for qualification and certification. In some projects, some prototypes never fly; they are only used for static ground testing.
Figure 7 – Structural fatigue test in the fuselage. Source: Aviation Week2.
At the end of the detailed design phase, after completing the entire flight test campaign for aircraft certification, the aeronautical authorities shall issue the type certificate, authorizing their operation.
Phase 4 - Entry Into Service & Production
With the conclusion of the detailed design and certification of the aircraft by the aeronautical authorities, the marketing phase begins, marked by its first delivery. Usually the company that receives the first aircraft had already been defined during the detailed design, when the orders and the purchase options began.
As aircraft are sold, new ones are delivered, and new purchase orders are made. In addition, the companies can also place purchase options order requests, which do not formalize the application, only demonstrate their intention to acquire more aircraft.
The purchase options are a vital part of the trading process. They show trends that allow the manufacturers to be prepared for a significant increase or decrease in their production.
Phase 5 - Operating Life & Phase Out
During the detailed design phase, an aircraft usage expectation is defined, called airplane useful life (or airplane service life). The life of the aircraft can be defined by their age, the number of hours flown, the number of operating cycles or even technical or operational unfeasibility.
Concerning technical unfeasibility, the current environmental legislations which differ from the legislations of the project year, limiting or prohibiting the use of motors with high noise levels and emissions of pollutants.
Regarding the operational unfeasibility, there are high operating costs associated with the high fuel consumption of old engines, maintenance costs of old aircraft, and airport taxes for engines with high noise level.
CHAPTER III
AIAA DESIGN REQUIREMENTS AND PROPOSALS
“It always seems impossible until it's done.” Nelson Mandela
The aircraft designed in this work is a hybrid-electric aircraft whose design requirements were determined through a Request for Proposal (RFP) published by the committees of the annual design competition sponsored by The American Institute of Aeronautics and Astronautics (AIAA)3.
Founded in 1963, the AIAA is a professional society for the field of aerospace engineering. It has earned an international reputation for being responsible for organizing and hosting the aerospace industry’s most important conferences and events, where aerospace professionals exchange information, present findings, publish papers, and collaborate with each other [22].
Every year, the AIAA sponsors several design competitions, which offer an opportunity for students to participate in a simulated real-world problem, designing an aircraft, engine, or
solving other task determined by the committees. Thus, the AIAA Technical Committees elaborate a Request for Proposal (RFP) and launch it on public so that students (graduate and undergraduate) from different places in the world get involved.
For the year 2017-2018, the RFP is for the design of two-member Hybrid-Electric General Aviation Aircraft family, one for 4 passengers and another one for 6 passengers. The year entry-into-service (YEIS) is 2028 for a 4-seat model with 1000 nmi of range and 2030 for the 6-seat model with 750 nmi of range. The intent is to have energy storage for takeoff, climb, go-around and emergencies via batteries and electric motors with an engine providing additional power and/or direct propulsion [23]. Moreover, the airframe and propulsion system commonality, by weight, between the 4-seat and 6-seat variant should be 75% or greater of the 4-seater’s empty weight.
The other requirements [23] are presented in Tables 1, 2 and 3.
Table 1 - AIAA general requirements.
General Requirements
Capable of taking off and landing from different runways (dirt, grass, metal mat, gravel, asphalt, and concrete)
Minimum cruise speed of 174 knots Target cruise speed: 200 knots or greater
Capable of VFR and IFR flight with an autopilot Capable of flight in known icing conditions
Meets applicable certification rules in FAA 14 CFR Part 23 Use of engine(s) that will be in service by 2028
Use of electric motor(s) that will be in service by 2028 and document battery energy and power density assumptions based on reasonable technology trends
Show airframe and propulsion system commonality of at least 75% between the 4-seater and 6-seater by weight
Show the emergency range to get to an alternate airport at the maximum feasible weight from an engine failure at 5000 ft AGL (ISA + 18 deg F) with electric power from batteries alone for both the 4- and 6-seat variants
Table 2 - AIAA requirements for the aircraft of 4 passengers.
4-Se
at Var
iant Mission Req
uirements
Crew: 1 pilot 3 passengers
Passenger/pilot weight of 190 lb
Baggage weight per passenger/passenger of 30 lb and volume of at least 4 cubic feet per passenger
1000 nmi design range mission with IFR reserves
Maximum takeoff and landing field lengths of 1,500’ over a 50’ obstacle to a runway with dry pavement (sea level ISA + 18oF day)
Takeoff, and landing performance should also be shown at 5,000’ above mean sea level (ISA + 18oF) as well as for grass & concrete fields at sea level (ISA+18oF)
Initial climb rate at sea level (ISA+ 18oF) at least 1500 fpm with both electric and fossil fuel propulsion operating
Meet 14 CFR 23.67 Climb: One engine inoperative requirements with either propulsion type inoperative if it will be treated as a twin-engine airplane
Table 3 - AIAA requirements for the aircraft of 6 passengers.
6-Seat Variant Mission Requirements
Crew: 1 pilot 5 passengers
Passenger/pilot weight of 190 lb
Baggage weight per passenger/pilot of 30 lb and volume of at least 4 cubic feet per passenger
750 nmi design range mission with IFR reserves
Maximum takeoff and landing field lengths of 1,800 ft over a 50 ft obstacle to a runway with dry pavement (sea level ISA + 18oF day)
Takeoff, and landing performance should also be shown at 5,000 ft above mean sea level (ISA + 18 deg F) as well as for grass & concrete fields at sea level (ISA + 18 deg F) Initial climb rate at sea level (ISA + 18 deg F) at least 1300 fpm with both electric and fossil fuel propulsion operating
CHAPTER IV
CONCEPTUAL DESIGN OF HYBRID-ELECTRIC AIRCRAFT
“Science is about knowing; engineering is about doing.”
Henry Petroski
This work deals with the design of two hybrid-electric aircraft: one for four passengers (4PAX) and the other for six passengers (6PAX). Both aircraft are expected to have 75% or greater of communality. Therefore, the first aircraft to be designed was the 4PAX one, since the AIAA specifications require shorter field lengths for takeoff and landing, a higher rate of climb and a more significant range. Thus, after having that aircraft in hands, it is easier to adapt it to the 6PAX configuration, changing the empennage, but keeping the same wing.
4.1 Initial Design Estimate
First of all, in the conceptual design of the aircraft, several trend tables were used to obtain some initial estimates. But for that, it was necessary to assign some initial configurations to the aircraft. Thus, four main configurations were assumed: engine with T-tail, twin-engine with conventional tail, single-twin-engine with T-tail, and single-twin-engine with conventional tail.
The algorithm used to estimate the design of the aforementioned aircraft considers several coefficients and characteristic values of conventional aircraft presented in historical tables present in the literatures [24,25,26,27,28,29]. Most of them are represented by a function defined by:
, ,0
0cf a W c aW (4)
where f a W c
, ,0
represents the characteristic to be calculated such as wetted area
Swet , a and c are constants that depend on the type of aircraft under analysis, and W0 is the grossweight estimate of the aircraft, which is iterated throughout the project.
Figure 8 - First iteration for aircraft gross weight estimate. Source: Venson [26].
Hence, the values used as respective inputs for each aircraft in the algorithm are presented in Table 4. It is worth remembering that these values come from historical tables mentioned above.
Table 4 - Algorithm inputs for each aircraft configuration.
Twin-engine aircraft with T-tail Twin-engine aircraft with conventional tail Single engine aircraft with T-tail Single engine aircraft with conventional tail W
AR 7.8 7.8 7.2 7.2
W
0.75 0.75 0.75 0.75
W
[°] 22 22 22 22
w
e 0.82 0.82 0.83 0.83
max
L
C 1.7 1.7 1.7 1.7
HT
AR 4.4 4.3 4.1 39
HT
0.5 0.5 0.5 0.5
HT
V 0.96 0.84 0.60 0.45
VT
AR 1.0 1.4 1.2 1.5
VT
0.4 0.4 0.5 0.5
VT
V 0.071 0.050 0.030 0.030
wet S
a 0.2933 0.2933 0.6762 0.6762
wet S
c 0.5632 0.5632 0.4884 0.4884
0
W
a 766 0. 766 0.892 0.892
0
W
c -0.20 -0.020 -0.047 -0.047
W S
a 1.512 1.512 0.408 0.408
W S
c 0.664 0.664 0.804 0.804
T
a 0.0116 0.0116 0.0116 0.0116
T
c 0.4789 0.4789 0.4789 0.4789
Ref
Wet
S S 4.0 4.0 4.5 4.5
fe
C 0.055 0.055 0.055 0.055
1 0
W W 0.984 0.984 0.990 0.990
2 1
W W 0.990 0.990 0.992 0.992
4 3
W W 0.992 0.992 0.993 0.993
6 5
TO D
a 9.68 9.68 8.23 8.23
LND D
a 1.463 1.463 1.524 1.524
fuselage
a 0.4088 0.4088 0.4088 0.4088
fuselage
c 0.3140 0.3140 0.3140 0.3140
L
x d 8.3 8.3 8.3 8.3
N
x d 1.3 1.3 1.3 1.3
C
x d 0.56 0.56 0.56 0.56
T
x d 2.3 2.3 2.3 2.3
x
R 0.34 0.34 0.25 0.25
y
R 0.38 0.38 0.38 0.38
z
R 0.39 0.39 0.39 0.39
clean L
C 1.6 1.6 1.5 1.5
TO L
C 1.9 1.9 1.8 1.8
LND L
C 2.3 2.3 2.0 2.0
Aileron wing
Ratio 0.05 0.05 0.07 0.07
Elevator Tail
Ratio 0.44 0.44 0.41 0.41
Rudder Tail
Ratio 0.38 0.38 0.36 0.36
Main gear at
mac 0.52 0.52 0.50 0.50
Nose gear at
length 0.17 0.17 0.13 0.13
Inner engine
span 0.34 0.34 0.30 0.30
Besides the inputs from Table 4, the algorithm needed an engine to be considered during the performance analysis.
Figure 10 – Electric motor SP260D (on the left) and Siemens Extra 330LE (on the right). Source: Endless Sphere4.
Thus, after running the algorithm, it was released the following outputs for each aircraft, shown in Table 5.
Table 5 - Algorithm outputs for each aircraft configuration.
Twin-engine aircraft with T-tail Twin-engine aircraft with conventional tail Single engine aircraft with T-tail Single engine aircraft with conventional tail
MTOW [kg] 1880.10 1880.10 1466.20 1466.20
Fuel Weight
[kg] 297.60 297.60 233.07 233.07
Empty Weight
[kg] 1183.30 1183.30 833.97 833.97
Payload Weight
[kg] 399.20 399.20 399.20 399.20
Structural
Weight [kg] 487.97 487.19 433.03 433.14
W
b [m] 11.83 11.83 10.74 10.74
W r
c [m] 1.73 1.73 1.70 1.70
W mac
c [m] 1.53 1.53 1.50 1.50
w mac
y [m] 2.82 2.82 2.56 2.56
w
S [m2] 17.94 17.94 16.01 16.01
cruise L
C 0.26 0.26 0.22 0.22
0
CD 0.02 0.02 0.02 0.02
2
k 0.05 0.05 0.05 0.05
w
x [m] 2.65 2.72 3.21 3.10
Service Ceiling
[ft] 12000.00 12000.00 12000.00 12000.00
Mach (cruise) 0.28 0.28 0.28 0.28
stall
V [m/s] 31.96 31.96 29.88 29.88
1 0
W W 0.98 0.98 0.99 0.99
2 1
W W 0.99 0.99 0.99 0.99
3 2
W W 0.89 0.89 0.89 0.89
4 3
W W 0.99 0.99 0.99 0.99
5 4
W W 0.98 0.98 0.98 0.98
6 5
W W 0.99 0.99 0.99 0.99
Take-off
Distance [m] 268.05 268.05 290.45 290.45
Landing
Distance [m] 747.39 747.39 680.47 680.47
Range [km] 1228.00 1228.00 1094.60 1094.60
ROC [ft/min] 2483.90 2483.90 1377.20 1377.20
fuselage
l [m] 8.52 8.52 8.52 8.52
fuselage
d [m] 1.70 1.70 1.70 1.70
HT
S [m2] 7.71 6.75 3.53 3.53
HT r
c [m] 1.77 1.67 1.16 1.31
HT
b [m] 5.83 5.39 3.80 3.71
HT mac
c [m] 1.37 1.30 0.95 1.00
HT
x [m] 6.75 6.85 7.36 7.21
VT
S [m2] 4.42 3.11 1.51 1.51
VT r
c [m] 3.00 2.13 1.58 1.39
VT
b [m] 2.10 2.09 0.87 0.87
VT mac
c [m] 2.23 1.58 1.74 1.76
VT
x [m] 5.52 6.39 6.94 7.13
.
Landing gear
x [m] 4.43 4.43 4.26 4.26
engine
xx
I [kg∙m2] 7602.20 7602.20 2640.20 2640.20
yy
I [kg∙m2] 4926.80 4926.80 3842.30 3842.30
zz
I [kg∙m2] 393790.00 393790.00 213500.00 213500.00
CG
x (empty
aircraft) [m] 3.81 3.82 4.15 4.14
CG
x (loaded
aircraft) [m] 3.67 3.68 3.89 3.88
Sale Price
[US$] 1062300.00 1061200.00 893590.00 893750.00
Operating Costs per Year
[US$/year] 35092.00 35092.00 33082.00 33082.00
Operating Costs per Hour
[US$/hr] 116.97 116.97 116.74 116.74
Thus, gathering the results from Table 5, the following aircraft configurations were obtained and are presented in Figure 11.
Figure 11 – Sketch of the 4 aircraft released by the initial concept design estimate: (a) twin-engine with T-tail, (b) twin-twin-engine with conventional tail, (c) single twin-engine with T-tail, (d)
single engine with conventional tail.
(a) (b)
Analyzing the AIAA design requirements with the results from Table 5, the aircraft that best satisfies the specifications are the single engine aircraft, either with conventional or T-tail. In both cases, the single engine provides sufficient power for the aircraft to fly and reaches the required performance. So, it was easy to choose only one engine. But for the tail, it goes beyond that.
The design of an empennage for any aircraft is extremely important, since it affects the aircraft mass and center of gravity, i.e., the static and dynamic stability. Then, it is necessary to considerer the effects of both empennages arrangement.
The conventional tail provides appropriate stability and control, and also leads to the most lightweight construction in most cases, so much so that approximately 70% of aircraft are fitted with it [31]. Moreover, for this configuration, the stabilizer trim is relatively less complex and the vertical tail is usually larger. However, engines cannot be coupled to the rear of the aircraft, what is useful for static stability. Furthermore, spin characteristics can be bad in the case of conventional tail due to the blanketing of the vertical tail, in addition to the downwash of the wing being relatively large in the area of the horizontal tail.
On the other hand, the T-tail is heavier than the conventional tail because the vertical tail has to support the horizontal tail. However, the T-tail has advantages that partly compensate this important disadvantage (weight). Because of the end plate effect, the vertical tail can be smaller. In addition, the horizontal tail is more effective because it is positioned out of the airflow behind the wing and is subjected to less downwash. Therefore, it can be smaller. For the same reason, the horizontal tail is also subject to less tail buffeting. As the T-tail creates space at aircraft’s rear, there is enough space to fix the engines, improving static stability.
Hence, since the aircraft is going to have a lightweight engine at the nose, considering the information above and aiming an easier structural analysis, the conventional empennage was chosen for this aircraft design.
4.2 Hybrid-Electric Aircraft Design
Several papers indicate the parallel architecture as the most appropriate arrangement for large aircraft due to the lower weight associated, since the batteries only feed an electric generator, which helps the main shaft of a turbojet engine, for example. However, the aircraft designed here will be small, carrying four and six passengers, what makes the architecture simpler. Therefore, the series-architecture was chosen for the aircraft, since the engine is already an electric-motor, requiring only electric power to move it. Figure 12 depicts the propulsion system architecture proposed.
Figure 12 - Series-architecture used in both 4PAX and 6 PAX aircraft.
Table 6 - Efficiencies for the hybrid-electric propulsive system.
Efficiency Value
bat
90%[35]
inv
95%[36]
wiring
97%[37]
cont
99%[38]
eng
60%[39]
generator
95%[40]
em
95%[40]
prop
85%[41]
Now it is necessary to come up with the new performance analysis. First, the classic Bréguet’s range is formulated for a conventional fuel powered aircraft at zero wind conditions, and thrust vector parallel to the airspeed vector, which defines the following:
1 start final W L T D W C V R dW
c C W
(5)where cTmeans the specific fuel consumption.
The solution to the integral depends on the flying strategy used (e.g., gradual climb at a constant airspeed and angle of attack) and the models used to represent the propulsion system and the aerodynamic characteristics. Solutions to the most common flying strategies can be found in many standard textbooks on aircraft performance. But, fundamentally, these solutions use the idea that weight changes gradually throughout the flight. Therefore, the range equation cannot be applied to the hybrid aircraft to be designed here, which uses an electric system (batteries) as energy supply.
Thus, Voskuijl presents in [32] a new formulation for the range equation relating the energy stored to the consumption of a hybrid aircraft with parallel architecture. Since the architecture of both aircraft under analysis here is going to be in series, the formulation is reevaluated for the scheme available in Figure 12, which is presented in the sequence.
Fundamentally, the range can be determined by integrating speed over time:
final
start t
t
The energy stored in batteries and fuel can be related to the time to solve this. As times goes by, the energy stored in the batteries or as fuel reduces. The power (energy per second) consumed by the aircraft over the time can be expressed using both variation in time:
fuel bat
dE dE
dE
dt dt dt (7)
Analyzing the first addend, the time rate of change of the energy stored in the fuel can be related to the fuel flow and the energy density of the fuel. Furthermore, the shaft power delivered by the turboshaft engine is related to the fuel flow through the power-specific fuel consumption.
fuel fuel
f
fuel
dW g dE
Q
dt H dt
(8)
f p eng
Q c P (9)
The power provided by the internal combustion engine (Peng) can be specified in terms of its participation in the total aircraft power required, degree of hybridization and the respective efficiencies:
1
a enggenerator cont em prop
P
P S
(10)
Thus, the time rate of energy stored in fuel can be expressed as a function of the aircraft power available:
1
fuel p fuel
a generator cont em prop
dE c H
S P
dt g (11)
Analyzing the second addend along the same lines, the time rate of energy stored in the batteries can be expressed in terms of the power available:
bat
a inv wiring cont em prop
dE S P
dt (12)
Combining both Eqs. 11 and 12, an equation for the change of total energy in time is presented:
1
p fuel
a generator cont em prop inv wiring cont em prop
c H
dE S S P
dt g
In quasi-steady and quasi-rectilinear flight, the thrust must equal drag and lift equal weight. Assuming the thrust vector is parallel to the airspeed vector, the following relation is obtained:
D a
L C
P TV DV WV
C
(14)
Now the basic range equation for hybrid-electric cruise flight can be created by combining Eqs. 6, 13 and 14.
1 1 1 start final E L DE p fuel
generator cont em prop inv wiring cont em prop C
R dt
C W
c H S S
g
(15)It is assumed that the power split and angle of attack are kept constant throughout the cruise flight. Furthermore, for the range of flight speeds and altitudes of interest, the power-specific fuel consumption and all efficiencies are considered constant.
In case of a flight at constant airspeed, this results in a gradual climb. Since the fuel consumption is lower than for conventional aircraft, the weight variation is lower, resulting in a “less steep” climb. If it were to consider a full electric aircraft, there would not be climb, because there is no weight variation, allowing a horizontal flight profile.
In Eq. 15, the aircraft weight is the sum of the following components: empty payload battery fuel
W W W W W (16)
Rewriting the Wbattery and Wfuel in terms of energy based on their respective energy densities, it is obtained:
batttery fuel fuel batttery empty payload
batttery fuel
E H E H
W W W g
H H
(17)
Inserting the degree of hybridization in terms of energy (Section 2.1), and relating the participation of the batteries and the fuel in the total aircraft energy, it comes:
1
fuel batttery empty payloadbatttery fuel
H H
W W W gE
H H
(18)
1 1 1 lncont em prop L batttery fuel
D fuel batttery p fuel
generator inv wiring
fuel batttery
start empty payload batttery fuel
empty payload
H H
C R
C H H
c H S
g S
g
H H
gE W W
H H W W (19)
4.3. Design Assumptions
Before finishing the concept design, some aspects were added and settled for the development of both aircraft (4PAX and 6PAX), such as: typical aircraft mission profile, the batteries and an internal combustion engine (ICE) for the hybrid system.
4.3.1. Typical Aircraft Mission Profile
Based on historical data, FAR – Part 23 and AIAA specifications, some mission characteristics were chosen and are presented in Table 7. The flight level FL120 was chosen to avoid any pressurization issues, since the regulation 14 CFR 91 requires supplemental oxygen system for aircraft flying over FL120.


![Figure 8 - First iteration for aircraft gross weight estimate. Source: Venson [26].](https://thumb-eu.123doks.com/thumbv2/123dok_br/16837034.752363/43.892.133.764.123.575/figure-iteration-aircraft-gross-weight-estimate-source-venson.webp)


![Table 6 - Efficiencies for the hybrid-electric propulsive system. Efficiency Value bat 90% [35] inv 95% [36] wiring 97% [37] cont 99% [38] eng 60% [39] generator 95% [40] em 95% [40] prop 85% [41]](https://thumb-eu.123doks.com/thumbv2/123dok_br/16837034.752363/51.892.310.588.147.481/table-efficiencies-hybrid-electric-propulsive-efficiency-value-generator.webp)