Carlos Pestana Barros & Nicolas Peypoch
A Comparative Analysis of Productivity Change in Italian and
Portuguese Airports
WP 006/2007/DE
_________________________________________________________
Carlos Farinha & Isabel Andrade
The Age-Old Problem of Old Age Poverty in
Portugal
WP 27/2013/DE/CEMAPRE
_________________________________________________________
Department of Economics
WORKING PAPERS
ISSN Nº 0874-4548
School of Economics & Management
1
T
HE AGE
-
OLD PROBLEM OF OLD AGE POVERTY IN
P
ORTUGAL
Carlos Farinha Rodrigues
*Isabel Andrade
October 2013
*
ISEG (School of Economics and Management) / University of Lisbon
and CEMAPRE (the Centre for Applied Mathematics and Economics)
Rua Miguel Lupi 20 1249-078 Lisbon, Portugal
2
T
HE AGE
-
OLD PROBLEM OF OLD AGE POVERTY IN
P
ORTUGAL
Carlos Farinha Rodrigues
Isabel Andrade
Abstract
The Portuguese elderly poverty rate has decreased significantly in recent years as elderly incomes have increased, and inequality and material deprivation levels have converged to their national levels. This paper investigates whether this improved situation is widespread across the elderly, but concludes that it is heterogeneous with poverty pockets subsisting. In particular, the elderly aged 75+ and living alone record a poverty rate above 30% in 2010, implying that this group remains one of great economic and social vulnerability. An important feature of this heterogeneity is the difference between the higher average income of the younger elderly generations versus the older ones, with more than 16% of the elderly in the two highest deciles of the income distribution in 2010. The evolution of both contributive and means-tested pensions is a key element in the reduction in elderly poverty and in the improvement in their living standards. However, the austerity policies implemented post-2010 have made a strong impact on pensions and can reverse this recent evolution.
3
THE
AGE-OLD
PROBLEM
OF
OLD
AGE
POVERTY
IN
PORTUGAL
11. Introduction
Poverty incidence amongst the elderly has been declining significantly in Portugal during the last decades: while the national poverty rate fell from about 23% in 1993 to 18% in 2010, the elderly poverty rate dropped from about 40% to 20% over the same period. However, this halving of the old age poverty rate conceals the heterogeneity of this age group where important clusters of deep poverty remain. Moreover, this reduction coincided with the increasing ageing of the Portuguese population with the ageing ratio reaching 121.6% in 2010.
A more detailed analysis shows deep differences across the successive generations of old age people in terms of disposable income and poverty, but also in terms of the composition of the households they live in, i.e., whether they live alone, with another elderly person(s) or with non-elderly relatives. In 2010, the most recent year for which data is available, it was the elderly aged 75+ years and living alone that recorded the highest poverty rate (33%). Gender is a more relevant factor than for the population as a whole: the elderly female poverty rate was higher (18.4%) than the male one (17.6%).The level of elderly inequality and material deprivation is slightly higher, but mostly follows the national average.
The profound crisis that afflicts the Portuguese economy since 2010 and led to the Troika agreement has only started affecting directly the income levels of the elderly population after 2011, and indeed more severely after 2012. The present study does not involve the post-2010 years due to data unavailability, and therefore cannot reflect the effect of the core austerity policies directed at the elderly. Nevertheless, the detailed analysis of the 2003-10 period shows the initial effects of the 2007 reform of the Social Security Law (“Lei de Bases da Segurança Social”), and of the introduction of the “Solidarity Supplement for the Elderly” (CSI) in 2006. The former had the stated aim of safeguarding the long-term sustainability of pensions through substantial changes in the replacement rules of the system. These changes led to less generous pensions and new rules about their rate of growth now linked to economic growth and life expectancy; early retirement is penalised and became harder to attain. However, these changes affect predominantly future pensioners, not the current ones, and the accelerating ageing of the Portuguese population has so far prevented the achievement of the expected cuts in expenditure. The latter, the CSI, is a
1
4 tested benefit that aims at closing the gap between the level of elderly income and the (national) poverty line. With 236 thousand beneficiaries in 2010, the CSI has clearly contributed to the significant reduction in elderly poverty in recent years, but its performance is far from its proclaimed ultimate aim of taking the elderly out of poverty.
The specific study of old age poverty and deprivation has been gaining importance with the fast increase in elderly population in most OECD countries at a time of crisis and growing pressure on resources. Some studies concentrate in country specifics like, for example, Albuquerque et al. (2010) in Portugal, Prunty (2007) in Ireland, Lindquist and Wadensjo (2012) in Sweden, Azziz et al. (2013) in New Zealand, whilst others compare across countries as Brown and Prus (2006) and Zaidi (2009) in OECD countries, and Goudswaard et al. (2012) and Zaidi (2010) in EU countries. Callan et al. (2011) simulate the effects of the austerity policies on both the elderly and the whole population.
The aim of this paper is to study in detail the age-old problem of old age poverty in Portugal, including the relationship between poverty, inequality and material deprivation, with particular attention given to pensions and other social policies, but also demographics patterns. The main data source is the micro-data from the European Union Statistics on Income and Living Conditions (EU-SILC) made available by INE-Statistics Portugal. The EU methodology for measuring and evaluating poverty and material deprivation is broadly followed in this paper: the key variable in the analysis of the living conditions of the elderly is the equivalised income obtained by correcting the household disposable income using the modified OECD scale; the poverty line is defined as 60% of the median adult equivalent income; and the material deprivation indicators are based on a set of nine items available in the EU-SILC database. The Eurostat indicators are supplemented by that of consistent poverty, which brings together poverty and material deprivation.
This paper is organised as follows: section 2 describes the Portuguese as an ageing, but less poor population; section 3 studies in detail Portuguese elderly poverty during the 2003-10 period including their income distribution; section 4 analyses its other dimension, material deprivation and section 5 summarises both in the study of elderly consistent poverty; finally section 6 concludes the paper and summarises its main conclusions.
2. An ageing, but less poor elderly population
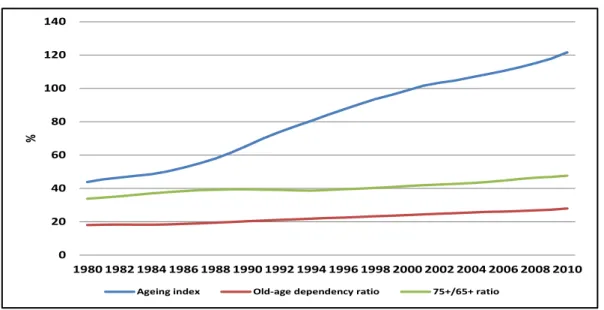
The swift ageing process of the Portuguese population is revealed in Figures 1 and 2 below2. In Figure 1 the ageing index of the Portuguese population rose quickly from around 45% at the start of the eighties to 90.5% in 1997. It crossed the 100% barrier in 2001, meaning that more Portuguese
2
5 are aged 65 and older (65+ here-after) than 15 and younger, and reached 121.6% in 2010. The old-age dependency ratio has grown steadily from about 18% in the eighties to 25.1% in 2003, and
27.9% in 2010. These results reflect the sharp decrease in the birth rate from 16.2‰ in 1980 to 9.6‰ in 2010, together with an almost unchanged mortality rate of around 10‰. Life expectancy (at birth) has thus risen from 71.1 years in 1980 (men: 67.8, women: 74.8) to 79.6 in 2010 (76.5 and 82.4, respectively). Moreover, the proportion of elderly aged 75+, the ‘older old’, in the total number of elderly has grown from 33.8% in 1980 to 38.8% in 1993, 42.7% in 2003, and 47.6% in 2010.
Figure 1: An ageing population, Portugal 1980-2010
Source: INE-Statistics Portugal.
Notes: Ageing index: (population aged 65+/population aged <15)*100; Old-age dependency ratio: (population aged 65+/population aged 15-64)*100; 75+/65+ ratio: (population aged 75+/population aged 65+)*100.
In Figure 2 the constrictive population pyramid of 2010 is superimposed on the 1980 pyramid, both defined in proportion of the total population. The most frequent age group in 1980, 5-9 years, became the most frequent 35-39 thirty years later in 2010, but was followed by a resounding decline in the proportion of younger age groups, a consequence of the aforementioned decrease in birth rates. Conversely, the proportion of elderly increased noticeably, particularly elderly women. In 2010, 21.0% of the Portuguese women were aged 65+, 10.7% 75+, and 2.8% 85+, compared to 13.0%, 4.3% and 0.8%, respectively, in 1980.
0 20 40 60 80 100 120 140
1980 1982 1984 1986 1988 1990 1992 1994 1996 1998 2000 2002 2004 2006 2008 2010
%
6 Figure 2: Population pyramids, Portugal 1980 and 2010
(in % of total population)
Source: INE-Statistics Portugal.
The mean equivalised income of the elderly converged to the national average in the second half of the noughties, as revealed in Figure 3, growing consistently from 83% of that average in 2004 to 94% in 2010. This steady rise is in marked contrast with the nineties, when that proportion followed a downward trend and finished the decade at 81% of the national average.
Figure 3: Mean and Median Elderly Equivalised Income as % of total population, Portugal 1994-2010
Source: INE-Statistics Portugal, ECHP 1995-2001 and EU-SILC 2004-2011. Authors’ calculations.
This increase in equivalised income is reflected in the decline of the elderly poverty rate shown in Figure 4 below, and at a much faster pace than the national rate (to 2008). The gap between the two rates decreased from about 15 percentage points in 1994 to two in 2010.
15 10 5 0 5 10
0 - 4 y 5 - 9 y 10 - 14 y 15 - 19 y 20 - 24 y 25 - 29 y 30 - 34 y 35 - 39 y 40 - 44 y 45 - 49 y 50 - 54 y 55 - 59 y 60 - 64 y 65 - 69 y 70 - 74 y 75 - 79 y 80 - 84 y 85+ y
2010 Female
2010 Male
1980 Female
1980 Male
60% 65% 70% 75% 80% 85% 90% 95% 100%
7 Figure 4: National and elderly Poverty rates, Portugal 1994-2010
Source: INE-Statistics Portugal, ECHP 1995-2001 and EU-SILC 2004-2011. Authors’ calculations.
Additionally, this fall in the elderly poverty rate led to a decrease in the proportion of Portuguese poor that are elderly: in 1994, 26% of the poor were elderly, but in 2010 it had decreased to 20%, an even more significant achievement at a time when the proportion of elderly in the total population had risen from 14% to 18%.
These results show a picture of an ageing population, but where the relative income of the elderly increased and their poverty rate decreased sharply, thus closing the gap with that of the whole population. The elderly poverty and its recent decrease will be investigated in detail in the next section.
3. Elderly Poverty
Data from the Portuguese component of EU-SILC for 2003-10 is used in this section to characterise the elderly population and investigate whether it is a homogeneous group.
The starting point of the analyses in Figure 5 is whether there are distinctions in the poverty rate between different generations of elderly.
8 Figure 5: Elderly Poverty rate, Portugal 2003-10
Source: INE-Statistics Portugal, EU-SILC 2004-2011. Authors’ calculations.
All elderly poverty rates follow a similar path over the 2003-10 period and converge to the national rate, but the rate of the older old (75+) is on average ten percentage points higher than that of the 65-74 group. The poverty rate of the latter is actually lower than the national rate since 2008, falling to 15% in 20103.
The concept of poverty intensity used in Figure 6 shows how poor the poor actually are, and
corresponds to the “relative at risk poverty gap” defined by Eurostat as the difference between the median equivalised disposable income of people below the risk-of-poverty threshold and the at-risk-of-poverty threshold, expressed as a percentage of the at-at-risk-of-poverty threshold. The poverty intensity thus defined is usually lower for the Portuguese elderly than for the population as a whole, as a consequence of specific social policy measures targeted at the old, like the social pension. Moreover, the decrease in the elderly poverty intensity from 18% to 11% in the period under analysis is greater than that of the whole population or the poor population. Unlike the poverty rate, the poverty intensity is rather homogeneous across the elderly generations.
3
The decrease in the elderly poverty rate in 2010, the initial year of austerity, is due to two factors: the fall in the nominal poverty line, the first time ever since poverty statistics exist in Portugal; and the very small exposure of elderly incomes to the 2010 austerity policies, particularly the lowest pensions.
0% 5% 10% 15% 20% 25% 30% 35% 40%
2003 2004 2005 2006 2007 2008 2009 2010
9 Figure 6: Elderly Poverty Intensity, Portugal 2003-10
Source: INE-Statistics Portugal, EU-SILC 2004-2011. Authors’ calculations.
Gender plays a growing role in elderly poverty, perhaps reflecting the higher female longevity discussed in section 2. In 2010, the elderly female poverty rate was about three percentage points higher than that of the elderly male for the same age groups, as seen in Figure 7.
Figure7: Elderly Poverty rate by age group and gender, Portugal 2003-10
Source: INE-Statistics Portugal, EU-SILC 2004-2011. Authors’ calculations.
Finally, an important factor in elderly poverty is the type of household, i.e., whether the elderly live alone, with their spouse (elderly or not), or within extended families. Six household types are
0% 5% 10% 15% 20% 25% 30%
2003 2004 2005 2006 2007 2008 2009 2010
Population 65 years or over From 65 to 74 years 75 years or over
0% 5% 10% 15% 20% 25% 30% 35% 40%
2003 2004 2005 2006 2007 2008 2009 2010
75 years or over-Males 75 years or over-Females
10 considered in Figure 8: two of elderly living alone (‘one person family aged 65-74’ and ‘one person
family aged 75+’); two of couples where both spouses are elderly (‘couple both 75+’ and ‘other elderly couples’, i.e., both spouses are 65-74 or only one is and the other is 75+); and two that include non-elderly people (‘couples with one elderly person’, i.e., the spouse is non-elderly, and
‘other elderly persons’, i.e., the elderly live within an extended family). More than 30% of the elderly
belong in the latter group, but this proportion has been decreasing steadily4.
There is a marked reduction in all poverty rates between 2003 and 2010 in Figure 8, but not widespread enough to lead to a decrease in poverty incidence across all elderly groups to levels comparable to the national average. This reduction was most evident (above 40%) in two of the most vulnerable groups, 65-74 living alone and ‘couple both 75+’, plus ‘other elderly couples’. The other most vulnerable group, 75+ living alone, saw a much smaller reduction (19.8%), and as a result the almost identical poverty rates in 2003 of the two living alone groups became separated by about 9 percentage points in 2010 and a poverty rate of the 75+ of 33.1%. Actually, the least significant decrease was recorded in the ‘couple with a non-elderly spouse’ group, which had the second lowest rate in 2003, but was passed in 2010 by the mixed generation elderly couples.
Figure 8: Elderly Poverty rate by household type I, Portugal 2003 and 2010
Source: INE-Statistics Portugal, EU-SILC 2004 and 2011. Authors’ calculations.
Still, more than a quarter of the 75+ either living alone or as couples are poor, whereas living with non-elderly household members visibly reduces the risk of elderly poverty. This result can be biased
4
The decrease in the proportion of elderly living within extended households between 2003 and 2010 may have been reverted from 2011 as a result of the deepening economic crisis, since many young couples unable to fulfil their mortgage repayments have had to return to the old parental home.
0% 5% 10% 15% 20% 25% 30% 35% 40% 45% 50% One person family aged 75+
One person family aged
65-74
couple both 75+ other elderly couples
couple with one elderly person
other elderly persons
11 by the usage of the household equivalised income as proxy for the equivalised income of each individual member when many of the elderly live in households with non-elderly individuals (38 % of all the elderly in 2003 and 34% in 2010). This bias can be investigated by dividing the elderly into two
groups: ‘elderly in elderly households’, which comprises all the elderly living exclusively with other elderly individuals; and ‘elderly in other households’, which comprises all the elderly living in
households that also include non-elderly individuals. Therefore, the former group comprises the first four household types in Figure 8, and the latter comprises the last two.
Figure 9 shows that the poverty rate is influenced by these household arrangements. The poverty rate of the ‘elderly in other households’ is always below 20%, and less than 15% since 2008.
Conversely, the ‘elderly in elderly households’ rate is much higher, but its substantial drop from 36%
in 2003 to 23% in 2010 played a major role in reducing the elderly (average) poverty rate. Furthermore, the gap between the two rates decreased from 18 to 10 percentage points over this period.
Figure 9: Elderly Poverty rate by elderly household type II, Portugal 2003-10
Source: INE-Statistics Portugal, EU-SILC 2004-2011. Authors’ calculations.
The next stage of the analyses looks into the evolution of the levels and composition of the elderly household income and how they contribute to the changes in elderly poverty already detected. Figure 10 shows the considerable increase (14.1%) in the equivalised disposable income of the elderly over the 2003-10 period and its convergence with the national average. This increase is even
more pronounced for the ‘younger old’ (aged 65-74) which actually overtook the national average in
0% 5% 10% 15% 20% 25% 30% 35% 40%
2003 2004 2005 2006 2007 2008 2009 2010
12
2010 (10,549€ and 10,407€, respectively), than for the ‘older old’ (75+)5
. Nevertheless, the proportion of the latter increased from 80.2% of the national income to 86.3% over this period.
Figure 10: Elderly average equivalised Disposable Income, 2003-10, € per year, 2010 prices
Source: INE-Statistics Portugal, EU-SILC 2004-2011. Authors’ calculations.
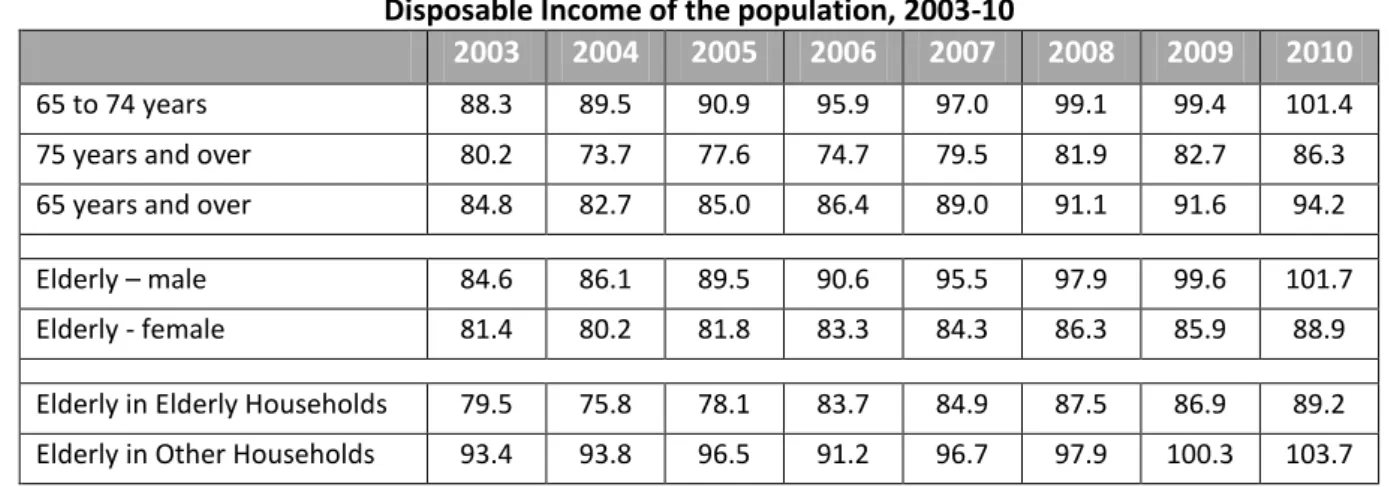
Another way of relating the standard of living of the elderly to that of the whole population is by comparing their equivalised disposable incomes. In Table 1, the income of the elderly corresponded to 84.8% of the national average in 2003, but its steady increase raised it to 94.2% in 2010. This increase was not uniform and gender is important: the income of those aged 65-74 and of elderly men actually surpassed the national average in 2010 (101.4% and 101.7%, respectively). It is the older old and the women that record lower, but steadily increasing, percentages.
5
However, it should be pointed out that pensions, unlike wages and social transfers, were not seriously affected by the austerity budget cuts up to 2010.
6000 6500 7000 7500 8000 8500 9000 9500 10000 10500 11000
2003 2004 2005 2006 2007 2008 2009 2010
13 Table 1: Equivalised Disposable Income of the elderly as % of Equivalised
Disposable Income of the population, 2003-10
2003 2004 2005 2006 2007 2008 2009 2010
65 to 74 years 88.3 89.5 90.9 95.9 97.0 99.1 99.4 101.4
75 years and over 80.2 73.7 77.6 74.7 79.5 81.9 82.7 86.3
65 years and over 84.8 82.7 85.0 86.4 89.0 91.1 91.6 94.2
Elderly – male 84.6 86.1 89.5 90.6 95.5 97.9 99.6 101.7
Elderly - female 81.4 80.2 81.8 83.3 84.3 86.3 85.9 88.9
Elderly in Elderly Households 79.5 75.8 78.1 83.7 84.9 87.5 86.9 89.2
Elderly in Other Households 93.4 93.8 96.5 91.2 96.7 97.9 100.3 103.7
Source:INE-Statistics Portugal, EU-SILC 2004-2011.Authors’ calculations.
It is also clear that living in households with non-elderly members improves the equivalised income of the elderly considerably, and it has improved in time to above the national average (103.7% in 2010).
A possible explanation for this relative improvement in elderly incomes as a whole is the stronger growth in pensions compared to the other components of disposable household incomes in this period, a possibility which is explored in Table 2. It compares the evolution in real terms of pensions earned by those aged 65+ and total disposable household income between 2003 and 2010. Household income rose up to 2004, and at a higher rate than pensions, but was significantly affected by the financial crisis, whereas pensions were still rising in 2010 to their highest level in the period.
Table 2: Evolution of disposable household income and pensions, 2003-10 (2003=100)
2003 2004 2005 2006 2007 2008 2009 2010
Disposable Income 100 103.0 101.1 112.0 112.2 109.2 109.8 106.4
Pensions 100 102.2 107.1 113.6 118.0 119.8 124.9 125.7
Source:INE-Statistics Portugal, EU-SILC 2004-2011.Authors’ calculations.
The main source of income of the elderly is naturally pensions6. The proportion of elderly in receipt of pensions, either contributive or (means-tested) social pensions, rose from 90.4% of their total number to 93.8% over this period. Likewise, the proportion of elderly whose main source of income
6
14 is pensions rose from 85.5% to 92.2%, but considerably more for the older old with 90.8% and 95.2%, respectively.
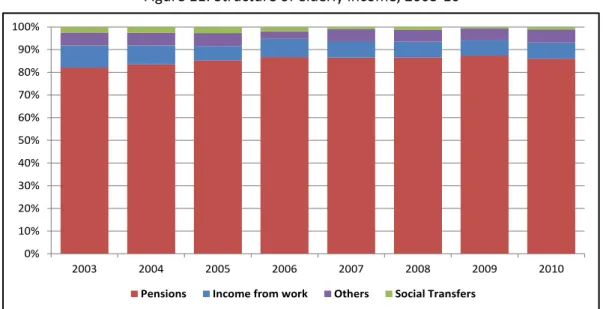
These results are confirmed in Figure 11, where pensions represent an overwhelming and growing portion of the income of the elderly, increasing from 82.1% in 2003 to 86.0% in 2010. Whereas wages still represent about 11% of the income of 65-74 throughout the period, pensions represent a hefty 89% of the 75+ income in 2010. The small (always under 3%) and decreasing proportion of
‘social transfers excluding pensions’ seems a paradox, but there are two likely explanations: the main financial provision to the elderly with no income, the means-tested social pension, is not differentiated in the SILC database, where it is included under the ‘old age and survival pensions’ heading; and the other social transfer, the CSI, whose number of beneficiaries increased from 174 to 236 thousand between 2007 and 2010, is clearly under-represented in the SILC possibly because many of the respondents see it as a pension and therefore include its amount under that heading.
Figure 11: Structure of elderly income, 2003-10
Source: INE-Statistics Portugal, EU-SILC 2004-2011. Authors’ calculations.
The consideration of Social Security macroeconomic data gives a new depth to the analysis of the relative increase in elderly income and changes in its level, plus the evolution of elderly poverty. The 2010 Social Security accounts reveal that the value of the monthly old-age contributive pension rose
from 351.1€ in 2003 to 477.03€ in 2010, a nominal increase of 35% and a real one of over 18%. It reflects both the higher number of contributive years taken into account in the pension awarding
process, and the higher average pension value of the ‘new’ pensioners. These factors largely explain
the difference between the poverty rates of the younger and older elderly described above.
0% 10% 20% 30% 40% 50% 60% 70% 80% 90% 100%
2003 2004 2005 2006 2007 2008 2009 2010
15 The monthly value of the social pension also increased substantially over this period: for those aged 65-69, it rose from 156.97€ to 207.06€, and for those aged 70+, it rose from 170.14€ to 224.58€, a nominal increase of 32% and a real one above 15% in either case. Its growing importance is reflected in the increasing of its weight in the total pension expenditure from 12.1% in 2003 to 14.5% in 2010. This rise in pensions, clearly at a higher rate than the national disposable income, is the prime factor of the significant decrease in the elderly poverty rate in Portugal.
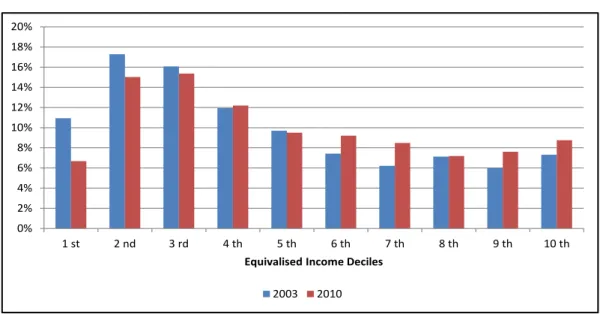
The general improvement in elderly income levels is reflected in their distribution by income deciles. In Figure 12 this distribution is compared between 2003 and 2010. The proportion of elderly in the two lowest deciles dropped from 28.2% to 21.7%, whereas their proportion in the two highest increased from 13.3% to 16.4%. This shift of the elderly towards the high end of the income distribution is a consequence of the improvements already discussed.
Figure 12: Elderly equivalised income by deciles, 2003 and 2010
Source: INE-Statistics Portugal, EU-SILC 2004 and 2011. Authors’ calculations.
Another way of investigating the heterogeneity of the elderly population is through the analysis of the inequality of their income distribution as measured by the Gini coefficient, which is particularly relevant due to the high levels of inequality recorded in Portugal7.
7
Rodrigues and Andrade (forthcoming) discuss in detail the high levels and steady reduction in inequality in Portugal between 2004 and 2009 and its increase in 2010.
0% 2% 4% 6% 8% 10% 12% 14% 16% 18% 20%
1 st 2 nd 3 rd 4 th 5 th 6 th 7 th 8 th 9 th 10 th
Equivalised Income Deciles
16 Figure 13: Gini, 2003-10
Source: INE-Statistics Portugal, EU-SILC 2004-2011. Authors’ calculations.
In 2003, the elderly income distribution was as unequal as that of the whole population, and by the end of the period their inequality was virtually identical (34.2 and 34.0, respectively), as shown in Figure 14. Instead of being a smaller and more homogeneous group, in fact, the elderly are as heterogeneous as the whole population.
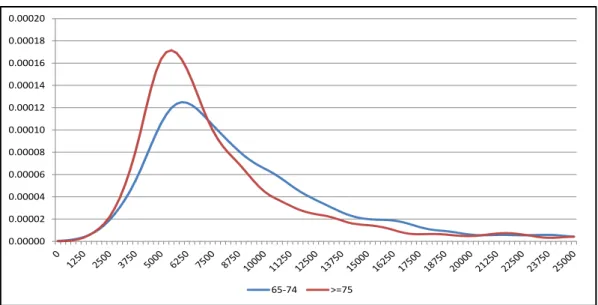
Finally, the estimation of density functions of the elderly income allows for a more comprehensive analysis of its evolution, as shown in Figure 15 for 2003 and 2010.
Figure 14: Density function of equivalised disposable elderly income, 2003 and 2010
Source: INE-Statistics Portugal, EU-SILC 2004 and 2011. Authors’ calculations.
The shift to the right of the (unimodal) density function between 2003 and 2010 is a clear indicator
of the improvement in the living conditions of the elderly. The ‘peak’ of the distribution increased in
31.0 32.0 33.0 34.0 35.0 36.0 37.0 38.0 39.0
2003 2004 2005 2006 2007 2008 2009 2010
Gini_Elderly Gini_Population
0.00000 0.00002 0.00004 0.00006 0.00008 0.00010 0.00012 0.00014 0.00016 0.00018
17 real terms by more than 1,000€/year. The estimated density functions also reveal the differences between the two generations of elderly in Figure 14 for 2010. The younger old enjoy higher incomes than the older old, particularly in the lower and central parts of the distribution, while the
differences are much less evident for incomes above 20,000€.
Figure 15: Density function of equivalised disposable elderly income, 2010
Source: INE-Statistics Portugal, EU-SILC 2004 and 2011. Authors’ calculations.
In the next section a broader definition of poverty, material deprivation, is used to analyse this age group within the Portuguese society.
4. Elderly Material Deprivation
The material dimension of poverty, or material deprivation, is defined as the inability to attain certain basic standards of living and consumption. It is widely agreed that being poor cannot be reduced to a lack of monetary resources, but also includes the inability to enjoy a minimum standard of living and participation in society. In order to implement these concepts, the EU has defined nine indicators of material deprivation (see Guio (2005, 2009) and Guio et al. (2009), for example). They include a wide range of items that are listed in detail in the first column of Table 3. Each figure in the table gives the percentage of ‘enforced lack’, i.e., the percentage of elderly individuals that would have liked to possess the item, but could not afford it, and therefore were deprived of it8.
8
These indicators distinguish between those who do not own items 6 to 9 due to lack of financial capacity and those who have no interest or necessity in them.
0.00000 0.00002 0.00004 0.00006 0.00008 0.00010 0.00012 0.00014 0.00016 0.00018 0.00020
18 Table 3: Deprivation Indicators (%), 2003 and 2010
All Population Elderly
2003 2010 2003 2010
I1. Inability to face unexpected financial expenses 19.5 29.0 25.9 26.9
I2. Inability to afford paying for one week annual holiday away
from home 60.7 57.1 70.7 63.8
I3. Arrears (mortgage or rent payments, utility bills or hire
purchase) 8.1 10.2 4.7 3.3
I4. Inability to afford a meal with meat, chicken or fish every
second day 4.4 3.1 6.6 3.9
I5. Inability to keep home adequately warm 36.3 26.7 46.8 30.4
I6. Enforced lack of a washing machine 3.5 1.5 9.1 3.6
I7. Enforced lack of a colour TV 1.1 0.4 2.8 0.8
I8. Enforced lack of a telephone 3.9 1.9 6.7 3.9
I9. Enforced lack of a personal car 12.0 9.2 14.8 10.5
Source: INE-Statistics Portugal, EU-SILC 2004 and 2011. Authors’ calculations.
The three items the elderly are mostly deprived of coincide with the national average9 and are in
decreasing order: “Inability to afford paying for one week annual holiday away from home”,
“Inability to keep home adequately warm”, and “Inability to face unexpected financial expenses”. Their deprivation decreased from 70.7% of the elderly in 2003 to 63.8% in 2010 for the first item and 46.8% to 30.4% for the second, with a slight increase for the third. The fourth most deprived item is
“Enforced lack of a personal car” (14.8% to 10.5%), whereas nationally it is generally “Arrears (mortgage or rent payments…)”. These reflect age circumstances to a certain extent, as probably the elderly have already paid their mortgages and, particularly the 75+, shouldn´t really be driving.
Age, gender, and household type do not affect significantly the ranking of the deprivation items10, illustrated in Table 4 for the two elderly generations, 65-74 and 75+. There was a substantial and widespread reduction in the enforced lack of all items for both groups between 2003 and 2010, except in the third highest, “Inability to face unexpected financial expenses”.
9
See Rodrigues and Andrade (2012) for a detailed analysis and discussion of material deprivation in Portugal in 2007.
10 Nevertheless, female material deprivation is normally higher than male deprivation, “Arrears…”
19 Table 4: Elderly Deprivation Indicators (%), 2003 and 2010
65 to 74 years 75 years or over
2003 2010 2003 2010
I1. Inability to face unexpected financial expenses 23.4 25.0 29.4 29.1
I2. Inability to afford paying for one week annual holiday away
from home 68.3 61.8 73.9 65.9
I3. Arrears (mortgage or rent payments, utility bills or hire
purchase) 4.5 4.2 4.9 2.3
I4. Inability to afford a meal with meat, chicken or fish every
second day 6.4 3.1 6.8 4.8
I5. Inability to keep home adequately warm 44.6 29.3 49.8 31.6
I6. Enforced lack of a washing machine 7.1 1.8 11.7 5.5
I7. Enforced lack of a colour TV 2.3 0.7 3.4 1.0
I8. Enforced lack of a telephone 4.9 2.7 9.1 5.2
I9. Enforced lack of a personal car 15.9 9.7 13.2 11.5
Source: INE-Statistics Portugal, EU-SILC 2004 and 2011. Authors’ calculations.
20 Figure 16: Material Deprivation, 2003-10
Source: INE-Statistics Portugal, EU-SILC 2004-2011. Authors’ calculations.
The intensity of the elderly material deprivation is given in Table 4. On average, the elderly were deprived of 1.88 items in 2003, well above the national 1.49, but by 2010 it had dropped to 1.47 compared to the national 1.39, reflecting the already discussed convergence. However, if poverty risk is taken into account, this drop becomes much more significant: the elderly poor were deprived on average of 2.68 items to the 2.50 national poor in 2003, but by 2010 the national average had hardly changed, whereas the elderly average had dropped to 2.29. Actually, it was the non-poor elderly that recorded the highest drop in deprivation rates over this period (22.9% to 16.0%) followed by the elderly poor (51.3% to 42.7%), whilst the national, non-poor and poor, rates hardly changed.
Table 4: Privation Indicators, 2003 and 2010
No Poor Poor All
2003 2010 2003 2010 2003 2010
All Population
Privation Rate 15.7 15.4 45.0 45.8 21.7 20.9
Privation Intensity 1.24 1.16 2.5 2.45 1.49 1.39
Elderly
Privation Rate 22.9 16.0 51.3 42.7 31.1 21.3
Privation Intensity 1.55 1.27 2.68 2.29 1.88 1.47
Source: INE-Statistics Portugal, EU-SILC 2004 and 2011. Authors’ calculations.
21 extended family, record smaller reductions, echoing the smaller reduction in the national than the elderly deprivation rate already discussed. Couples are the less deprived households, and their deprivation drops the younger the spouse is.
Figure 17: Material deprivation by age and household type, 2003 and 2010
Source: INE-Statistics Portugal, EU-SILC 2004 and 2011. Authors’ calculations.
5. Elderly Consistent Poverty
Individuals that are both poor and materially deprived are identified as consistently poor (Whelan and Nolan (2006)). The reduction in both elderly poverty and material deprivation in the period under analysis has led to the reduction in the proportion of elderly consistent poor as shown in Figure 18.
Whereas in 2003 14.9% of the elderly were consistently poor, in 2010 this rate had dropped to 8.5%, coming close to the national rate since 2008 and almost equalling it in 2010. Moreover, the 65-74 rate dropped below the national rate since 2008 (6.7% versus 8.1%). This 65-74 rate was far from matched by either the 75+ or elderly women rates: theirs decreased during this period, but in 2010 were still equal to 11.4%, and 13.0%, respectively, again revealing the heterogeneity of the elderly.
22 Figure 18: Consistent Poverty, 2003-2010
Source: INE-Statistics Portugal, EU-SILC 2004-2011. Authors’ calculations.
The reduction in consistent poverty can also be detected by household type in Figure 18, particularly in the three types identified as more at risk: elderly living alone and couples 75+. In 2010, all elderly not belonging to any of these three types had an almost identical lower rate of just over 5%, those living alone aged 65-74 and couples 75+ of about 11%, but living alone 75+ increased it to 17.4%. The sharpest and most remarkable reductions between 2003 and 2010 were in ‘other elderly couples’ (59.3%), 65-74 living alone (56.9%), and couples 75+ (54.0%). The most vulnerable group, 75+ alone, still saw a drop of 29.1%, but much smaller than that of the other lonely elderly.
Figure 18: Consistent Poverty, 2003 and 2010
Source: INE-Statistics Portugal, EU-SILC 2004 and 2011. Authors’ calculations. 0.000
0.020 0.040 0.060 0.080 0.100 0.120 0.140 0.160 0.180 0.200
2003 2004 2005 2006 2007 2008 2009 2010
Total 65 years or over From 65 to 74 years 75 years or over
0.00 0.05 0.10 0.15 0.20 0.25 0.30
One person family aged 75+
One person family aged
65-74
couple both 75+ other elderly couples
couple with one elderly person
other elderly persons
23 6. Conclusion
One of the clearest indicators of the social changes that occurred in Portugal over the last decades is the significant decrease in elderly poverty: between 2003 and 2010, the poverty incidence of the Portuguese aged 65+ dropped by 31% and their poverty incidence by 38%. Given the considerable percentage of elderly in the total population, this large decrease necessarily had an impact on the national poverty indicators.
This study establishes the heterogeneity of the elderly population in terms of poverty indicators: although their poverty rate as a whole fell, elderly poverty pockets subsist where this rate persists at disturbing high levels. In particular, the elderly aged 75+ and living alone record a poverty rate above 30% in 2010, implying that this group remains one of great economic and social vulnerability, and justifying the safeguarding, and even expansion, of the social measures that target it specifically.
An important feature of this heterogeneity is the difference between the higher average income of the younger elderly generations versus the older ones, a feature that needs to be taken into account in the design of social and economic policies aimed at the elderly in general. In fact, the analysis of the asymmetric elderly income distribution reveals that being old does not necessarily imply a low income or vulnerability: in 2010, more than 16% of the elderly were in the two highest deciles of that distribution. The high level of elderly inequality, which mirrors the national average, justifies the need for social and poverty targeting policies that privilege a means-tested approach, rather than a universal one.
The material deprivation indicators and the estimation of the consistent poverty rate enabled an in-depth identification of the more exposed elderly. Those living alone or in couples where both spouses are aged 75+ emerge as the most vulnerable, both in terms of monetary resources and of access to goods and services. However, the usage of a methodology (and indicators) common to all EU population instead of one designed specifically for the elderly and their needs has to be seen as a major limitation.
24 Finally, the continuing impoverishment and high unemployment rates of the Portuguese population are forcing many elderly to support financially their children and grandchildren who have been hit by the recession and unemployment. The improved living standards these elderly had secured for their retirement may now be lost as they are hit by the current crisis in a more convoluted way.
References
Albuquerque, P., Arcanjo,M., Nunes, F. and Pereirinha, J. (2010), “Retirement and the Poverty of the Elderly: The Case of Portugal”, Journal of Income Distribution, vol. 19(3-4), pp. 41-64.
Aziz, O., Gemmell, N., and Laws, A. (2013), “The distribution of income and fiscal incidence by age
and gender: Some evidence from New Zealand”, Victoria University of Wellington Working Papers in Public Finance 10/2013.
Brown, R.L. and Prus, S.G. (2006), “Income inequality over the later-life course: A comparative
analysis of seven OECD countries”, Annals of Actuarial Science 1, 307-317.
Callan, T., Leventi, C., et al. (2011), “The distributional effects of austerity measures: a comparison of six EU countries”, EUROMOD Working Papers EM6/11, Institute for Social and Economic Research, Colchester.
Carrilho, M.J. and Craveiro, M.L. (2013), “A situação demográfica recente em Portugal”, Revista de Estudos Demográficos, 50, 45-90, INE, Lisboa.
Goudswaard, K., van Vliet, O., Been, J. and Caminada, K. (2012), “Pensions and income inequality in
old age”, CESifo DICE Report, 4/2012, 21-26.
Guio, A-C. (2005), “Material Deprivation in the EU”, Statistics in Focus: Population and Social Conditions, 21/2005, Eurostat, Luxembourg.
Guio, A.C. (2009), “What can be learned from deprivation indicators in Europe?”, Luxembourg, Eurostat.
Guio, A-C., Fusco, A. and Marlier, E. (2009), “A European Union Approach to Material Deprivation using EU-SILC and Eurobarometer Data”, IRISS Working Paper 2009-19.
Lindquist, G.S. and Wadensjo, E. (2012), “Income distribution among those of 65 years and older in Sweden”, IZA DP No. 6745.
Prunty, M. (2007), “Older people in poverty in Ireland: An analysis of EU-SILC 2004”, Combat Poverty Agency Working Paper Series 07/02.
Rodrigues, C.F. and Andrade I. (2012), “Monetary Poverty, Material Deprivation and Consistent Poverty in Portugal”, Notas Económicas, 35, 19-39.
Rodrigues, C.F. and Andrade, I. (forthcoming), “Portugal: There and back again, an inequality’s tale.”
In Changing Inequalities and Societal Impacts in Rich Countries: Thirty Countries' Experiences, Nolan, B. et al. (eds.), Oxford University Press.
Whelan, C. T. et al. (2008), “Measuring Material Deprivation in the Enlarged EU”, Economic and Social Research Institute (ESRI), Working Paper 249.
Whelan, C. T., Nolan, B.T., et al. (2006), “Measuring Consistent Poverty in Ireland with EU SILC Data”, ESRI Working Paper 165, Economic and Social Research Institute, Dublin.
25
Zaidi, A. (2010), “Poverty risks for older people in EU countries – An update”, ECSWPR Policy Brief
January (11), 1-23.
Zaidi, A. (2011), “Exclusion from material resources among older people in EU countries: New