* Extracted from the monograph for the scientific initiation project: “Qualidade de Vida Relacionada à Saúde de pessoas com Diabetes Mellitus tipo 2 nos três níveis de atenção à Saúde”, Escola de Enfermagem de Ribeirão Preto, Universidade de São Paulo, 2015.
1 Universidade de São Paulo, Escola
de Enfermagem de Ribeirão Preto, Ribeirão Preto, SP, Brazil.
2 Universidade de São Paulo, Escola de
Enfermagem de Ribeirão Preto, Programa de Pós-Graduação em Enfermagem Fundamental, Ribeirão Preto, SP, Brazil.
3 Universidade de São Paulo, Escola de
Enfermagem de Ribeirão Preto, Departamento de Enfermagem Geral e Especializada, Ribeirão Preto, SP, São Paulo, Brazil.
ABSTRACT
Objective: To analyze the quality of life of people with type 2 diabetes mellitus in the three levels of the healthcare system. Method: A quantitative, cross-sectional and descriptive study carried out in primary, secondary and tertiary healthcare units with individuals in outpatient care. The validated Diabetes-39 instrument was used to evaluate quality of life. Results: The sample consisted of 53 people. There was a decreasing tendency in the quality of life impairment from the primary to the tertiary care levels. In the total sample, there were differences between domains of quality of life with the variables gender, insulin use and occupation, greater perception of quality of life impairment and disease severity in people with higher rates of glycated hemoglobin. Conclusion: Quality of life tends to worse as the disease worsens. The results suggest that quality of life is related to sociodemographic and clinical variables, therefore, these should be considered in the care.
DESCRIPTORS
Diabetes Mellitus, Type 2;Quality of Life;Nursing Care;Primary Health Care; Health Status.
Quality of life of people with diabetes mellitus*
Qualidade de vida das pessoas com diabetes mellitus Calidad de vida de las personas con diabetes mellitus
Isabela Fernandes de Aguiar Tonetto1, Marcelo Henrique Barbosa Baptista2, Danielle dos Santos Gomides2, Ana Emilia Pace3
How to cite this article:
Tonetto IFA, Baptista MHB, Gomides DS, Pace AE. Quality of life of people with diabetes mellitus. Rev Esc Enferm USP. 2019;53:e03424. DOI: http://dx.doi. org/10.1590/S1980-220X2018002803424
Received: 02/21/2018 Approved: 08/15/2018
Corresponding author:
Ana Emilia Pace
Avenida dos Bandeirantes, 3900, Bairro Monte Alegre
CEP 14040-902 – Ribeirão Preto, SP, Brazil aepace@eerp.usp.br
2
www.ee.usp.br/reeusp Quality of life of people with diabetes mellitusRev Esc Enferm USP · 2019;53:e03424
INTRODUCTION
In 2017, it was estimated that 425 million people worldwide had Diabetes Mellitus (DM), of which 79% lived in developing countries(1). Brazil ranked fourth among the 10 countries with
the highest number of cases of the disease(1), which affected
approximately 12.5 million people and was among the five main causes of death, responsible for more than 59 thousand deaths in the year 2015(2).
The chronic hyperglycemic state of DM is associated with complications such as cerebrovascular accident, cardiovascular disease, renal failure and chronic wounds(3), and with advancing
age the disease can compromise the Quality of Life (QoL)(4).
In the present study, the QoL construct will be highlighted due to its importance in caring for a person with DM, since quality of life can contribute to aggravating the disease or make it difficult to treat it. QoL is defined as a perception of the individual and their position in the context of the culture and value systems in which they live and in relation to their goals, expectations and concerns(5). Considering that QoL refers to
the perception of well-being, studies in this area can provide information for caring for people with DM and assist in plan-ning the treatment and care of this population(6).
The literature differentiates QoL from Health-Related Quality of Life (HRQoL), since the latter considers aspects of general health, physical functioning, physical symptoms and toxicity, emotional, cognitive, social and sexual functions, in addition to well-being and existential issues, which may influ-ence certain aspects of QoL behaviors and perceptions(7).
A cross-sectional study with 495 Germans with Type 2 Diabetes Mellitus (DM2) treated in the primary health unit showed low HRQoL among females, individuals with low education level, physical immobility, chronic pain, emotional distress related to DM and high body mass index, and pointed out that these characteristics of the sample were associated with HRQoL (p <0.05)(8).
Therefore, evaluating HRQoL at different stages of the disease may support a holistic approach to care, since changes in glucose metabolism may influence the HRQOL of these individuals(9).
A hierarchical and decentralized context of the Unified Health System (Portuguese acronym: SUS – Sistema Único de Saúde) is proposed for care and follow-up of people with DM, in which the primary level, considered the “gateway” is the base; the secondary level is designated to situations of greater com-plexity and presence of comorbidities; and the tertiary level is designated to the care for disease situations with a higher degree of complexity and risk of life(10).
DM can affect the HRQL due to factors arising from the diagnosis itself(9), the treatment(11), the presence of complications
and associated morbidities(8), among others, as well as intrinsic
changes in the glucose metabolism of the individuals with the disease over time(9).
Thus, the three levels of healthcare play a strategic role in SUS, and therefore evaluating the HRQoL of people with DM at different moments of the disease will enable to identify fac-tors that contribute to QoL impairment and subsidize the care planning for people with DM.
In view of the above, the present study aimed to analyze the HRQoL of people with T2DM in the three levels of healthcare
and to verify its relation with sociodemographic, clinical and laboratory variables in the total sample.
METHOD
Studytype
A quantitative, descriptive and cross-sectional study carried out at the Primary Health Care Unit (Portuguese acronym: UAPS), Secondary Health Care Unit (Portuguese acronym: UASS) and Tertiary Health Care Unit (Portuguese acronym: UATS) in the interior of São Paulo from February to July 2015.
Scenario
Three units were selected to represent the care levels that make up the SUS: a primary care unit, a secondary and a tertiary unit, in order to contemplate the different moments of treat-ment and care for people with DM2.
Selection criteria
Inclusion criteria included persons with T2DM of both genders, aged 30 years or older, with diagnosis of DM2 greater than or equal to 1 year and being followed up at one of the selected health units. Patients who were receiving DM treat-ment concurrently in another health unit were excluded.
datacollection
The study sample consisted of individuals with T2DM who attended the respective units during the data collection period (May to August 2015) and who met the proposed inclusion and exclusion criteria.
Individuals were invited to participate in the study upon return to outpatient appointments or when they came to the unit to pick up medications. The sociodemographic and HRQoL variables were collected through an individual interview, and clinical and laboratory data obtained through medical records.
The study was composed of sociodemographic variables: gender, age, origin, marital status, schooling in complete school years and occupation; clinical variables diagnosis: time of DM2, Body Mass Index (BMI), systolic blood pres-sure (SBP), diastolic blood prespres-sure (DBP), complications of the disease and presence of other diseases not related to DM2, results of Glycated Hemoglobin (HbA1c) and Plasma Fasting Glycemia (FG).
collectioninStrument
For the HRQoL data collection, the Diabetes-39 (D-39) instrument(12) translated and validated for Brazil(13) was used,
which consists of 39 items distributed into five domains: “Energy and Mobility” (15 items), “Diabetes Control” (12 items), “Anxiety and Worry” (four items), “Social Burden” (five items) and “Sexual Functioning” (three items), which assess how much the HRQoL was affected in the last month on a scale of one to seven points, in which the score of one represents “unaffected QoL”, and seven “extremely affected QoL”(12).In the
0.581 to 0.848 for the domains, showing a valid and reliable instrument to measure the HRQOL of people with DM2(13).
This instrument also has two questions about the general perception of HRQOL and about the severity of DM. In the question about the perception of HRQoL, the score is inverted, so that the score “07” represents “higher quality”, and the score “01” is “lower quality”(11-12).
Because the number of items is different across the domains, the total, minimum, and maximum scores for each domain also differs. For the domain “Energy and Mobility” (items: 03, 07, 09, 10, 11, 12, 13, 16, 25, 29, 32, 33, 34, 35 and 36), the score can range from 15 to 105 points; for “Control of Diabetes” (items: 01, 04, 05, 14, 15, 17, 18, 24, 27, 28, 31 and 39) from 12 to 84; for the “Anxiety and Worry” domain (items: 02, 06, 08 and 22) from four to 48; “Social Burden” domain (items: 19, 20, 26, 37 and 38) from five to 60; and for the “Sexual Function” domain (items 21, 23 and 30) from three to 36, adding up the two questions, one about the individual perception of QoL, and another about the perceived severity of the disease, both with a score of one to seven(14).
In the present study, we followed the instructions of the authors who validated the D-39, transforming the scores obtained in each section, the total score and the classification of self-perception of QoL and the severity of DM into a single score ranging from 0 to 100(13) in order to facilitate a
compari-son of statistical domains and analyzes.
data analySiSandproceSSing
The data were double-digitized in the Excel Program, vali-dated, and transported to the Statistical Package for The Social Science Program (version 21.0). The results were described as mean (standard deviation) and relative and absolute frequencies. The Mann-Whitney, Kruskal-Wallis and Chi-square tests were used to verify the differences between the groups, and the Spearman Correlation Coefficient was used to verify the QoL relationship with the sociodemographic variables, clinical variables and laboratory tests. An alpha of 0.05 was adopted.
ethicalaSpectS
All the participants signed the Informed Consent Term (ICF). This project was approved by the Research Ethics Committee of the Universidade of São Paulo at Ribeirão Preto School of Nursing, opinion no. 841,962/2014 and complies with resolution 466/12, research involving human beings.
RESULTS
The sample consisted of 53 people, of whom 19 (40.42%) were from UAPS, 15 (31.91%) from UASS and 19 (40.42%) from UATS. Eighteen people refused to participate in the study (five from UAPS, 11 from UASS and two from UATS). The sample number for the variables BMI, SBP, DBP, HbA1c and FG in each unit corresponded to: UAPS n=19, UASS n=12 and UATS n=16. It should be emphasized that the reduction in the sample of the variables occurred due to the unavailability of the results of these exams in the medical records.
The following are the sociodemographic data, which will be presented in the order of the primary care unit to the tertiary health unit in Table 1.
Clinical data showed that people in UASS and UATS were overweight (UASS: 27.17 kg/m² and UATS: 29.95 kg/m²) and in the UAPS they were obese (32.21 kg/m²)(15). The systolic and
diastolic blood pressure (UAPS: 122.10/81.36 mmHg, UASS: 136.00/84.66 mmHg and UATS: 135.68/78.52 mmHg), clas-sified the users as prehypertensive(16), while fasting blood glucose
(UAPS: 165.05 mg/dL, UASS: 146.66 mg/dL and UATS: 169 mg/dL) and HbA1c results (UAPS: 13.37%, UASS: 8.14% and UATS: 8.77%) were also altered(17) among the three health
units (Table 1).
Regarding DM treatment with insulin, it is noteworthy that its use was reported by two people (14.1%) in the UAPS, nine (60.0%) in the UASS and 16 (84.2%) in the UATS. Regarding insulin types, two individuals in the UAPS and six in the UASS use NPH insulin and 12 people reported using Regular/Rapid human insulin and NPH insulin in the UATS.
Regarding the HRQOL variable evaluated through the D-39, the “Anxiety and Worry” domain obtained the highest score among the UAPS and the UASS, while “Energy and Mobility” in the UATS. The lowest score was observed in the “Social Burden” domain in the three units studied. In the ques-tion that addressed the percepques-tion of HRQOL, the lowest score was obtained in the UATS and the highest in the UAPS; it should be pointed out that for this question, the higher the score, the better the perceived HRQOL. Whereas for the ques-tion on “Perceived Severity of Diabetes”, there was a lower score in UAPS and higher in UATS, which means people seen in the UAPS perceived DM as a disease of lesser severity than those followed-up by the UATS (Table 2).
When comparing the domain scores with those of the ques-tions, there was a difference between the studied groups regard-ing the question “Perceived Diabetes Severity”. Although there was no significant difference between the studied groups for the other domains, there was an increasing score in the following areas: “Energy and Mobility” and “Diabetes Control”, in the “Total Classification”, and in the questions: “Perceived general quality of life” and “Perceived diabetes severity”, showing that HRQOL tends to worsen as the complexity of healthcare levels increases (Table 2).
As a result of the reduced number of participants in the present study, the statistical analyzes of the relationship between HRQoL and sociodemographic and clinical variables were performed in the total sample, without considering the three healthcare levels. The results showed that age was negatively related to the “Diabetes Control” domain, meaning that the lower the age, the better the quality of life related to DM con-trol. HbA1c was positively related to the “Control of Diabetes” domain with the total value of the score, and with the ques-tion “Perceived diabetes severity”, meaning that the lower the HbA1c values, the better the QoL and perception of the sever-ity of DM (Table 3).
4
www.ee.usp.br/reeusp Quality of life of people with diabetes mellitusRev Esc Enferm USP · 2019;53:e03424
The comparison of the participants regarding insulin use with the HRQoL showed that the score of people who use it daily was higher in the domains: “Energy and Mobility” and “Control of Diabetes”, in the “Total QoL”, and in the “Severity of Perceived Diabetes” issue, meaning that people who use insu-lin have worse QoL when compared to those who do not use it as a treatment for DM (Table 4).
In comparing HRQoL among people with or without morbidities/comorbidities in the studied sample, a differ-ence between the HRQoL scores was observed among those who had a diagnosis of dyslipidemia and complica-tions related to DM (nephropathy, retinopathy and neu-ropathy), with those who did not have these diagnoses (Table 4).
Table 1 - Socio-demographic and clinical data – Ribeirão Preto, SP, Brazil, 2018.
Variables Frequency (%)/Mean (standard deviation) *p-value
UAPS UASS UATS
Gender
Male 10 (52.6%) 07 (46.7%) 06 (31.6%)
**1.805
Female 09 (47.4%) 08 (53.3%) 13 (68.4%)
Age (complete years) 57.37 (15.81) 63.95 (7.96) 59.36 (9.11) *0.259
Marital status
Without a partner 06 (31.6%) 09 (60.0%) 07 (36.8%)
**3.055
With a partner 13 (68.4) 06 (40.0%) 12 (63.2%)
Education level 6.0 (3.66) 5.80 (3.98) 6.21 (4.75) *0.872
Occupation
Active 07 (36.8%) 03 (20.0%) 04 (21.0%)
**7.029
Retired with paid activity 00 (0.0%) 03 (20.0%) 01 (5.3%)
Retired/Pensioner 09 (47.4%) 08 (53.3%) 11 (57.9%)
Works at home, without pay 01 (5.3%) 00 (0.0%) 01 (5.3%)
Unemployed/On leave 02 (10.5%) 01 (6.7) 02 (10.5%)
BMI 32.21 (8.22) 27.17 (4.98) 29.95 (4.64) *0.133
SBP 122.10 (12.39) 136.00 (25.01) 135.68 (21.55) *0.046
DBP 81.36 (23.18) 84.66 (9.15) 78.52 (10.07) *0.088
FG 165.05 (99.34) 146.66 (73.91) 169.61 (81.52) *0.495
HbA1c 13.37 (19.54) 8.14 (1.94) 8.77 (1.95) *0.561
* Kruskal-Wallis test; ** Chi-square test.
Table 2 – HRQL of the sample studied by domains of the D-39 instrument in the three levels of health care – Ribeirão Preto, SP, Brazil, 2018.
Variables Mean (standard deviation)
P-value*
D-39 Domains UAPS (n= 19) UASS (n= 15) UATS (n=19)
Energy and Mobility 35.14 (29.64) 41.40 (21.28) 48.12 (26.69) 0.220
Diabetes Control 30.62 (25.59) 32.03 (22.36) 36.47 (22.99) 0.659
Anxiety and Worry 44.07 (29.50) 43.33 (26.80) 47.58 (30.91) 0.782
Social Burden 23.15 (30.27) 14.66 (14.29) 24.21 (29.60) 0.857
Sexual Functioning 30.70 (37.33) 35.92 (40.32) 34.50 (29.25) 0.734
Total classification 32.79 (25.26) 34.87 (18.66) 40.37 (22.44) 0.465
Overall perceived QoL 67.54 (28.58) 65.55 (31.15) 68.42 (26.58) 0.954
Severity of perceived DM 47.36 (32.51) 50.0 (38.31) 76.31 (32.54) 0.024*
Table 3 – Relationship of Quality of Life with sociodemographic and clinical variables of the studied sample – Ribeirão Preto, SP, Brazil, 2018.
Variables
Quality of life (Diabetes-39)
Energy and
Mobility Diabetes Control Anxiety and Worry BurdenSocial Sexual functioning Total QoL OverallQoL Diabetes Severity Statistical value for the Spearman coefficient (p-value)
Age -0.13 (0.35) -0.32 (0.01) -0.21 (0.11) -0.25 (0.06) -0.19 (0.16) -0.23 (0.08) -0.02 0.87) -0.17 (0.21)
Duration of DM 0.12 (0.36) - 0.02 (0.87) 0.11 (0.44) -0.09 (0.48) -0.12 (0.37) 0.04 (0.72) 0.04 (0.76) 0.22 (0.11) Education level 0.04 (0.72) 0.05 (0.68) 0.06 (0.62) -0.05 (0.67) -0.04 (0.74) 0.02 (0.87) -0.17 (0.19) -0.06 (0.63) BMI 0.14 (0.32) 0.04 (0.76) 0.08 (0.57) 0.00 (0.94) -0.10 (0.47) 0.06 (0.66) 0.00 (0.99) 0.04 (0.74)
5
Tonetto IF
A, Baptista MHB, Gomides DS, P
ace AE
.ee.usp.br/reeusp
Rev Esc Enf
erm USP · 2019;53:e03424
Table 4 – Comparison of health-related quality of life with sociodemographic and clinical variables – Ribeirão Preto, SP, Brazil, 2018.
Variables
Quality of life (Diabetes – 39)
Mean (SD) Energy
Mobility p- value
Diabetes
control p- value
Anxiety
Worry p- value
Social
Burden p- value Sexual func. p- value Total QoL p- value Overall QoL p- value
Diabetes
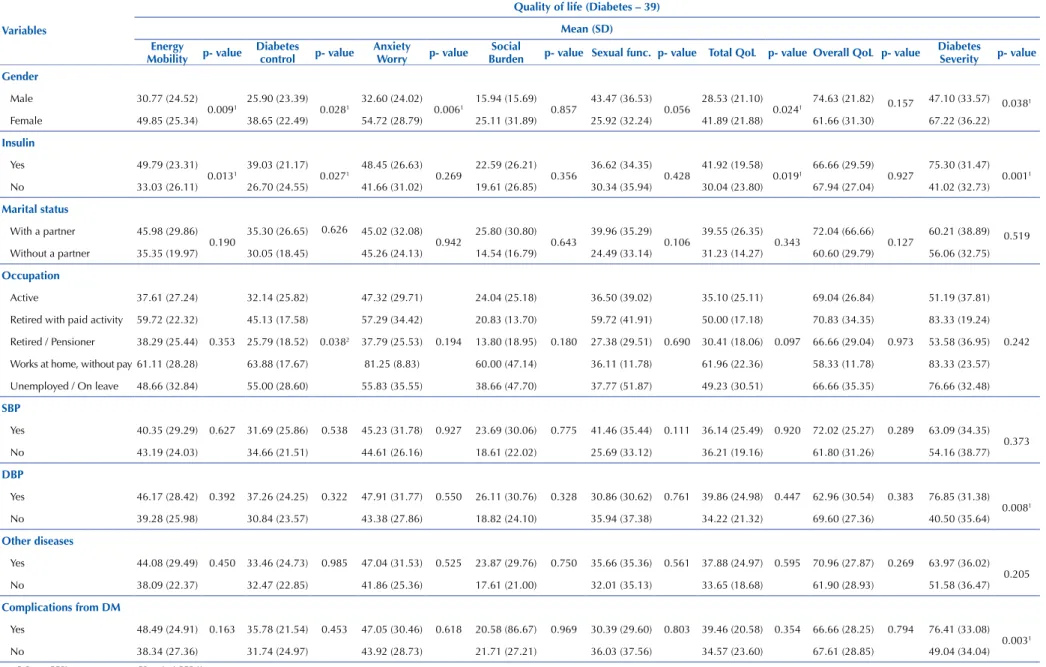
Severity p- value Gender
Male 30.77 (24.52)
0.0091 25.90 (23.39) 0.0281 32.60 (24.02) 0.0061 15.94 (15.69) 0.857 43.47 (36.53) 0.056 28.53 (21.10) 0.0241 74.63 (21.82) 0.157 47.10 (33.57) 0.0381
Female 49.85 (25.34) 38.65 (22.49) 54.72 (28.79) 25.11 (31.89) 25.92 (32.24) 41.89 (21.88) 61.66 (31.30) 67.22 (36.22)
Insulin
Yes 49.79 (23.31)
0.0131 39.03 (21.17) 0.0271 48.45 (26.63) 0.269 22.59 (26.21) 0.356 36.62 (34.35) 0.428 41.92 (19.58) 0.0191 66.66 (29.59) 0.927 75.30 (31.47) 0.0011
No 33.03 (26.11) 26.70 (24.55) 41.66 (31.02) 19.61 (26.85) 30.34 (35.94) 30.04 (23.80) 67.94 (27.04) 41.02 (32.73)
Marital status
With a partner 45.98 (29.86)
0.190 35.30 (26.65)
0.626 45.02 (32.08)
0.942 25.80 (30.80) 0.643 39.96 (35.29) 0.106 39.55 (26.35) 0.343 72.04 (66.66) 0.127 60.21 (38.89) 0.519 Without a partner 35.35 (19.97) 30.05 (18.45) 45.26 (24.13) 14.54 (16.79) 24.49 (33.14) 31.23 (14.27) 60.60 (29.79) 56.06 (32.75)
Occupation
Active 37.61 (27.24)
0.353
32.14 (25.82)
0.0382
47.32 (29.71)
0.194
24.04 (25.18)
0.180
36.50 (39.02)
0.690
35.10 (25.11)
0.097
69.04 (26.84)
0.973
51.19 (37.81)
0.242 Retired with paid activity 59.72 (22.32) 45.13 (17.58) 57.29 (34.42) 20.83 (13.70) 59.72 (41.91) 50.00 (17.18) 70.83 (34.35) 83.33 (19.24)
Retired / Pensioner 38.29 (25.44) 25.79 (18.52) 37.79 (25.53) 13.80 (18.95) 27.38 (29.51) 30.41 (18.06) 66.66 (29.04) 53.58 (36.95)
Works at home, without pay 61.11 (28.28) 63.88 (17.67) 81.25 (8.83) 60.00 (47.14) 36.11 (11.78) 61.96 (22.36) 58.33 (11.78) 83.33 (23.57)
Unemployed / On leave 48.66 (32.84) 55.00 (28.60) 55.83 (35.55) 38.66 (47.70) 37.77 (51.87) 49.23 (30.51) 66.66 (35.35) 76.66 (32.48)
SBP
Yes 40.35 (29.29) 0.627 31.69 (25.86) 0.538 45.23 (31.78) 0.927 23.69 (30.06) 0.775 41.46 (35.44) 0.111 36.14 (25.49) 0.920 72.02 (25.27) 0.289 63.09 (34.35) 0.373
No 43.19 (24.03) 34.66 (21.51) 44.61 (26.16) 18.61 (22.02) 25.69 (33.12) 36.21 (19.16) 61.80 (31.26) 54.16 (38.77)
DBP
Yes 46.17 (28.42) 0.392 37.26 (24.25) 0.322 47.91 (31.77) 0.550 26.11 (30.76) 0.328 30.86 (30.62) 0.761 39.86 (24.98) 0.447 62.96 (30.54) 0.383 76.85 (31.38) 0.0081
No 39.28 (25.98) 30.84 (23.57) 43.38 (27.86) 18.82 (24.10) 35.94 (37.38) 34.22 (21.32) 69.60 (27.36) 40.50 (35.64)
Other diseases
Yes 44.08 (29.49) 0.450 33.46 (24.73) 0.985 47.04 (31.53) 0.525 23.87 (29.76) 0.750 35.66 (35.36) 0.561 37.88 (24.97) 0.595 70.96 (27.87) 0.269 63.97 (36.02) 0.205
No 38.09 (22.37) 32.47 (22.85) 41.86 (25.36) 17.61 (21.00) 32.01 (35.13) 33.65 (18.68) 61.90 (28.93) 51.58 (36.47)
Complications from DM
Yes 48.49 (24.91) 0.163 35.78 (21.54) 0.453 47.05 (30.46) 0.618 20.58 (86.67) 0.969 30.39 (29.60) 0.803 39.46 (20.58) 0.354 66.66 (28.25) 0.794 76.41 (33.08) 0.0031
6
www.ee.usp.br/reeusp Quality of life of people with diabetes mellitusRev Esc Enferm USP · 2019;53:e03424
DISCUSSION
The HRQoL in the present study was investigated from the perception about the possible influences of the DM on the daily lives of people across five different domains, includ-ing two questions on general QoL and severity of DM, which make up the D-39 instrument.
The literature shows that it is necessary to follow dietary recommendations and regular physical exercises for control-ling DM; however, when such care becomes insufficient to maintain glycemic control, oral antidiabetic therapy is initi-ated, combined or not with other oral drugs, or even with insulin therapy(17). However, behavioral changes and skill
development are needed in care for treatment success, such as monitoring blood glucose, preparing and administering insulin, examining the feet, among other actions.
Disease duration and poor glycemic control favor the development of comorbidities that contribute to the aggra-vation of health, which demands other therapies and special-ized care and/or treatments. As a consequence, the person is referred to health units of greater technological complexity in order to receive the treatment according to the degree of complexity of their health.
Although there was no significant difference when con-sidering the value of p <0.05, the results indicate a tendency for QoL worsening as the complexity in the healthcare level increases. These results have already been shown in a study with people attended at the tertiary healthcare level, where they perceive their disease with greater severity (p <0.05). According to the care characteristics at this care level, these results are expected. As the complexity of DM increases, the more specialized the care level is for the patient being attended(17).
Studies comparing HRQoL between care levels were not identified in the literature, which made it difficult to discuss these data; however, a longitudinal study showed that HRQoL tends to worsen with worsening of glucose metabolism(9) and consequently the levels of complexity of
attention also intensify.
Regarding the association of HRQoL and clinical, sociodemographic and laboratory data, the present study observed a difference between gender, occupation, the treat-ment and the presence of chronic complications. There was a greater perception of QoL impairment and disease severity for higher HbA1c rates.
In Saudi Arabia, a cross-sectional study with a sample of 283 patients with DM2 from a tertiary hospital in Riyadh, which used the 36-item Short-Form questionnaire (SF-36), showed that increased complications related to DM, gender and economic conditions contribute to poorer HRQoL(18).
A cross-sectional study was carried out in Mexico with the objective to evaluate the HRQoL by means of D-39 in 198 people with T2DM of both genders, with a mean age of 55 years (SD = 9.7), in an outpatient follow-up at the health centers of the metropolitan region, and showed results similar to those of the present study, with a higher score in the item “Perceived diabetes severity”(19).
Another cross-sectional, multicenter study was con-ducted in Germany, the United Kingdom, Norway, Australia, the United States and Canada to provide the D-39 as an Multi-attribute utility-based instrument (MAUI), con-ducted with 924 people who declared themselves to be car-riers of DM and users of their respective health services, showed that men have higher HRQoL and that women obtained worse HRQoL in the domains: “Diabetes Control”, “Energy and Mobility” and “Anxiety and Worry”(20).
These results were similar to the present study, in which women also obtained lower HRQoL in the “Energy and mobility”, “Control of Diabetes,” “Anxiety and worry” domains, in addition to “Total quality of life” and the ques-tion regarding “Perceived diabetes severity”.
A difference in the present study was also found in the HRQoL between people who use insulin or not. Those who use have had worse HRQoL in the areas of “Energy and Mobility”, “Diabetes Control”, “Total Quality of Life” and the “Severity of Perceived Diabetes”.
A cross-sectional study conducted in private units in Buenos Aires, Argentina, in a sample of 183 adults with DM2, 93 of whom were treated with NPH insulin and 90 with insulin glargine, through the application of the Audit of Diabetes Dependent Quality of Life questionnaire (ADDQoL), showed that the domains most affected were the following: “Concerns about the Future,” “Freedom to Eat,” “Living Conditions,” “Sexual Life,” and “Family Life.” This study also highlighted that regardless of sociodemo-graphic and clinical variables, the use of insulin may affect the QoL of patients with DM2(11).
HbA1c is an important parameter of glycemic control. The results of the present study showed that the higher the HbA1c values (inadequate glycemic control), the worse the HRQoL values in the “Control of Diabetes” domain, the “Total Quality of Life” and the question on “Perception of the severity of diabetes”.
A descriptive study with 102 people between 30 and 75 years old and with at least 1 year of diagnosis of T2DM carried out in an outpatient unit of a diabetes center in Iran, with the objective to evaluate the relationship of QoL to glucose and plasma lipids, showed that the increase of HbA1c may be related to the worse QoL, since those with HbA1c <6.1% had a score of 54.6, while the score in those with HbA1c > 6.1 was 1.2, despite no statistical differ-ence (p=0.573). The instrument used was the World Health Organization Quality of Life (WHOQOL-bref ), the abbre-viated version, in which the score ranges from 0 to 100(6).
In England, 510 adults aged 40 to 69 years were evalu-ated using the Cambridge screening program (ADDITION – Cambridge) to assess the influence of glycemic variations on the QoL of people with T2DM over 4 years. The results showed that the DM-specific QoL, as evaluated through the ADDQoL, is sensitive to glycemic changes, even if the disease is well-controlled(4).
of 1,158 people with DM2, performed through the DM2 Strategic Research project in Denmark. This study aimed to evaluate the patient’s response to monotherapy, combination therapy or the absence of pharmacological intervention for the treatment of T2DM in its first year of diagnosis, evidencing that younger patients demonstrated better glycemic control and maintenance capacity within the parameters of normal-ity in the three types of proposed therapeutic approaches(21).
As a limitation of the present study, we highlight the sample size, which impaired statistical analysis of the QoL relationship with sociodemographic and clinical variables among the three health care levels. We can also point out the difficulty in discussing the data, as there are few published studies which used the D-39 instrument.
CONCLUSION
In analyzing the respective domains of the D-39 instru-ment, there was no difference with statistical significance in
the HRQoL of the people served by the primary, second-ary and tertisecond-ary care units; however, there was a growing increase in HRQoL scores, which point to a tendency for QoL impairment according to the care complexity.
For p<0.05, there was difference in QoL between gender, occupation, treatment and the presence of chronic complica-tions. For the higher hemoglobin levels, there was greater QoL impairment and a greater perception of disease severity, and the lower the age, the better the QoL.
Understanding how DM can compromise a person’s QoL enables identification of care needs and for planning nursing care in an individualized way, and therefore it con-tributes to improving QoL and controlling the disease.
The results of the present study suggest that the QoL of the person with DM may worsen as the care for the disease becomes more complex, therefore highlighting that investments in primary healthcare are fundamental and necessary.
RESUMO
Objetivo: Analisar a qualidade de vida de pessoas com diabetes mellitus tipo 2, nos três níveis de atenção à saúde. Método: Estudo quantitativo, transversal e descritivo, realizado em unidades de atenção primária, secundária e terciária à saúde com pessoas em atendimento ambulatorial. Utilizou-se do instrumento validado Diabetes-39 para avaliar a qualidade de vida. Resultados: A amostra foi constituída por 53 pessoas. Observou-se tendência crescente no comprometimento da qualidade de vida do nível de atenção primária a terciária. Na amostra total, houve diferenças entre domínios da qualidade de vida com as variáveis sexo, uso de insulina e ocupação, maior percepção do comprometimento da qualidade de vida e gravidade da doença nas pessoas com maiores taxas de hemoglobina glicada. Conclusão: A qualidade de vida tende a piorar à medida que a doença se agrava. Os resultados sugerem que a qualidade de vida se relaciona com as variáveis sociodemográficas e clínicas, portanto, essas devem ser consideradas no cuidado.
DESCRITORES
Diabetes Mellitus Tipo 2; Qualidade de Vida; Cuidados de Enfermagem; Atenção Primária à Saúde; Nível de Saúde.
RESUMEN
Objetivo: Analizar la calidad de vida de personas con diabetes mellitus tipo 2, en los tres niveles de atención sanitaria. Método: Estudio cuantitativo, transversal y descriptivo, realizado en unidades de atención primaria, secundaria y terciaria de salud con personas en atención ambulatoria. Se utilizó el instrumento validado Diabetes-39 para evaluar la calidad de vida. Resultados: La muestra estuvo constituida de 53 personas. Se observó tendencia creciente en el compromiso de la calidad de vida del nivel de atención primaria a terciaria. En la muestra total, hubo diferencias entre dominios de la calidad de vida con las variables sexo, uso de insulina y ocupación, mayor decepción del compromiso con la calidad de vida y severidad de la enfermedad en la personas con mayores tasas de hemoglobina glicada. Conclusión: La calidad de vida tiende a empeorar a medida que se agrava la enfermedad. Los resultados sugieren que la calidad de vida se relaciona con la variables sociodemográficas y clínicas, por lo tanto, esas deben considerarse en el cuidado.
DESCRIPTORES
Diabetes Mellitus Tipo 2; Calidad de Vida; Atención de Enfermería; Atención Primaria de Salud; Estado de Salud.
REFERENCES
1. International Diabetes Federation. IDF Diabetes Atlas [Internet]. Brussels: IDF; 2017 [cited 2017 Nov 14]. Available from: https://www.idf. org/e-library/epidemiology-research/diabetes-atlas.html
2. Brasil. Ministério da Saúde. DATASUS. Informações em Saúde – Mortalidade [Internet]. Brasília: MS; 2015 [citado 2017 fev. 02]. Disponível em: http://tabnet.datasus.gov.br/cgi/tabcgi.exe?sim/cnv/obt10uf.def
3. Stryker LS. Modifying risk factors: strategies that work diabetes mellitus. J Arthroplasty. 2016;31(8):1625-7. DOI: https://doi.org/10.1016/j. arth.2016.02.084.
4. Kuznetsov L, Long GH, Griffin SJ, Simmons RK. Are changes in glycaemic control associated with diabetes-specific quality of life and
health status in screen-detected type 2 diabetes patients? Four-year follow up of the ADDITION-Cambridge cohort. Diabetes Metab Res Rev. 2015;31(1):69-75. DOI: 10.1002/dmrr.2559
5. World Health Organization. The WHOQOL Group. Development of the World Health Organization WHOQOL-BREF Quality of Life Assessment 1998. Psychol Med. 1998;28(3): 551-8.
6. Parsa P, Ahmadinia-Tabeshb R, Mohammadic Y, Khoramid N. Investigating the relationship between quality of life with lipid and glucose
levels in Iranian diabetic patients. Diabetes Metab Syndr. 2017;11 Suppl 2:S789-83. DOI: https://doi.org/10.1016/j.dsx.2017.07.009 7. Fayers PM, Machin D. Quality of life: assessment, analysis and interpretation. Chichester: John Wiley & Sons; 2000.
8. Kamradt M, Krisam J, Kiel M, Qreini M, Besier W, Szecsenyi J, et al. Health-related quality of life in primary care: which aspects matter in
8
www.ee.usp.br/reeusp Quality of life of people with diabetes mellitusRev Esc Enferm USP · 2019;53:e03424
9. Hunger M, Holle R, Meisinger C, Rathmann W, Peters A, Schunk M. Longitudinal changes in health-related quality of life in normal glucose
tolerance, prediabetes and type 2 diabetes: results from the KORA S4/F4 cohort study. Qual Life Res. 2014;23(9):2515-20. DOI: https:// doi.org/10.1007/s11136-014-0689-5.
10. Ribeirão Preto. Secretaria Municipal da Saúde. Protocolo de atendimento em hipertensão e diabetes [Internet]. Ribeirão Preto: SMS; 2011 [citado 2011 mar. 31]. Disponível em: http://www.saude.ribeiraopreto.sp.gov.br/ssaude/pdf/prot-hipertensao.pdf
11. Pichon-Riviere A, Irazola V, Beratarrechea A, Alcaraz A, Carrara C. Quality of life in type 2 diabetes mellitus patients requiring insulin
treatment in Buenos Aires, Argentina: a cross-sectional study. Int J Health Policy Manag. 2015;4(7):475-80. DOI: 10.15171/ijhpm.2015.80 12. Boyer JG, Earp JA. The development of an instrument for assessing the quality of life of people with diabetes (diabetes 39). Med Care.
1997;35(5):440-53.
13. Queiroz FA, Pace AE, Santos CB. Cross-cultural adaptation end validation of quality of life instrument Diabetes 39 (D-39): Brazilian version
for type 2 diabetes mellitus patients-stage. Rev Latino Am Enfermagem [Internet]. 2009 [cited 2013 Sept 20];17(5):708-15. Available from: http://www.scielo.br/scielo.php?script=sci_arttext&pid=S0104-11692009000500018
14. Zulian LR, Santos MA, Veras VS, Rodrigues FFL, Arrelias CCA, Zanetti ML. Qualidade de vida de pacientes com diabetes utilizando o instrumento Diabetes 39 (D-39). Rev Gaúcha Enferm [Internet]. 2013 [citado 2015 set. 15];34(3):138-146. Disponível em: http://www. scielo.br/scielo.php?script=sci_arttext&pid=S1983-14472013000300018
15. World Health Organization. Physical status: the use and interpretation of anthropometry [Internet] Geneva: WHO; 1995 [cited 1995 Nov 03]. Available from: http://apps.who.int/iris/bitstream/10665/37003/1/WHO_TRS_854.pdf
16. Sociedade Brasileira de Cardiologia. 7ª Diretriz Brasileira de Hipertensão Arterial. Arq Bras Cardiol [Internet]. 2016 [citado 2016 set.
03];107(3):1-83. Disponível em: http://publicacoes.cardiol.br/2014/diretrizes/2016/05_HIPERTENSAO_ARTERIAL.pdf
17. Sociedade Brasileira de Diabetes. Diretrizes da Sociedade Brasileira de Diabetes: 2015-2016 [Internet]. Rio de Janeiro: AC Farmacêutica;
2016 [citado 2017 abr. 19]. Disponível em: http://www.diabetes.org.br/profissionais/images/docs/DIRETRIZES-SBD-2015-2016.pdf
18. Al Hayek AA, Robert AA, Al Saeed A, Alzaid AA, Al Sabaan FS. Factors associated with health-related quality of life among saudi patients
with type 2 diabetes mellitus: a cross-sectional survey. Diabetes Metab J [Internet]. 2014 [cited 2017 Nov 13];38(3):220-9. Available from: https://www.ncbi.nlm.nih.gov/pmc/articles/PMC4083029/
19. Estrada JGS, Strauss AMG, Beltrán CA, Baltazar RG, Moreno MP.La calidad de vida en adultos con diabetes mellitus tipo 2 en centros de salud de Guadalajara, Jalisco (México). Salud Uninorte [Internet]. 2012 [citado 2017 nov. 05];28(2):264-75. Disponible en: http://www. redalyc.org/articulo.oa?id=81724957009
20. Chen G, Iezzi A, Mckie J, Khan MA, Richardson J. Diabetes and quality of life: comparing results from utility instruments and Diabetes-39.
Diabetes Res Clin Pract. 2015;109(2):326-33. DOI: https://doi.org/10.1016/j.diabres.2015.05.011
21. Mor A, Berencsi K, Svensson E, Rungby J, Nielsen JS, Friborg S, et al. Prescribing practices and clinical predictors of glucose-lowering
therapy within the first year in people with newly diagnosed type 2 diabetes. Diabet Med. 2015;32(12):1546-54. DOI: 10.1111/dme.12819
Financial support
Conselho Nacional de Desenvolvimento Científico e Tecnológico (CNPq). Bolsa de Iniciação Científica, Protocol no. 102901/2015-5.