An expert model approach to assess the potential of
non-wood forest products for forest owners
Marlene Maria Guilherme Marques
Dissertation to obtain the Master Degree (MsC) in
Forestry and Natural Resources
Supervisors: José Guilherme Martins Dias Calvão Borges
Patrick Huber
Júri:
Presidente: Doutor Pedro César Ochôa de Carvalho, Professor Auxiliar do Instituto Superior de Agronomia da Universidade de Lisboa
Vogais: Doutora Maria Margarida Branco de Brito Tavares Tomé, Professora Catedrática do Instituto Superior de Agronomia da Universidade de Lisboa
Doutor José Guilherme Martins Dias Calvão Borges, Professor Associado com Agregação do Instituto Superior de Agronomia da Universidade de Lisboa
“The best way to predict your future is to create it.” Abraham Lincoln
ACKNOWLEDGEMENTS
I want to thank all of the people that helped and supported me or had an input in the development of this thesis. First I would like to express my sincerest gratitude to my supervisors:
Professor José Guilherme Borges, of the Instituto Superior de Agronomia, for inviting me to return to an academic career; for providing me with all the necessary facilities for the research; for the guidance, valuable advice, continuous support and encouragement in new challenges; and for helping me to complete this thesis.
Researcher Patrick Huber, of European Forest Institute Central-East European Regional Office, by promptly accepting the invitation to be my supervisor; for conducting and providing me the framework for this thesis; for the successful execution of the project; for his ready availability in clarifying doubts, and in providing advice and support during the work.
I am grateful for Professor Margarida Tomé, of the Instituto Superior de Agronomia, for sharing expertise and practical advice, and for the continuous encouragement and motivational spirit.
I would also like to thank to Luis Fontes, of the Instituto Superior de Agronomia, for his support and availability to answer questions; and for helping with questionnaires.
Thank you to Professor Harald Vacik, of University of Natural Resources and Life Sciences Vienna, for the explanations about AHP software and his support during the work.
A special thanks to Susete Marques, Brigite Botequim and Marco Marto, of the Instituto Superior de Agronomia, who embraced me from the beginning and have always been willing to provide me with their support and for sharing their knowledge.
Thank you to all my colleagues from ForChange, of the Instituto Superior de Agronomia, for their willingness and support.
My sincere thanks to all persons who contributed to this study in the frame of stakeholder participation and for their expert knowledge.
My heartfelt gratitude to my great friends Paula Amaral and Carla Miragaia who helped me stay positive through these last difficult years. Their support and care helped me overcome setbacks and stay focused on the good things of life. I greatly value their friendship.
I express my thankfulness to all my friends who contributed to a great learning process in my life and for their encouragement in some difficult moments, namely João Moreira, Tiago Pereira da Silva, José Sousa Uva, Carla Leite and Sybelle Barreira.
To Carla Patrícia Santos, who left this world too early, my gratitude for her friendship, support and ready availability to help.
A very special thanks to my family for their love and constant support.
Finally, I deeply thank Pedro for being by my side, for his endless patience and incredible support throughout this journey. He has been a constant source of unconditional strength during the tough moments all these years. I want to thank him for believing in me and encouraging me in new challenges.
The research for this dissertation has been financially supported by FP7 Project no. 311919 KBBE.2012.1.2-06 StarTree – Multipurpose trees and non-wood forest products a challenge and opportunity, and COST – Action FP1203: European non-wood forest products (NWFPs) network.
ABSTRACT
The interest in sustainable development and environmental management from non-wood forest products (NWFPs) has been growing during the past decade. These products are important in the bio-economy especially in regions where wood is not the most profitable product. As NWFPs cover a wide range of species they provide an array of alternatives to use more green products and are a relevant component of sustainable forest management. We present an approach to characterize the potential of most promising NWFPs in the Alentejo region. We used the Analytic Hierarchy Process (AHP), one of many multi-criteria decision making methods, and a Delphi approach to support judgments collected from stakeholders and domain experts. In order to facilitate and manage the pairwise comparisons in the application of the AHP we selected seven regional NWFPs: boletus (Boletus edulis), cork (Quercus suber), pine nuts (Pinus pinea), pine resin (Pinus spp), yellow lavender (Lavandula viridis), honey from bees (Apis mellifera), and rabbit as game meat (Oryctolagus cuniculus). AHP incorporated the judgments (weights) from experts along a hierarchical decomposition of the problem into a set of criteria and sub-criteria, and generated a regionally explicit ranking of alternatives (NWFPs) by deriving priorities.
The three NWFPs with the highest potential were cork, pine nuts and yellow lavender. In a second level of importance were boletus, pine resin, honey and rabbit. These results further reinforce that cork is the product with the greatest potential in Alentejo region. However, yellow lavender has a significant potential and could be an interesting opportunity for forest owners that aim diversifying the basket of products supplied. The sensitivity analysis indicated that the model is robust because the ranking of NWFPs did not change much with the weights of criteria. This model also provides forest owners with information to develop management strategies or to engage in related NWFPs businesses.
Keywords: Analytical Hierarchy Process (AHP), Delphi, non-wood forest products (NWFPs),
RESUMO
O interesse pelo desenvolvimento sustentável e pela gestão multifuncional da floresta através de produtos florestais não lenhosos (PFNLs), também designados por produtos florestais silvestres, tem vindo a aumentar ao longo da última década. Isto deve-se ao aumento do reconhecimento dos PFNLs na contribuição para os objetivos ambientais, incluindo a conservação da diversidade biológica e uma alternativa no consumo de produtos ecológicos. Os PFNLs são importantes para a bioeconomia, especialmente nas regiões em que a madeira não é o produto mais rentável.
Estes produtos abrangem uma ampla diversidade de espécies (plantas, fungos, fauna), com peso significativo no comércio internacional. De acordo com o último relatório sobre o estado das florestas da Europa (FOREST EUROPE, 2015) o valor total de PFNLs na floresta europeia - dados considerados incompletos - foi estimado em 2.277 milhões de euros, dos quais 73% foram gerados por produtos de origem vegetal e 27% por produtos de origem animal.
Neste âmbito, apresentamos e aplicamos uma abordagem, desenvolvida por Huber et al. (2015), que permite disponibilizar, em particular aos proprietários florestais de pequena escala, uma ferramenta relativa aos PFNLs mais promissores na região do Alentejo. A metodologia proposta combina técnicas de decisão multicritério (MCDM), através do método de análise hierárquica (AHP - Analytic Hierarchy Process), com o método Delphi, no apoio de decisões de gestão integradas de grupo, relativas a peritos regionais na temática dos PFNLs.
O método AHP converte os julgamentos dos peritos em valores numéricos que podem ser processados e comparados sobre toda a extensão do problema, juntamente com a decomposição hierárquica do problema num conjunto de níveis de critérios e de subcritérios. Um peso numérico, ou prioridade, é derivado para cada elemento da hierarquia, permitindo que elementos distintos e frequentemente incomensuráveis sejam comparados entre si de maneira racional e consistente. Na etapa final, as prioridades numéricas são derivadas para cada uma das alternativas de decisão, gerando um ranking regional. A metodologia consiste em cinco fases principais.
Na primeira fase foram selecionados sete PFNLs regionais, representativos do Alentejo, tendo-se considerado como fatores de seleção: o comércio, a contribuição para a socioeconomia da população local (principalmente rural) e ainda o interesse inovador para o mercado nacional e internacional.
Os produtos selecionados foram: cogumelos boletos (Boletus edulis), cortiça (Quercus suber), pinhão (Pinus pinea), resina de pinheiro (Pinus spp), lavanda amarela (Lavandula viridis), mel de abelha (Apis mellifera) e coelho-bravo (Oryctolagus cuniculus). Esta seleção teve como objetivo facilitar a aplicação do modelo e o processo de comparações de pares, o qual se torna de difícil processamento comparativo para os peritos quando consideradas mais do que oito alternativas.
Na segunda fase, o problema de decisão foi organizado numa estrutura hierárquica. O objetivo era "identificar os PFNLs mais promissores na região do Alentejo". Para espelhar diferentes ambientes ecológicos e socioeconómicos foram definidos cenários de ponderação regional explícitos de acordo com quatro critérios (específicos para a região): "Potencial de mercado", "Potencial Institucional", "Requisitos" e "Recurso potencial" e ainda os respetivos subcritérios (15 no total), específicos para o proprietário florestal. O principal objetivo é destacar a relevância de cada critério na região do Alentejo e descrever a sua importância atual para a produção sustentável de PFNLs. Os pesos atribuídos afetam os resultados finais na medida em que colocam especial ênfase em critérios individuais e respetivos subcritérios, ou seja, a influência na classificação dos PFNLs é expressa de acordo com a ponderação relativa dos critérios.
A terceira fase diz respeito à seleção dos peritos regionais, que estão ativamente envolvidos na gestão regional de PFNLs e/ou são especialistas, a fim de obter classificações de preferência para os critérios e subcritérios da AHP (ou seja, chegar a um acordo consensual sobre a importância relativa dos mesmos). Neste estudo, decidimos escolher como peritos regionais os 12 membros portugueses do Grupo Regional das partes interessadas do projeto StarTree. A fim de obter um ranking cardinal das alternativas (ou seja, os PFNLs selecionados) por comparações de pares, foi necessário nomear peritos especializados, pelo que decidimos escolher dois professores e dois investigadores do Centro de Estudos Florestais, do Instituto Superior de Agronomia.
Na quarta fase aplicou-se o método Delphi para apurar as opiniões dos peritos regionais, através da realização de questionários em duas rondas. Este método é uma das poucas metodologias que permite analisar dados qualitativos, sendo sobretudo utilizado para facilitar a formação de uma opinião de grupo, identificando padrões de acordo. As preferências/pesos (importância relativa) referentes aos critérios e subcritérios foram atribuídos diretamente pelos peritos regionais, atribuindo 10 pontos no total para os quatro critérios e até 10 pontos no máximo para um único subcritério. A escala espacial para a avaliação foi normalmente regional para nacional, apenas para alguns subcritérios foi considerado o nível europeu.
Os resultados dos questionários da primeira ronda, relativos aos onze peritos que responderam, foram agregados num único ficheiro e realizada a devida análise estatística. O ficheiro agregado foi posteriormente enviado a todos os peritos regionais para uma segunda ronda de julgamento, juntamente com o questionário que responderam na primeira ronda. No quadro da segunda avaliação o perito regional foi livre para reconsiderar as suas avaliações e adotá-las para a síntese final, que irá então contribuir para o cenário de ponderação para a região do Alentejo. Como resultado pretendeu-se derivar um acordo consensual da importância relativa dos critérios e subcritérios analisados.
A quinta fase refere-se à adequação dos diferentes PFNLs através da aplicação do método de comparações de pares, a fim de obter um ranking cardinal de alternativas (ou seja, todos os PFNLs regionalmente relevantes). Com recurso ao software Expert Choice, os peritos especializados avaliaram a preferência relativa de uma alternativa (determinado PFNL) sobre a outra através da comparações de pares, relativamente a cada subcritério. Na classificação de cada PFNL o perito teve de indicar um número relativo à ordem de preferência na comparação de pares: 1 = primeiro, 2 = segundo, 3 = terceiro, ..., n = menos preferível. A escala espacial para a avaliação foi normalmente regional para nacional (a fim de avaliar o potencial regional dos PFNLs selecionados); apenas para alguns subcritérios foi considerado o nível europeu.
As comparações realizadas por este método são subjetivas. O método AHP tolera inconsistência através da quantidade de redundância na abordagem. Na sua análise o AHP fornece uma medida da inconsistência em cada conjunto de julgamentos. Este valor é calculado por um índice de consistência (CI) e um rácio de consistência (CR). Se o CR for superior a 0.10, os julgamentos não são confiáveis porque são demasiado próximos para o conforto de aleatoriedade, e o exercício não tem valor ou deve ser repetido, através da revisão dos julgamentos subjetivos. Na comparação de pares dos PFNLs selecionados, para cada subcritério, o CR foi sempre inferior a 0.10.
De acordo com os resultados finais os três PFNLs com maior potencial no Alentejo são a cortiça, o pinhão e a lavanda amarela. Num segundo nível de importância encontram-se os boletos, a resina de pinheiro, o mel e o coelho-bravo. Estes resultados reforçam ainda mais o facto de a cortiça ser o produto com maior potencial no Alentejo. No entanto, a lavanda amarela apresenta um potencial significativo e poderá ser uma das principais prioridades para os proprietários florestais numa perspetiva de diversificação do portfolio de produtos explorados. A lavanda amarela apresenta um peso aproximado ao do pinhão, um produto explorado em grande escala na região.
O coelho-bravo é o PFNL com menor peso no ranking, provavelmente porque a sua caça é limitada a zonas concessionadas e, em alguns casos, não apresenta um retorno financeiro direto para os proprietários florestais, o que levará a desinteresse económico.
A análise sensitiva indica que a classificação final dos PFNLs pode mudar se os critérios tiverem pesos diferentes. O modelo demonstrou ser robusto porque, em geral, o ranking dos PFNLs não se alterou significativamente com os pesos dos critérios atribuídos pelos peritos regionais. A lavanda amarela e os boletos foram os PFNLs mais afetados pelos critérios ponderados.
Os resultados demonstraram o potencial do modelo AHP como uma ferramenta para fornecer aos proprietários florestais informação para desenvolverem (também) estratégias de gestão ou para a realização de atividades relacionadas com PFNLs, nomeadamente: a) diversificação do seu portfolio de produtos numa perspetiva económica sustentável; b) distribuição dos riscos socioeconómicos; c) contribuição para a conservação da biodiversidade; d) estratégia alternativa como nicho de mercado; e) promoção dos PFNLs numa sinergia complementar com os outros produtos e/ou serviços (turismo, recreio), ou seja, outros operadores económicos.
Na sequência do desenvolvimento desta metodologia será relevante a sua aplicação e extensão a outras regiões de Portugal, para diferentes PFNLs, na perspetiva de apoio à definição dos produtos a considerar no âmbito das suas atividades por parte de proprietários florestais, populações rurais, associações de produtores florestais, investigadores, e contribuir para a evolução e diversificação da bioeconomia. Para além disso contribui para definir, de forma fundamentada, os objetivos a considerar no âmbito do planeamento da gestão da floresta e dos recursos naturais.
Palavras-chave: método de análise hierárquica (AHP), Delphi, produtos florestais não
CONTENTS
Acknowledgements ... I Abstract ... III Resumo ... IV Contents... VIII List of Figures ... X List of Tables ... XII List of Abbreviations ... XIII1. INTRODUCTION ... 1
1.1. Work scope ... 1
1.2. Objectives ... 3
1.3. Structure ... 4
2. STUDY CONTEXT AND KE Y CONCEPTS ... 5
2.1. The Analytic Hierarchy Process a multi-criteria decision-making approach ... 5
2.1.1. Phases of AHP ... 7
2.1.2. Implementation of AHP ...11
2.2. Delphi method ... 20
2.2.1. Characteristics of the Delphi method ...21
2.2.2. Phases of Delphi ...22
3. D AT A AND METHODS ... 26
3.1. Study area ... 26
3.1.1. Geographic context ...26
3.1.2. Social and economic context ...27
3.1.3. Forest context ...27
3.2. Non-wood forest products ... 29
3.2.1. Boletus ...30
3.2.2. Cork ...30
3.2.3. Pine nuts ...31
3.2.5. Yellow lavender ...32
3.2.6. Honey ...33
3.2.7. Rabbit ...33
3.3. Analytic Hierarchy Process application ... 34
3.3.1. Structuring the problem ...34
3.3.2. Expert panel ...38
3.3.3. Stakeholders participation process for regional weightings ...39
3.3.4. Domain experts participation process for non-wood forest products ranking ...40
4. RESULTS ... 42
4.1. Criteria and sub-criteria ... 42
4.2. Alternatives ... 45
4.3. Synthesis analysis... 49
5. DISCUSSION AND CONCL USIONS ... 53
REFERENCES ... 57
APPENDICES ... 64
Appendix 1. Criteria (C) and Sub-criteria (SC) of AHP structure ... 64
Appendix 2. Files sent to stakeholders (first round)... 69
Appendix 3. Files sent to stakeholders (second round) ... 82
Appendix 4. Files sent to stakeholders for support the pairwise comparisons ... 86
LIST OF FIGURES
Figure 1. Products of the forests ... 1
Figure 2. The decision hierarchy (a typical Analytic Hierarchy Process model) ... 8
Figure 3. The decision hierarchy for laptop buying decision ...11
Figure 4. Overall weights for laptop buying decision ...18
Figure 5. Main phases of Delphi implementation ...23
Figure 6. Geographic context of study area ...26
Figure 7. Land use and forest land of Alentejo region ...28
Figure 8. Distribution of tree species in Alentejo ...28
Figure 9. Boletus ...30
Figure 10. Cork oak stands and cork ...31
Figure 11. Stone pine stands and pine nuts ...31
Figure 12. Maritime pine stands and pine resin ...32
Figure 13. Yellow lavender ...32
Figure 14. Honey from Alentejo (produced in Serpa municipality) ...33
Figure 15. Rabbit ...33
Figure 16. Analytical Hierarchy Process highlighting goal, criteria and sub-criteria ...34
Figure 17. Example for pairwise comparison of alternatives (i.e. non-wood forest products) against Analytic Hierarchy Process sub-criteria ...36
Figure 18. AHP hierarchy for the goal "Identifying the most promising NWFPs" ...37
Figure 19. Distribution of stakeholders (regional experts) by type of work area ...38
Figure 20. Weights assigned to the sub-criteria of each criterion as a result of the stakeholder's valuation in the Delphi questionnaire ...43
Figure 21. Resulting weighting values for criteria and sub-criteria ...44
Figure 22. Ranking of non-wood forest products derived via pairwise comparisons across sub-criteria with respect to "Market potential" ...47
Figure 23. Ranking of non-wood forest products derived via pairwise comparisons across sub-criteria with respect to "Institutional potential" ...47
Figure 24. Ranking of non-wood forest products derived via pairwise
comparisons across sub-criteria with respect to "Requirements" ...48
Figure 25. Ranking of non-wood forest products derived via pairwise
comparisons across sub-criteria with respect to "Resource potential" ...48
Figure 26. Overall performance of non-wood forest products in Alentejo ...50 Figure 27. Relative importance of non-wood forest products in each criterion
(normalised to one) ...50
Figure 28. Rankings and individual performances of selected non-wood forest
products across criteria under a) "equal weights" and b) "weighted
LIST OF TABLES
Table 1. The fundamental scale of absolute numbers ... 9
Table 2. Pairwise comparison values (relative scores) ...12
Table 3. Decision matrix ...12
Table 4. Preferences of the criteria ...13
Table 5. Sum of each column...13
Table 6. Normalised pairwise matrix ...14
Table 7. Weights of criteria ...14
Table 8. Consistency vector ...15
Table 9. Consistency ratio ...15
Table 10. Values of the random index for different values of n ...16
Table 11. Battery scores from each model ...17
Table 12. Weights of each model related to battery scores ...17
Table 13. Memory scores from each model ...17
Table 14. Weights of each model related to memory scores ...17
Table 15. Hard disk scores from each model ...18
Table 16. Weights of each model related to hard disk ...18
Table 17. Final rating for each model ...19
Table 18. Non-wood forest products selected for Alentejo region by category ...29
Table 19. Criteria and sub-criteria ...35
Table 20. Scale of criteria comparison ...41
Table 21. Ranking of criteria in line to the weights assigned according to the level of importance ...42
Table 22. Consistency ratio of alternatives pairwise comparisons for each sub-criterion ...46
Table 23. Ranking of non-wood forest products in line to the pairwise comparisons assigned according to the level of importance ... 49
LIST OF ABBREVIATIONS
AHP - Analytic Hierarchy Process CI - Consistency Index
CR - Consistency Ratio
FAO - Food and Agriculture Organization of the United Nations GDP - Gross Domestic Product
GVA - Gross Value Added
MCDM - Multi-Criteria Decision Making
NUTS - Nomenclature of Territorial Units for Statistics NWFPs - Non-Wood Forest Products
1. INTRODUCTION
1.1. WORK SCOPE
The interest in non-wood forest products (NWFPs), i.e. products of biological origin other than wood derived from forests, other wooded land and trees outside forests (FAO, 1999), has increased in recent years. They have thus become an important topic of research. Moreover, they are also a very important element for sustainable forest management and to environmental objectives, including the conservation of biological diversity. NWFPs are considered as important means to the sustainability of the bio-economy and for business diversification, especially in regions where wood-based products are not the most profitable product. NWFPs may be gathered from the wild, or produced in forest plantations, agro-forestry schemes and from trees outside forests. At present, at least 150 NWFPs (plant and animal species) are significant in terms of international trade, including honey, cork, nuts, mushrooms, resins, essential oils, and plant and animal parts for pharmaceutical products (FAO, 2016). In this study we target the NWFPs of plants, fungi and fauna origin as described in the FAO forest product classification (Figure 1).
Source: FAO (1999) in Wong & Prokofieva (2014), modified Figure 1. Products of the forests
The latest report on the state of Europe’s forests (FOREST EUROPE, 2015) reported that the total value of NWFPs in the Forest Europe region – considerably incompletely reported – was estimated at EUR 2.277 million, of which 73% was accounted by marketed plant products and 27% by marketed animal products. This value represents about 12% of the value of roundwood, which is significant considering the deficiencies in data collection. Thus, there seems to be a high latent potential to strengthen the economic viability of rural economies via advancing the NWFP-focused forest management and related business (Huber et al., 2015). However, unlocking the full potential of NWFPs requires new knowledge and tools to optimise the sustainable provision and profitability of NWFPs, for a better understanding of the potential of markets for NWFP and of the role of innovation processes for new products and services (Wong & Prokofieva, 2014).
In this respect, there is a need to design a decision support application for the demands of extension service providers (e.g. forest owners’ associations, forestry consultants, researchers) in order to give advice to forest owners on which products to focus upon. Forest owners are considered as specifically relevant for the sustainable management of NWFPs, thus they represent the main target audience (Huber et al., 2015).
In this context, the expert model approach, which was developed by Huber et al. (2015) and applied in this dissertation, aims to provide a tool to support forest owners with regard to the co-production of wood and non-wood forest products in order to:
i. Diversify their product portfolio.
ii. Distribute related socio-economic risks. iii. Contribute to biodiversity conservation.
iv. Attract other forest owners to engage in new NWFPs businesses and foster the sustainable management of forest resources.
The study area to assess the regional, relevant NWFPs was Alentejo, located in southern Portugal. In the model we used the Analytic Hierarchy Process (AHP), one of many multi-criteria decision making methods, and a Delphi approach to support judgments collected from stakeholders (regional experts) and domain experts. The Delphi panel was composed of Portuguese stakeholders from the StarTree project. The Delphi method was used to gather expert judgments of the AHP hierarchy. This method is one of the few methods that can analyse qualitative data and is primarily used to facilitate the consensual formation of group opinions, identifying patterns accordingly.
AHP, developed by Saaty (1980), is a mathematical method for analysing complex decisions with multiple criteria. Human judgments, and not just numeric information, can be used in decision-making. AHP uses mathematical algorithms to transform qualitative subjective judgments into quantitative data (weights). The AHP is one of the sets of methodologies for assessing and allocating weights and priorities. That particular characteristic makes it an interesting alternative to quantitative techniques (Hartwich, 1999), particularly in the field of forestry research where there are complex decision structures related to multiple criteria. When applying AHP, a hierarchical decision schema is constructed by decomposing the decision problem into its decision elements. The importance or preferences of the decision elements are compared in a pairwise manner with regard to the element preceding them in the hierarchy (Kurttila et al., 2000). AHP is a decision analysis technique that uses judgments from a group of relevant decision makers/experts along with hierarchical decomposition of a problem to derive a set of ratio-scaled measures for decision alternatives (Hartwich, 1999). The work of this dissertation is a part of a modelling framework designed and developed by Huber et al. (2015) and applied at six study areas in five European countries (Austria, Finland, Portugal, Romania and Spain). This study was developed under the project StarTree "FP7 Project no. 311919 KBBE.2012.1.2-06 StarTree – Multipurpose trees and non-wood forest products a challenge and opportunity".
1.2. OBJECTIVES
The main goal of this dissertation is to apply a methodology based on the AHP and the Delphi approach that will provide a ranking of seven NWFPs in Alentejo and thus, to get an estimation of their potential for forest owners. In order to give consistency to the analysis and structuring of the decision components, we will:
1. Structure the decision problem for analysis in the following AHP hierarchy: goal –
criteria – sub-criteria – alternatives.
2. Use the Delphi approach to incorporate the regional experts’ (stakeholders)
judgments for criteria and sub-criteria.
3. Apply the AHP pairwise comparisons for alternatives (NWFPs selected) to reflect the
The more detailed research questions of this dissertation are: What are the most promising NWFPs in Alentejo?
What are the most important criteria to define the potential of NWFPs according to the experts?
Is the NWFPs ranking influenced by the weights of criteria?
1.3. STRUCTURE
The dissertation consists of five chapters. A brief description of each chapter is given in this section:
1. Introduction: introduces a general description of the research background, research aim and objectives.
2. Study context and key concepts: presents a literature review of the AHP and the Delphi method. The chapter explores the concepts and definitions, the benefits and the implementation phases of each method.
3. Data and Methods: presents the study area and the NWFPs selected, its characterisation, the structure of the problem, data collection and procedures for implementation of AHP and Delphi.
4. Results: presents the data collected and the research results.
5. Discussion and Conclusions: summarises the thesis and presents the main findings of the research. The chapter also highlights contributions to knowledge and recommends particular areas for future research.
2. STUDY CONTEXT AND KEY CONCEPTS
2.1. THE ANALYTIC HIERARCHY PROCESS A MULTI-CRITERIA
DECISION-MAKING APPROACH
We are all fundamentally decision makers. Everything we do consciously or unconsciously is the result of some decision-making process. The information we gather is to help us understand occurrences, in order to develop good judgments to make decisions about these occurrences. Not all information is useful for improving our understanding and judgments (Saaty, 2008a).
A decision is a choice from at least two distinct alternatives. Decision making, on the other hand, can be defined to include the whole process from problem structuring to choosing the best alternative (Kangas et al., 2008). Decision making, for which we gather most of our information, has become a mathematical science (Figuera et al., 2005).
To make a decision we need to know the problem, the need and purpose of the decision, the criteria of the decision, the sub-criteria, stakeholders and other groups affected, and the alternative actions to take. We then try to determine the best alternative, or in the case of resource allocation, we need priorities for the alternatives to allocate their appropriate share of the resources (Saaty, 2008a).
Multi-criteria decision-making (MCDM) refers to making decisions in the presence of multiple criteria and plays a critical role in many real life problems. It is not an exaggeration to argue that almost any local government, industry, or business activity involves, in one way or the other, the evaluation of a set of alternatives in terms of a set of decision criteria. Very often these criteria are in conflict with each other. Even more often, the pertinent data are very expensive to collect (Triantaphyllou & Mann, 1995).
There are many methods available for solving MCDM problems. One of the most used methods for making multi-criteria decisions is the Analytic Hierarchy Process or AHP. It was developed to optimise decision making when one is faced with a mix of qualitative, quantitative, and often conflicting factors and criteria (Alexander, 2012). With the use of the AHP, objective information, expert knowledge and subjective preferences can be considered jointly and simultaneously. It can also take into consideration qualitative criteria, while other methods usually require quantitative values for the selection of the alternatives (Sporcic, 2012). AHP supports collaborative decision making and has been very effective in making complicated, often irreversible, decisions.
The drawback of AHP is related to the number of alternatives to consider. With increasing numbers of objectives and alternatives to evaluate, the additional cognitive burden will contribute to increase the risk for inconsistent judgments (Kangas and Kangas, 2005; Korosuo et al., 2011; Nordström et al., 2010). This may constrain its application to complex forest ecosystem management planning problems that usually have a continuous character and where the number of possible alternatives is consequently very large (Borges et al. in review). Nevertheless, this dissertation addresses a problem – identification of most promising NWFPs in Alentejo – that is associated with a limited number of alternatives (NWFPs). AHP is thus very well suited to address it.
The AHP, originally developed by Saaty (1980), represents an approach that depends on the values and judgments of individuals and is widely used in decision making, operations research, quality engineering, planning and resource allocation, and conflict resolution (Saaty, 2001), as well as in natural resource management. According to Kangas et al. (2008) there are many researchers who have used AHP in forestry applications, e.g. Mendoza et al. (1987); Murray & von Gadow (1991), among others. And the number of applications is continuously increasing, e.g. Rauscher et al. (2000); Vacik & Lexer (2001); Huber et al. (2015). In natural resource management, the AHP has been most frequently applied to planning at the strategic level (Kangas, 1999). AHP has also gained interest among forestry practitioners (Kangas et al., 2008).
In the AHP technique, analytic indicates that the problem is broken down into its constitutive elements; hierarchy indicates that a hierarchy of the constitutive elements is listed in relation to the main goal; process indicates that data and judgments are processed to reach the final result. The basic principle is to decompose the decision problem into a hierarchy of more easily understandable sub-problems (Ávila et al., 2015).
AHP allows decision makers to model a complex problem in a multi-level hierarchical structure showing the relationships of the goal, criteria, sub-criteria, and alternatives (Forman & Selly, 2001). The decision makers can incorporate both objective and subjective, qualitative and quantitative considerations in the decision process. Uncertainties and other influencing factors can also be included. Saaty (1990) explains that this structure serves two purposes: a) it provides an overall view of the complex relationships inherent in the situation; and b) it helps the decision maker to assess whether the issues in each level are of the same order of magnitude, in order to compare such homogeneous elements accurately.
The pertinent data are derived by using a set of pairwise comparisons between each pair of items expressed as a matrix. These comparisons are used to obtain the weight of importance of the decision criteria, and the relative performance measures of the alternatives in terms of each individual decision criterion (Triantaphyllou & Mann, 1995). By reducing complex decisions to a series of pairwise comparisons, and then synthesising the results, the AHP helps to capture both subjective and objective aspects of a decision. In addition, the AHP incorporates a useful technique for checking the consistency of the decision maker’s evaluations, thus reducing any bias in the decision making process (Mocenni, 2016). The final results provide a cardinal ranking of alternatives, including their relative priorities (Huber et al., 2015).
2.1.1. Phases of AHP
To make a decision in an organised way to generate priorities using the AHP to address decision problems, we need to decompose the decision into the following phases (Bhushan & Rai, 2004; Saaty, 2008a; Kangas et al., 2008; Alexander, 2012):
Phase 1. Define the problem and state the goal or objective; determine the kind of
knowledge sought.
Phase 2. Decompose the original decision problem into a hierarchy of interrelated decision
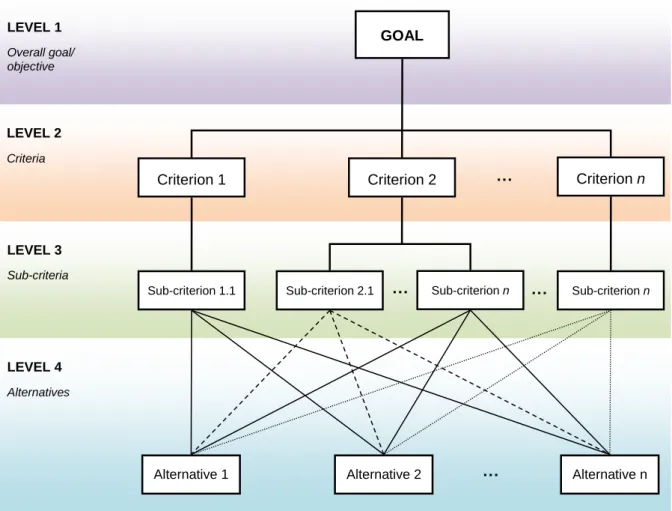
elements by structuring the decision hierarchy (Figure 2) from the top with the goal of the decision, then the objectives from a broad perspective, through the intermediate levels (criteria on which subsequent elements depend) to the lowest level (which usually is a set of alternatives). This is the most creative and important part of decision making.
Figure 2. The decision hierarchy (a typical Analytic Hierarchy Process model)
Phase 3. Construct a set of pairwise comparison matrices. Pairwise comparisons are
made at each level of the hierarchy. Each element in an upper level is used to compare the elements in the level immediately below with respect to it. In making the comparison, the question is: which of the two factors has a greater weight in decision making, and how much greater? Or which of the two decision alternatives is preferred with regard to a certain decision attribute?
To make comparisons we need a scale of numbers. This indicates how many times more important or dominant one element is over another element, with respect to the criterion or property in relation to which they are compared. Saaty (2008a, 2008b) defined a scale of absolute numbers to make comparisons (Table 1).
LEVEL 3 Sub-criteria LEVEL 2 Criteria LEVEL 1 Overall goal/ objective LEVEL 4 Alternatives Criterion 2 Criterion n Alternative 1 GOAL Alternative 2 Alternative n Criterion 1
Sub-criterion 1.1 Sub-criterion 2.1 Sub-criterion n
…
Sub-criterion n
…
… …
Table 1. The fundamental scale of absolute numbers
INTENSITY OF
IMPORTANCE DEFINITION EXPLANATION
1 Equal importance Two activities contribute equally to the objective
2 Weak or slight Between Equal and Moderate
3 Moderate importance Experience and judgment slightly favour one activity over another
4 Moderate plus Between Moderate and Strong
5 Strong importance Experience and judgment strongly favour one activity over another
6 Strong plus Between Strong and Very strong
7 Very strong or demonstrated
importance
An activity is favoured very strongly over another; its dominance demonstrated in practice
8 Very, very strong Between Very strong and Extreme
9 Extreme importance
The evidence favouring one activity over another is of the highest possible order of affirmation
Reciprocals of above
If activity i has one of the above non-zero numbers assigned to it when compared with activity j, then
j has the reciprocal value when
compared with i.
A logical assumption
(e.g. if x is 5 times y, i.e. x = 5y, then
y = x/5 or y = 1/5x)
1.1 - 1.9
When activities are very close a decimal is added to 1 to show their difference as appropriate
Perhaps a better way than assigning the small decimals is to compare two close activities with other widely contrasting ones, favouring the larger one a little over the smaller one when using the 1-9 values.
Phase 4. Calculate the ratings for the decision alternatives based on the relative
weights of the decision elements until the final choice is made. Use the priorities obtained from the comparisons to weigh the priorities in the level immediately below. Do this for every element. Then for each element in the level below add its weighed values and obtain its overall or global priority. Continue this process of weighing and adding until the final priorities of the alternatives in the bottom-most level are obtained.
The higher the weight the more important the corresponding criterion: after the comparison matrix is formed, the AHP generates a weight for each evaluation criterion according to the decision maker’s pairwise comparisons of the criteria (technically, this list is called an eigenvector).
The higher the score, the better the performance of the alternative with respect to the considered criterion: for a fixed criterion, the AHP assigns a score to each alternative according to the decision maker’s pairwise comparisons of the alternatives based on that criterion.
The global score for a given alternative is a weighted sum of the scores it obtained with respect to all the criteria: the AHP combines the criteria weights and the alternatives’ scores, thus determining a global score for each alternative, and a consequent ranking.
Phase 5. Evaluate and check the consistency of judgments.
Comparisons made by this method are subjective and the AHP tolerates inconsistency through the amount of redundancy in the approach. If this consistency index fails to reach a required level, then answers to comparisons may be re-examined. AHP provides a measure of the inconsistency in each set of judgments. This is calculated by a consistency index (CI) and a consistency ratio (CR) to measure how consistent the judgments have been relative to large samples of purely random judgments.
If the CR is considerably in excess of 0.10, the judgments are untrustworthy because they are too close for comfort to randomness, and the exercise is valueless or must be repeated. In that case we need to consider revising our subjective judgments. Inconsistency itself is important because without it, new knowledge that changes preferences cannot be admitted.
2.1.2. Implementation of AHP
In this subsection we illustrate the implementation of the AHP in detail, supported in the literature (Triantaphyllou & Mann, 1995; Kangas et al., 2008; Bunruamkaew, 2012; Haas & Meixner, 2015; Mocenni, 2016; IHU, 2016). For that purpose we use a simple multi-criteria decision problem. This illustration is meant to facilitate the reading of the dissertation by students and researchers who have not been exposed yet to the development and implementation of the AHP multi-criteria approach.
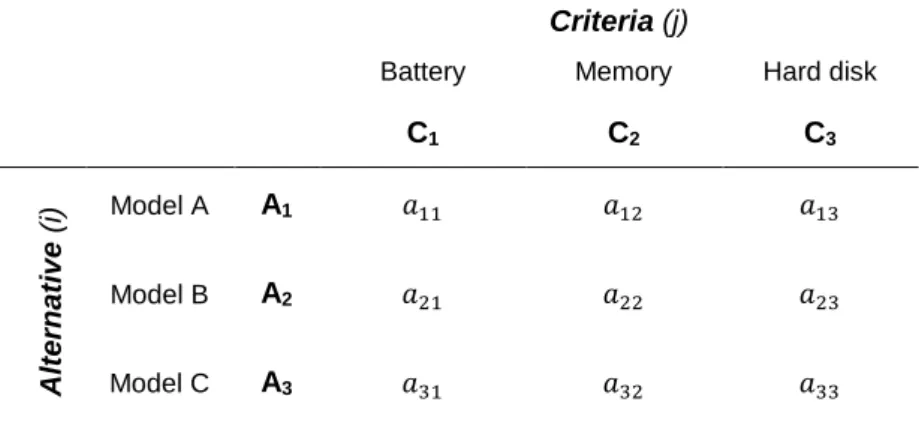
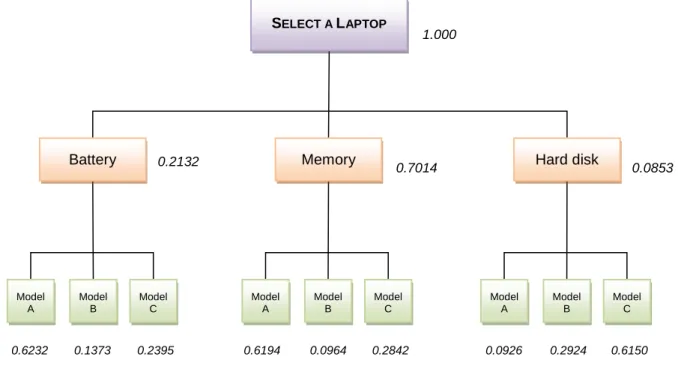
Problem: A decision maker wants to buy a laptop. There are a significant number of different
models available to choose from. After extensive market research he chooses three different models (A, B and C) that fulfil his needs. The different models are the alternatives. Regarding the laptop preferences, the most important features for him are the battery life, RAM/memory and hard disk (this is the criteria).
1. Model the problem into a hierarchical structure. We construct the AHP hierarchy
(Figure 3) with the goal, the criteria and the alternatives of our problem.
Figure 3. The decision hierarchy for laptop buying decision
G oal Cri te ri a Al te rn a ti v e s
Memory Hard disk
Model A SELECT A LAPTOP Model B Model C Model A Model B Model C Model C Model B Model A Battery
2. Define the relative importance of the criteria. Comparing each possible pair of criteria
and ranking those on the following scale (see Table 1, page 9; Table 2): comparing criterion i and criterion j, give a value 𝑎𝑖𝑗 with following meaning:
Table 2. Pairwise comparison values (relative scores)
VALUE OF aij INTERPRETATION
1 i and j are equally important
3 i is moderately more important than j
5 i is strongly more important than j
7 i is very strongly more important than j
9 i is extremely more important than j
Source: IHU (2016)
Each alternative can be evaluated in terms of decision criteria and the relative importance (weight) of each criterion can be estimated as well. Consider a matrix of pairwise comparison values 𝑎𝑖𝑗 (i=1, 2, 3 and j=1, 2, 3) and structure the problem in a decision matrix (Table 3).
Table 3. Decision matrix
Criteria (j)
Battery Memory Hard disk
C1 C2 C3 Alt er n ativ e ( i) Model A A1 𝑎11 𝑎12 𝑎13 Model B A2 𝑎21 𝑎22 𝑎23 Model C A3 𝑎31 𝑎32 𝑎33
The matrix is required to be reciprocal, i.e. in the matrix if 𝑎𝑖𝑗 is m then 𝑎𝑗𝑖= 1
𝑚. This means
that if alternative i is twice as good as j, then j has to be half (1/2) as good as i. Each alternative is then indifferent to itself, i.e. when i = j, 𝑎𝑖𝑗 = 1, so the diagonal elements of the
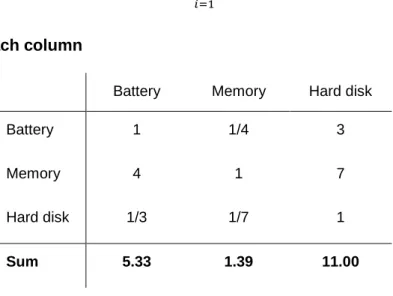
Now we compare the criteria in pairs and rate all the criteria with respect to the goal of the problem. For estimating the priorities, the matrix of pairwise comparisons is constructed for each set of comparisons (Table 4).
Table 4. Preferences of the criteria
Battery Memory Hard disk
Battery 1 1/4 3
Memory 4 1 7
Hard disk 1/3 1/7 1
3. Normalise the priority matrix. This is made by dividing each element by the sum of the
column in which it appears. Then we compute an eigenvector (also called a priority vector or weights) that represents the relative ranking of importance (or preference) attached to the criteria or objects being compared.
a. Sum the values in each column of the pairwise matrix (Table 5):
𝑎𝑖𝑗= ∑ 𝑎𝑖𝑗 𝑛
𝑖=1
Table 5. Sum of each column
Battery Memory Hard disk
Battery 1 1/4 3
Memory 4 1 7
Hard disk 1/3 1/7 1
Sum 5.33 1.39 11.00
b. Divide each element in the matrix by its column total to generate a normalised
pairwise matrix. The sum of each column is one (Table 6):
𝑋𝑖𝑗=
𝑎𝑖𝑗
For example, 𝑎11 (Table 4) entry would end up as: 𝑎11= 1 1 + 4 +13 = 1 1 + 4 + 0.333= 0.1875
Table 6. Normalised pairwise matrix
Battery Memory Hard disk Sum
Battery 0.1875 0.1795 0.2727 0.6397
Memory 0.7500 0.7179 0.6364 2.1043
Hard disk 0.0625 0.1026 0.0909 0.2560
Sum 1.0000 1.0000 1.0000 3.0000
c. Divide the sum of the normalised row of matrix by the number of criteria used (in this
example
n
=3) to generate a matrix with the weights of the criteria (Table 7):𝑊𝑖𝑗=
∑𝑛𝑗=1𝑋𝑖𝑗
𝑛
Table 7. Weights of criteria
Battery Memory Hard disk Weights 1 (eigenvector) Battery 0.1875 0.1795 0.2727 0.2132 Memory 0.7500 0.7179 0.6364 0.7014 Hard disk 0.0625 0.1026 0.0909 0.0853 Sum 1.0000 1.0000 1.0000 1.0000
We concluded that 70% of the criterion weight is on memory, about 21% is on battery and 9% is on hard disk (Table 7). It is clear that the decision maker prefers the memory over the battery life and hard disk.
1Normalized inputs (priority vector)
4. Checking the consistency. This can be achieved by the approximation of the
consistency index (CI) and the consistency ratio (CR).
Consistency Index (CI)
a. Calculate the consistency vector,
Cv
ij (Table 8), by multiplying each column of thepairwise comparison matrix (Table 5) by the corresponding weight (Table 7): For example,
Cv
11entry would end up as:(1×0.2132) + (1/4×0.7014) + (3×0.0853) = 0.6446
Table 8. Consistency vector
Battery Memory Hard disk Weights (eigenvector) Consistency vector Battery 1 1/4 3 0.2132 0.6446 Memory 4 1 7 x 0.7014 = 2.1517 Hard disk 1/3 1/7 1 0.0853 0.2566
b. Divide the weighted sum vector (consistency vector) by the criterion weight (Table 9):
For example,
Cv
11entry would end up as:0.6446 ÷ 0.2132 = 3.0228
Table 9. Consistency ratio
Consistency vector Weights (eigenvector) Consistency ratio Battery 0.6446 0.2132 3.0228 Memory 2.1517 : 0.7014 = 3.0675 Hard disk 0.2566 0.0853 3.0075 Sum 3.0528 1.0000 9.0977
c. The eigenvalue (
λ
) is calculated by averaging the value of the consistency vector,Cv
ijλ
= average (9.0977) = 3.0326d. CI measures the deviation:
𝐶𝐼 =𝜆 − 𝑛 𝑛 − 1
where:
n
=dimension of matrix (number of criteria); in this examplen
=3:𝑪𝑰 =𝜆 − 3 3 − 1= 3.0326 − 3 3 − 1 = 0.0326 2 = 𝟎. 𝟎𝟏𝟔𝟑 Consistency Ratio (CR)
e. Divide CI value by the random index (RI). The RI is given in Table 10 (in this example
n
=3, soRI
=0.58). Allowable CR should be no more than about 0.10 (Saaty, 2008a).𝑪𝑹 =𝐶𝐼 𝑅𝐼=
0.0163
0.58 = 𝟎. 𝟎𝟐𝟖𝟏
Table 10. Values of the random index for different values of n
n 1 2 3 4 5 6 7 8 9
RI 0 0 0.58 0.89 1.11 1.25 1.35 1.40 1.45
Source: Saaty (2008b)
For the criteria of these example the consistency measures are: CI=0.016 and CR=0.03; we concluded that the matrix is consistent.
5. Evaluate all the alternatives (laptop models) on each of the criterion (laptop features). Again we normalised the scoring table (for each criterion) dividing each
element by the sums of the columns, and by the average across rows to get the relative weights of each model regards to criterion.
For the decision maker battery life of Model A is longer than that of Model B, and the battery of Model C is slightly longer than Model B. The evaluation of alternatives by the decision maker for each criterion is in following matrices: battery (Table 11 and Table 12), memory (Table 13 and Table 14) and hard disk (Table 15 and Table 16). Analysing all matrices we conclude that Model A is the best for battery life (the weight is 62%) and for memory (the weight is 62%). For hard disk Model C is the one with higher weight (62%).
Table 11. Battery scores from each model
Model A Model B Model C
Model A 1 4 3
Model B 1/4 1 1/2
Model C 1/3 2 1
Table 12. Weights of each model related to battery scores
Model A Model B Model C Weights
Model A 0.6316 0.5714 0.6667 0.6232
Model B 0.1579 0.1429 0.1111 0.1373
Model C 0.2105 0.2857 0.2222 0.2395
CI=0.009 and CR=0.02 (matrix consistent)
Table 13. Memory scores from each model
Model A Model B Model C
Model A 1 5 3
Model B 1/5 1 1/4
Model C 1/3 4 1
Table 14. Weights of each model related to memory scores
Model A Model B Model C Weights
Model A 0.6522 0.5000 0.7059 0.6194
Model B 0.1304 0.1000 0.0588 0.0964
Model C 0.2174 0.4000 0.2353 0.2842
Table 15. Hard disk scores from each model
Model A Model B Model C
Model A 1 1/3 1/7
Model B 3 1 1/2
Model C 7 2 1
Table 16. Weights of each model related to hard disk
Model A Model B Model C Weights
Model A 0.0909 0.1000 0.0870 0.0926
Model B 0.2727 0.3000 0.3043 0.2924
Model C 0.6364 0.6000 0.6087 0.6150
CI=0.001 and CR=0.00 (matrix consistent)
6. Place all the overall weights on the hierarchy model. This analysis demonstrates
how much of each element in the model counts in the final decision.
Figure 4. Overall weights for laptop buying decision
Memory Hard disk
Model A SELECT A LAPTOP Model B Model C Model A Model B Model C Model C Model B Model A Battery 1.000 0.6232 0.1373 0.2395 0.6194 0.0964 0.2842 0.0926 0.2924 0.6150 0.2132 0.7014 0.0853
7. Get final rankings for each laptop model. The rating of each alternative is multiplied
by the weights of the criteria and aggregated to get local ratings with respect to each alternative.
For example, for Model A the rating is (Table 17):
(0.623×0.213) + (0.619×0.701) + (0.093×0.085) = 0.133 + 0.434 + 0.008 = 0.575
Table 17. Final rating for each model
Battery Memory Hard disk Criteria ranking Final ranking Model A 0.623 0.619 0.093 0.213 0.575 Model B 0.137 0.096 0.292
×
0.701=
0.122 Model C 0.239 0.284 0.615 0.085 0.303We concluded that Model A is the one with highest ranking, as it fits 57.5% of the needs of the decision maker compared with the other two models. The AHP produces weight values for each alternative based on the judged importance of one alternative over another with respect to a common criterion. The resulting weights or priorities represent the decision maker’s perception of the relative importance or preference of the elements at each level of the hierarchy.
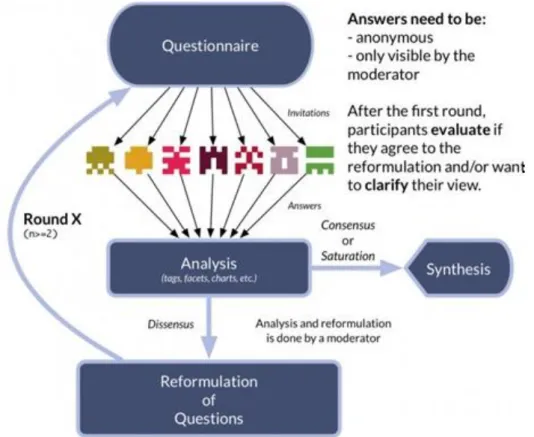
2.2. DELPHI METHOD
The Delphi method was first developed in the 1950s by Olaf Helmer, Nicholas Rescher, Norman Dalkey, and others at the Rand Corporation (Gordon, 1994). The intent of the Delphi, as it was originally conceived, was to create a method, using expert opinions, to forecast long-range trends related to the military potential of future science and technology and their effects on political issues (Somerville, 2008). This method has been applied in various fields such as programme planning, needs assessment, policy determination, and resource utilisation (Hsu & Sandford, 2007).
Delphi is a prospective (also called foresight) method, a systematic interactive technique for obtaining information from a panel of independent experts without the need to meet face-to-face, in order to facilitate an efficient group dynamic process (Erpicum, 2016; von der Gracht, 2012). It is used to help identify issues, set goals and priorities, clarify positions and differences across groups, and identify solutions (Wolf & Kruger, 2010). As it is a procedure to identify statements (topics) that are relevant for the future, it reduces the tacit and complex knowledge to a single statement and makes it possible to make a judgment (Cuhls, 2004). One of the main applications of the Delphi technique is screening the items in operations research problems and of MCDM techniques (Habibi et al., 2014).
The Delphi method allows surveying a panel of experts in an iterative way. A typical Delphi survey consists of at least two rounds of questions. After each round, a moderator – or analyst – shall provide a synthesis that is used as a basis for the drafting of the following questionnaire, therefore allowing for a "controlled feedback" (Erpicum, 2016). Starting from the second round, the feedback given is about the results of previous rounds and the same experts assess the same matters once more, influenced by the opinions of the other experts (Cuhls, 2004).
Because the number of respondents is usually small, Delphi does not, and is not intended to, produce statistically significant results; in other words, the results provided by any panel do not predict the response of a larger population or even a different Delphi panel. They represent the synthesis of the opinions of the particular group – no more, no less (Gordon, 1994). In short, the method allows the best use of currently available formal and informal knowledge in a transparent and robust way (De Las Heras et al., 2007).
2.2.1. Characteristics of the Delphi method
The Delphi technique is a survey technique in order to facilitate an efficient group dynamic process. This is done in the form of an anonymous, written, multi-stage survey process, where feedback of group opinion is provided after each round (von der Gracht, 2012). There are four distinct characteristics of the Delphi method that are important to the process (Rowe & Wright, 2001; von der Gracht, 2012), as follows:
1. Anonymity
In Delphi studies, the participants usually do not know each other. Anonymity is guaranteed since the process is coordinated by a moderator. Questionnaires are filled in by the individuals and returned to the moderator, who then analyses the group response. The anonymity assures that:
Specious persuasion does not occur, since anonymity reduces the effect of dominant individuals;
There is no socio-psychological pressure on the experts;
Avoids unwillingness to abandon publicly expressed opinions. Respondents do not have to fear that they may lose face in the eyes of the group when changing a previously expressed opinion.
Surveys usually lead to higher response rates. Participants probably feel more comfortable giving estimates on uncertain issues in an anonymous form.
2. Iteration
The procedure is executed in a series of rounds. The judgments of the respondents are summarised by the facilitator and provided as feedback or basic information for the following round. The iteration of rounds, along with the provision of written feedback, reduces intentional and unintentional noise, such as irrelevant, non-productive, and potentially frustrating communication. In addition, this procedure permits social learning and the modification of prior judgments.
3. Controlled feedback
It is termed "controlled" because the facilitator decides on the type of feedback and its provision. After each Delphi round, the survey data is statistically analysed and re-stated in aggregated form.
4. Statistical "group response"
This can be presented either numerically or graphically, and usually comprises measures of central tendency (median, mean), dispersion (interquartile range, standard deviation), and frequency distributions (histograms and frequency polygons). In some Delphi applications, even comments of respondents are provided.
After reviewing the group statistics, each participant can decide whether to change his or her previous answer or to remain with his or her initial decision. If estimations strongly deviate from the group response, participants usually provide reasons for their unique evaluations of situations. This assures that only profound statements are given. Analysis of the data over successive rounds allows for measuring not only the existence of consensus and its strength, but also the convergence of opinions.
2.2.2. Phases of Delphi
The efficient structuring of a group communication process can be considered the primary goal of a Delphi study. The objective of the Delphi method is to reach consensus in opinions within a group of experts. The Delphi technique implementation includes different phases (Figure 5).
Source: Erpicum (2016)
Figure 5. Main phases of Delphi implementation
To have success with this technique it is important to devise a plan to follow up, identifying the guidelines for a good survey and a quality control, ensuring accurate results. According to recent literature (Rowe & Wright, 2001; De Las Heras et al., 2007; Somerville, 2008; Habibi et al., 2014) the main phases of Delphi implementation are the following:
Phase 1. Definition of the problem. Specify the topic to be investigated, which has a lack
of consensus and an imperfect knowledge about it.
Phase 2. Construction of a questionnaire for data collection. Ensuring the clarity of the
questionnaire. Key issues to keep in mind:
Make questionnaire statements clear, concise, free of ambiguities, and easily to understand by experts from varied backgrounds;
Provide clearly written instructions to panel members; Pre-test the questionnaire and survey procedures;
Provide experts with a brief account of the origin and purpose of the study.
Phase 3. Selection of experts (Delphi panel). This is one of the most important phases of
the method because the validity of the results depends on the competence and knowledge of the panel members.
Key issues to keep in mind:
Use experts with appropriate domain knowledge. How experts respond to Delphi feedback will depend upon the extent of their knowledge about the topic to be forecasted; this might, for example, affect their confidence in their own initial estimates and the weight they give to the feedback from anonymous experts. Use heterogeneous experts. We should choose experts whose combined
knowledge and expertise reflects the full scope of the problem domain. Heterogeneous experts are preferable to experts focused on a single speciality. Select panel members based on knowledge of the issue and diversity of perspective.
Use between five and 20 experts. The size of Delphi panels can vary widely. There is disagreement about what constitutes an appropriate panel size, although panel size clearly will have an impact on the effectiveness of the technique. Larger groups provide more intellectual resources than smaller ones but they also cause conflict, irrelevant arguments, and information overload more likely. With larger panels come greater administrative costs in terms of time and money. To maximise the use of human resources, it is desirable to limit the panel size.
Ensure that experts perceive that their contributions are valued.
Communicate to experts that they are members of a group with similar expertise to their own.
Provide enough incentive to maintain experts' motivation to persist to the conclusion of the study.
Phase 4. First Round Questionnaire. Send the questionnaire to experts. Use an
electronic version of the Delphi method, called the "e-Delphi". The time and expense of the process are reduced, data are electronically compiled, and more detailed information can be returned to participants.
Phase 5. Analysis of the first round responses. After gathering the experts' opinions,
one method for aggregating the subjective judgments of experts to produce a collective opinion is to simply average participants’ responses. Summarise the data resulting from this round. This questionnaire is used as the survey instrument for the second round of data collection.
Phase 6. Second Round Questionnaire. Send to each Delphi expert a second
questionnaire with the results of the first round, as feedback. Ask the experts to review the items summarised by the investigators based on the information provided in the first round.
Key issues to keep in mind:
Allow enough time between rounds to prepare and distribute feedback, but do not allow so much time that experts lose interest;
Take care to keep the intent of expert responses intact when reporting responses back to other panel members.
Phase 7. Analysis of the second round responses. The phase 6 is reiterated as long as
desired or necessary to achieve stability in the results.
Phase 8. Conclusion. Preparation of a report including the analysis, interpretation,
3. DATA AND METHODS
3.1. STUDY AREA
3.1.1. Geographic context
The study area, the Alentejo region (NUTS II - Nomenclature of Territorial Units for Statistics - PT18), is located in south of mainland Portugal (Figure 9); with a total area of 3,160,490 ha. It is the largest NUTS II Portuguese region spreading across 1/3 of the country’s territory. It encompasses the districts of Portalegre, Évora, Beja and part of the districts of Santarém, Lisboa and Setúbal, for a total of 58 municipalities/ counties (Figure 9) and 324 parishes (DGT, 2016). Alentejo is a relatively flat region with the exception of some small mountains, in particular the Serra de Castelo de Vide (762 m), Serra de Marvão (865 m), Serra Selada (823 m), Serra Fria (900 m) and Serra de São Mamede (1027 m), all located in the district of Portalegre and the Serra de Ossa (623 m), located in the district of Évora.
Location of the Alentejo region in mainland Portugal
Distribution of districts and counties in Alentejo
Source: DGT (2016)
The climate of the region is generally warm and temperate. The winters are rainier than the summers. This region is classified as Csa (temperate climate with warm and dry summer) by Köppen and Geiger. The average annual temperature is 14.5°C. About 1065 mm of precipitation falls annually (Climate-Data, 2016).
3.1.2. Social and economic context
The Alentejo region has 757,302 inhabitants (7.2% of the Portuguese population), which represents a very low population density, about 24.0 inhabitants /km2 - much lower than the
average population density of the country, which is 114.5 inhabitants/km2 (INE, 2012b). The
area is mainly privately owned.
The data on the regional statistics (INE, 2012a) reveal that in Alentejo, the tertiary sector is at the top of the gross domestic product (GDP) structure (about 64% of the total activity), in particular public administration services. The primary sector (agriculture and forest) accounts for 14% of the employed population. According to the Economic Regional Accounts (INE, 2016), in 2014 (preliminary values) the gross value added (GVA) in Alentejo amounted to 6.4% of the national GVA. Exports, in the same year, correspond to 6.0% of national exports, mainly to other member states of the European Union.
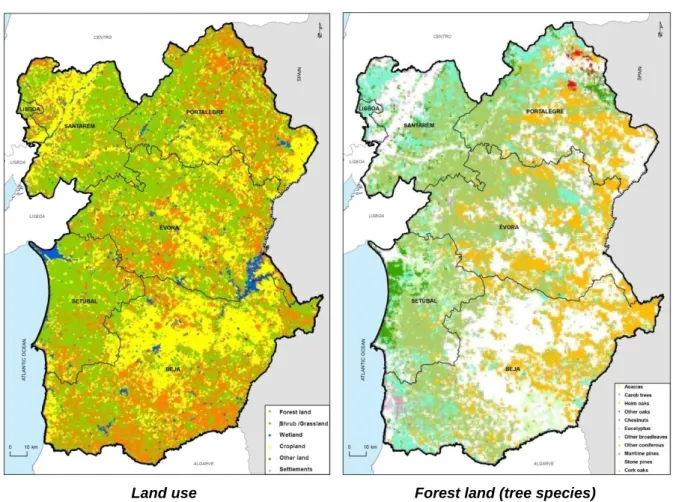
3.1.3. Forest context
In Alentejo the forest area extends for about 1.4 million ha (INE, 2015) corresponding to 43% of the region’s territory (Figure 7). The cork oak (Quercus suber) and holm oak (Quercus ilex) stands represent around 71% of the Alentejo forest area. These species may occur in pure or mixed composition, with different spacing and in even-aged or uneven aged stands. Eucalyptus (Eucalyptus globulus) plantations and stone pine (Pinus pinea) stands extend over about 15% and 9% of the forest area, respectively (Figure 8).
According to the last Portuguese National Forest Inventory - NFI6 (ICNF, 2013) - Alentejo was the only region in Portugal where the forest area increased (about 250 km2) from 1995
to 2010, mainly as a consequence of planting new cork oak and umbrella pine stands. These forest ecosystems provide wood and non-wood forest products as well as services such as carbon sequestration, nature conservation (biodiversity, geo-monuments), tourism and the protection of soil and water.