0095-1137/04/$08.00⫹0 DOI: 10.1128/JCM.42.12.5624–5635.2004
Copyright © 2004, American Society for Microbiology. All Rights Reserved.
Phylogeny and Evolution of Medical Species of Candida and
Related Taxa: a Multigenic Analysis
Stephanie Diezmann,
1,2* Cymon J. Cox,
1Gabriele Scho
¨nian,
3Rytas J. Vilgalys,
1and Thomas G. Mitchell
2Department of Biology, Duke University,1and Department of Molecular Genetics and Microbiology, Duke University
Medical Center,2Durham, North Carolina, and Institut fu¨r Mikrobiologie und Hygiene (Charite´ Hospital),
Humboldt Universita¨t, Berlin, Germany3
Received 2 March 2004/Returned for modification 2 April 2004/Accepted 13 August 2004
Hemiascomycetes are species of yeasts within the order Saccharomycetales. The order encompasses dispar-ate genera with a variety of life styles, including opportunistic human pathogens (e.g., Candida albicans), plant pathogens (e.g., Eremothecium gossypii), and cosmopolitan yeasts associated with water and decaying vegeta-tion. To analyze the phylogeny of medically important species of yeasts, we selected 38 human pathogenic and related strains in the order Saccharomycetales. The DNA sequences of six nuclear genes were analyzed by maximum likelihood and Bayesian phylogenetic methods. The maximum likelihood analysis of the combined data for all six genes resolved three major lineages with significant support according to Bayesian posterior probability. One clade was mostly comprised of pathogenic species of Candida. Another major group contained members of the family Metschnikowiaceae as a monophyletic group, three species of Debaryomyces, and strains of Candida guilliermondii. The third clade consisted exclusively of species of the family Saccharomycetaceae. Analysis of the evolution of key characters indicated that both codon reassignment and coenzyme Q9likely had single origins with multiple losses. Tests of correlated character evolution revealed that these two traits evolved independently.
The Ascomycota include three major groups, the monophy-letic Euascomycetes (molds), the Hemiascomycetes (yeasts), and the Archiascomycetes, which contains taxa that likely arose before the other lineages (35). According to the tax-onomic study of the yeasts by Kurtzman and Fell (23), the Hemiascomycetes comprise one large order, the Saccharomy-cetales, which was established in 1960 by Kudrjavzev (17). All members of this order are characterized by (i) no or only rudimentary hyphae, (ii) vegetative cells that proliferate by budding or fission, (iii) cell walls that lack chitin, and (iv) asci that are formed singly or in chains (17). Phylogenetic analyses of ribosomal DNA (rDNA) and RNA polymerase II (RPB2) gene sequences support a single evolutionary origin of the Saccharomycetales (1, 3, 29). However, to date, only a few representatives of the order have been included in molecular phylogenetic studies of the higher-level relationships among the Ascomycota.
The order Saccharomycetales contains many species of prac-tical importance and scientific interest, including several spe-cies that are pathogenic for humans, such as Candida
parapsi-losis, Candida tropicalis, and Candida albicans, which is the
most common human pathogenic fungus (4). Other species of the Saccharomycetales are exploited by industry to produce secondary metabolites and fermentative by-products (23). Dur-ing the translation of mRNA to polypeptides, several species of Candida exhibit alternative codon usage. The reassignment of the codon CUG from leucine to serine was first described
by Kawaguchi et al. (16) for Candida cylindraceae. Sugita and Nakase (44) applied phylogenetic methods to investigate rela-tionships among Candida species with alternative use of the CUG codon. They showed that only 11 of 78 species of
Can-dida used CUG as a codon for leucine. The remaining 67
species translated CUG as serine, but they did not form a monophyletic group. The authors suggested a correlation be-tween codon reassignment and coenzyme Q9(Co-Q9) as the
predominant ubiquinone in these species based on chemotax-onomy. Co-Q is a mitochondrial electron carrier with various numbers of isoprene units. The length of the isoprene chain is usually consistent within a monophyletic group (49) and has therefore been used in yeast taxonomy.
The order Saccharomycetales is purported to comprise 11 families and 55 genera (23). However, the family assignments of several genera of budding yeasts, e.g., Pichia and
Debaryo-myces, remain questionable (23). Because of a lack of
dis-tinctive morphological characters, molecular methods are in-valuable for clarifying the phylogenetic relationships among ascomycetous yeast species. Previous phylogenies were based on single genes (7, 21, 22), sampled only one family (25), or were restricted to the most common pathogenic species of
Candida (14, 30, 31, 50). The single-gene studies have focused
on the actin gene (ACT1) (7) or the large (26S rDNA) or small (18S rDNA) ribosomal subunit (21) and generally lacked good statistical support, especially for relationships along the back-bone of the trees. Relationships among different genera or families of the Saccharomycetales were rarely resolved. Re-cently, Kurtzman and Robnett (25) presented a multigene phy-logeny based on three nuclear rDNA genes (18S rDNA, 26S rDNA, and ITS [internal transcribed spacer]), three protein-coding genes (EF-1␣, ACT1, and RPB2), and two
mitochon-* Corresponding author. Mailing address: Department of Molecular Genetics and Microbiology, Duke University Medical Center, Dur-ham, NC 27710. Phone: (919) 684-2720. Fax: (919) 681-1035. E-mail: [email protected].
drial genes (small-subunit rDNA and COX2). This impressive study included 75 species but focused on members of the
“Sac-charomyces complex” and included only one pathogenic
spe-cies of Candida (25).
The major goal of the present study was to generate a multi-genic phylogeny of the families of Saccharomycetales that in-cluded the clinical and related species. We used maximum like-lihood inference and a Bayesian metropolis-coupled Markov chain Monte Carlo analysis to evaluate the statistical support for the observed evolutionary relationships. We used the phy-logeny to examine the evolution of alternative codon usage and isoprene chain length in Co-Q. Although others have correlat-ed these two traits (44), our extensive data set of DNA se-quences allowed the application of different statistical methods of character mapping, reconstruction of the ancestral character state, and evaluation of correlated character evolution. We used six nuclear genes (four encoding proteins, 18S rDNA, and 26S rDNA) and included 38 species from 5 of the 11 families recognized by Kurtzman and Fell (23). Several criteria guided the selection of strains: (i) a broad taxonomic sampling that included environmental and clinical isolates, (ii) taxa with dif-ferent Co-Q systems, and (iii) Candida species with reassigned codon usage. We selected strains that permitted each of these features to be analyzed independently and allowed evaluation of putative associations among them.
MATERIALS AND METHODS
Taxa and extraction of DNA.We sampled 38 strains, representing 11 genera and 5 families of the order Saccharomycetales (23). The identity, taxonomic classification, and source of each strain are listed in Table 1, which includes the GenBank accession numbers for the sequenced genes of each taxon. All fungi were cultured on yeast extract-peptone-dextrose (Difco) agar at room tempera-ture. Each strain was suspended in 400l of 2⫻ cetyltrimethyl ammonium bromide buffer, and genomic DNA was extracted as described by Gardes and Bruns (10) and stored at⫺20°C. Table 1 also lists the GenBank accession numbers of rRNA sequences of Schizosaccharomyces pombe and Neurospora
crassa, representative taxa of Euascomycetes and Archiascomycetes, which were
compared with species of Saccharomycetales to assess their monophyly. We also included two basidiomycetes to root the Ascomycota, Althelia bombacina and
Coprinus cinereus.
Amplification and sequencing of gene fragments.Using the primers indicated in Table 2, we amplified and sequenced a portion of the following genes from each taxon: actin (ACT1), elongation factor 2 (EF2), RNA polymerase B sub-unit (RPB1), small-subsub-unit rRNA (18S rDNA), and large-subsub-unit rRNA (26S rDNA). The resulting amplicons ranged in size from approximately 600 (EF2 and
ACT1) to 1,400 (26S rDNA) nucleotides. The PCR mixture consisted of 25l of 75 mM Tris-HCl (pH 8.0), 20 mM (NH4)2SO4, 1.5 mM MgCl2, 0.01% Tween 20, 7.5 pmol of each primer, 100M deoxynucleoside triphosphates, 1.0 U of Taq polymerase (Marsh), and 20 ng of genomic DNA. An initial denaturation at 95°C for 5 min was followed by 35 to 45 cycles in which the annealing occurred at 50°C (or 58°C for primers EFIIF1 and EFIIR2) for 30 s, elongation at 72°C for 45 s, denaturation at 95°C for 60 s, and a final extension for 10 min at 72°C. To amplify the 1.2-kb fragment of the RPB2 gene, we used the PCR protocol of Liu et al. (29). Amplicons were sequenced by using BigDye terminator chemistry with separation and detection carried out on an ABI 3700 (Applied Biosystems) automated sequencer.
Alignment of sequences and phylogenetic analyses. (i) Assembly and align-ment of DNA sequences.Sequence chromatograms were analyzed, assembled, and edited with Sequencher 4.1 (Gene Codes Corporation). After conversion to a FASTA format, the sequences of the EF2, ACT1, and RPB1 genes were automatically aligned by using the internet alignment program Multalin (6).
RPB2 and the rDNA genes were aligned by using ClustalW 1.81 (48). Each gene
alignment was imported into MacClade 4.05 (33) and manually edited. In addi-tion, the four protein-coding genes were aligned according to the superimposed amino acid sequences and the rDNA genes were aligned with reference to the secondary structure, as described by Kjer (19). Secondary structure models for
18S and 26S rRNA subunits for Saccharomyces cerevisiae were obtained from the comparative RNA website (5). These models were used as templates for coding and alignment of the entire data set. In all six data sets, ambiguously aligned characters were excluded from the phylogenetic analyses.
(ii) Tests for substitutions and saturation of codon positions.All three codon positions in the protein-coding genes were tested independently for saturation. This was achieved by plotting genetic distances in a two-parameter model (F84; described by Kishino and Hasegawa [18]) and the uncorrected p-distance esti-mates (20). Deviation from a 1:1 ratio of the two distances was visually evaluated.
(iii) Data set partitioning, maximum likelihood, and Bayesian analyses.To appropriately model nucleotide substitutions, the data set was partitioned in several ways. In addition to analyzing all the data together, we analyzed sepa-rately the data for each gene. Each of the four protein-coding genes was analyzed for differences in the first two codon positions and the third codon position. The sequence data were also partitioned into protein-coding and rDNA genes, and the resolving powers of these data sets were compared by using maximum likelihood.
We initially analyzed each gene of the Saccharomycetales data set by using MrBayes v3.0B4 (12). Each protein-coding gene was partitioned into two char-acter sets (first and second codon positions versus the third codon position), and the best-fitting evolutionary model was determined for each partition by using Modeltest 3.06 (40) (Table 3). Each Bayesian analysis consisted of six runs of 2,000,000 generations, each using the default, uniform priors, and a sample frequency of 100. Likelihood scores of each sampled generation were plotted by using Excel (Microsoft Corp.) and visually analyzed. The trees collected before the stationary phase of the chain was reached were discarded. The trees remain-ing from each of the six runs were combined, and a 95% consensus tree for each gene was generated by using PAUP* 4.0b10 (45). Consensus trees for the six different genes were then compared for topological congruence, as described by Kauff and Lutzoni (15). Taxa were considered to be in conflict when they showed different relationships in two genes, supported by posterior probabilities of ⱖ95%.
Maximum likelihood analyses were conducted on the combined data for Sac-charomycetales and Ascomycota and the protein-coding and rDNA genes with-in the Saccharomycetales, uswith-ing model parameter estimates obtawith-ined from Modeltest (Table 3). For each maximum likelihood analysis, a heuristic search was conducted using a maximum parsimony tree as the starting tree in PAUP* 4.0b10 (45). Starting trees were obtained by a parsimony analysis with 1,000 random taxon-addition replicates, saving 10 trees per replicate.
Maximum likelihood analyses were applied to the combined data for all the Saccharomycetales in a homogeneous analysis as described above. We also conducted two heterogeneous Bayesian analyses using the same search options and combined model settings that were used for the single-gene analyses. In the first heterogeneous analysis, each of the six genes was accommodated with a different model (Table 3) without consideration of different codon positions (“6-model analysis”). For the second heterogeneous analysis, separate models were applied to the combined first and second codon positions and to the third codon positions of the four protein-coding genes (“10-model analysis”); the 18S and 26S rDNA data sets were not further partitioned (Table 3). We also com-pared the protein-coding and rDNA genes in separate heterogeneous analyses. Different evolutionary models were applied to the codon positions in the com-bined protein-coding genes as described above (“8-model analysis”). The rDNA genes were analyzed with one model for the 18S rDNA and another for the 26S rDNA (“2-model analysis”).
A likelihood ratio test was used to test whether the heterogeneous model was a significant improvement over the homogeneous model and to determine which heterogeneous analysis best fit the Saccharomycetales data (8). The likelihood of the observed data and the degrees of freedom were calculated using PAUP* 4.0b10 (45) for the homogeneous analysis and p4 v. 0.80 (9) for the 6- and 10-model analyses. To assess whether the likelihood of the more complex model was a significant improvement, the likelihood ratio was compared to a2 distri-bution.
(iv) Reconstruction of the ancestral character states and testing for the cor-relation of character evolution.To study the evolutionary history of alternative codon usage and number of isoprene chain units in the Co-Q system within the Saccharomycetales, we reconstructed the ancestral character states of these traits. Data for translation of the CUG codon were obtained from the National Center for Biotechnology Information database (http://www.ncbi.nlm.nih.gov) and an earlier study by Sugita and Nakase (44) and scored as leucine (1) or serine (0). Information on the Co-Q system was gathered from Kurtzman and Fell (23), supplemented by the CBS database (http://www.cbs.knaw.nl). For the Co-Q system, we coded Co-Qs with nine isoprene units as 1 and Co-Qs with any other isoprene chain length as 0. Each trait was mapped under the likelihood criterion
TABLE 1. Taxa and DNA sequences used in this investigation a Order or group and family Species Strain(s) b GenBank accession no. c ACT1 EF2 RPB1 RPB2 18S rDNA 26S rDNA Saccharomycetales Candidaceae Candida albicans CBS 562 ⴱ AJ389057 AY497649† AY497718† AY497614† AY497754† AY497682† Candida albicans CBS 1905 AY497580† AY497639† AY497708† AY497604† AY497744† AY497673† Candida castellii CBS 4332 ⴱ AY497583† AY497647† AY497717† AY497612† AY497752† AY497680† Candida dubliniensis CBS 7987 AJ389058 AY497659† AY497730† AY497625† AY497766† AY497694† Candida glabrata CBS 138 ⴱ AJ389073 AY497636† AY497705† AY497601† AY497741† AY497670† Candida guilliermondii MMRL 1635 AY497592† AY497661† AY497732† AY497627† AY497768† AY497696† Candida guilliermondii MMRL 1636 AY497593† AY497662† AY497733† AY497628† AY497769† AY497697† Candida guilliermondii MMRL 1759 AY497594† AY497663† AY497734† AY497629† AY497770† AY497698† Candida intermedia CBS 572 ⴱ AY497584† AY497650† AY497719† AY497615† AY497755† AY497683† Candida maltosa CBS 5611 AY653540† AY653542† AY653536† AY653538† AY653544† AY653546† Candida norvegica CBS 4239 ⴱ AY497582† AY497646† AY497715† AY497611† AY497751† AY497679† Candida parapsilosis ATCC 96138 AY497589† AY497631† AY497700† AY497596† AY497736† AY497665† Candida parapsilosis ATCC 96140 AY497590† AY497632† AY497701† AY497597† AY497737† AY497666† Candida parapsilosis ATCC 96144 AY497591† AY497633† AY497702† AY497598† AY497738† AY497667† Candida parapsilosis CBS 604 ⴱ AY497585† AY497652† AY497722† AY497617† AY497758† AY497686† Candida tropicalis CBS 94 ⴱ AY497587† AY497660† AY497731† AY497626† AY497767† AY497695† Candida viswanathii CBS 4024 ⴱ AJ389061 AY497645† AY497714† AY497610† AY497750† AY497678† Candida zeylanoides CBS 619 ⴱ AJ389069 ND d AY497724† AY497619† AY497760† AY497688† Eremotheciaceae Eremothecium gossypii ATCC 10895 AY497588 AY497630 AY497699 AY497595 AY497735 AY497664 Metschnikowiaceae Clavispora lusitaniae CBS 6936 ⴱ AJ389065 AY497655† AY497726† AY497621† AY497762† AY497690† Clavispora opuntiae CBS 7068 ⴱ AJ389067 AY497656† AY497727† AY497622† AY497763† AY497691† Metschnikowia pulcherrima CBS 610 AJ389071 AY497653† AY497723† AY497618† AY497759† AY497687† Saccharomycetaceae Debaryomyces carsonii CBS 2285 ⴱ AY497581† AY497643† AY497712† AY497608† AY497748† AY497676† Debaryomyces etchellsii CBS 2011 ⴱ AJ389068 AY497641† AY497710† AY497606† AY497746† U45809 Debaryomyces hansenii CBS 767 AY497586† AY497658† AY497729† AY497624† AY497765† AY497693† Issatchenkia orientalis CBS 573 AJ389087 AY497651† AY497720† AY497616† AY497756† AY497684† Kluyveromyces lactis CBS 683 ⴱ AJ389080 AY497654† AY497725† AY497620† AY497761† AY497689† Kluyveromyces marxianus CBS 712 ⴱ AJ389078 AY497657† AY497728† AY497623† AY497764† AY497692† Lodderomyces elongisporus CBS 2605 AY653541† AY653543† AY653537† AY653539† AY653545† AY653547† Pichia fermentans CBS 1876 AJ389083 AY497638† AY497707† AY497603† AY497743† AY497672† Pichia guilliermondii CBS 2030 ⴱ AJ389063 AY497642† AY497711† AY497607† AY497747† AY497675† Pichia jadinii CBS 1600 ⴱ AJ389090 AY497637† AY497706† AY497602† AY497742† AY497671† Pichia membranifaciens CBS 107 ⴱ AJ389088 AY497634† AY497703† AY497599† AY497739† AY497668† Pichia norvegensis CBS 1922 AJ389085 AY497640† AY497709† AY497605† AY497745† AY497674† Saccharomyces cerevisiae CBS 1177 ⴱ AJ389075 AY497635† AY497704† AY497600† AY497740† AY497669† Saccharomyces kluyveri CBS 3082 ⴱ AJ389077 AY497644† AY497713† AY497609† AY497749† AY497677† Dipodascaceae Stephanoascus ciferrii CBS 4856 ⴱ ND AY497648† AY497718† AY497613† AY497753† AY497681† Yarrowia lipolytica CBS 599 ND ND AY497721† ND AY497757† AY497685† Outgroup for phylogenetic analysis of the Hemiascomycetes Schizosaccharomycetaceae Schizosaccharomyces pombe Y00447 D83976 X56564 D13337 L20414 U40085 Sordiariaceae Neurospora crassa U78026 AF258620 AABX01000048.1 AF107789 X04971 AF266411 Euascomycota Arthrodermataceae Arthroderma benhamiae AY083233.1 ND Arthroderma ciferrii AB015769.2 AB04068.1 Cochliobolus Curvularia brachyspora L36995 AF279380 Cudoniaceae Cudonia circinans AF1074343 AF279379 Discinaceae Gyromitra esculenta U42648 AY640952 Dothideaceae Dothidea insculpta U42474 AY640949 Gyalectaceae Gyalecta ulmi AF465464 AF465463 Herpotrichiellaceae Capronia pilosella U42473 AF279377 Continued on following page
TABLE 1— Continued Exophiala jeanselmei X80705 AF050271 Morchellaceae Morchella esculenta U42642 AF279398 Neolectaceae Neolecta irregularis Z47721 AF279401 Onygenaceae Ajellomyces capsulatus AF320009 AF071952 Coccidioides immitis M55627 AB040702 Paracoccidioides brasiliensis AF22751 U81263.1 Peltigeraceae Peltigera canina AF356681 AF286822 Peltulaceae Peltula obscurans AF356692 AF356693 Pezizaceae Peziza quelepidotia AY640999 AY640959 Rhytismataceae Rhytisma acerinum AF356695 AF356696 Rocellaceae Dendrographa minor AF279381 AF279383 Stereocaulaceae Stereocaulon paschale AF279412 AF279413 Taphrinaceae Taphrina pruni AB000956 Z49792 Trichocomaceae Aspergillus fumigatus AF397059.1 AJ438344 Emericella nidulans AB008403 AF109337 Hamigera avellanea D14406 AB000620 Penicillium chrysogenum AF411201.1 AF034857 Penicillium freii AY640998 AY640958 Penicillium viridicatum AY083222.1 AF003358.1 Umbilicariaceae Lasallia pensylvanica AF356664 AF356665 Valsaceae Diaporthe phaseolorum L36985 U47830 Verrucariaceae Dermatocarpon luridum AY640989 AY640948 Verrucaria pachyderma AF356667 AF356668 Xylariaceae Seynesia erumpens AF279409 AF279410 Outgroup for phylogenetic analysis of Ascomycota Corticiacaea Athelia bombacina M55638 AF279377 Psathyrellaceae Coprinus cinereus M92991 AF041494 aThe nomenclature was taken from Kurtzman and Fell (23) (Hemiascomycetes) or the National Center for Biotechnology Information TaxBrowser (Euascom ycota) (www.ncbi.nlm.nih.gov/Taxonomy/taxonomy -home.html). bATCC, American Type Culture Collection; CBS, Centraalbureau vor Schimmelcultures; MMRL, Medical Mycological Research Laboratory, Wiley Schell, Duke University Medical Center. ⴱ, type strain. c†, sequences were generated as part of this study. dND, no data available.
as implemented in Mesquite v. 1.02 (32) on the maximum likelihood tree of the Saccharomycetales, using inferred branch lengths. The likelihood of the observed character state distributions was calculated by using two models: a one-param-eter Markov k-state model (27), which is a generalization of the Jukes-Cantor model (13), and an asymmetrical two-parameter Markov k-state model, which allows two different rates of change (forward and reverse) (36). A likelihood ratio test (8) was applied, and the model with the best fit was chosen for ancestral character state reconstruction. At each node the ratios of likelihoods for both character states (0 and 1) were calculated. A likelihood ratio of at least 7:1 for a given character state at a node was considered to be significant (42).
To test whether the two characters evolved independently, we used a contin-uous Markov model in a maximum likelihood framework, as described by Pagel (36, 38, 39) and implemented in the program Discrete (37). Discrete uses the likelihood ratio test to compare likelihoods for a model with independent tran-sition rates for each character and a model where the trantran-sition rate for one character is dependent on the state of the other characters. The null hypothesis of independent evolution is rejected if the model of correlated evolution fits the data significantly better than the simpler model of independent evolution.
RESULTS
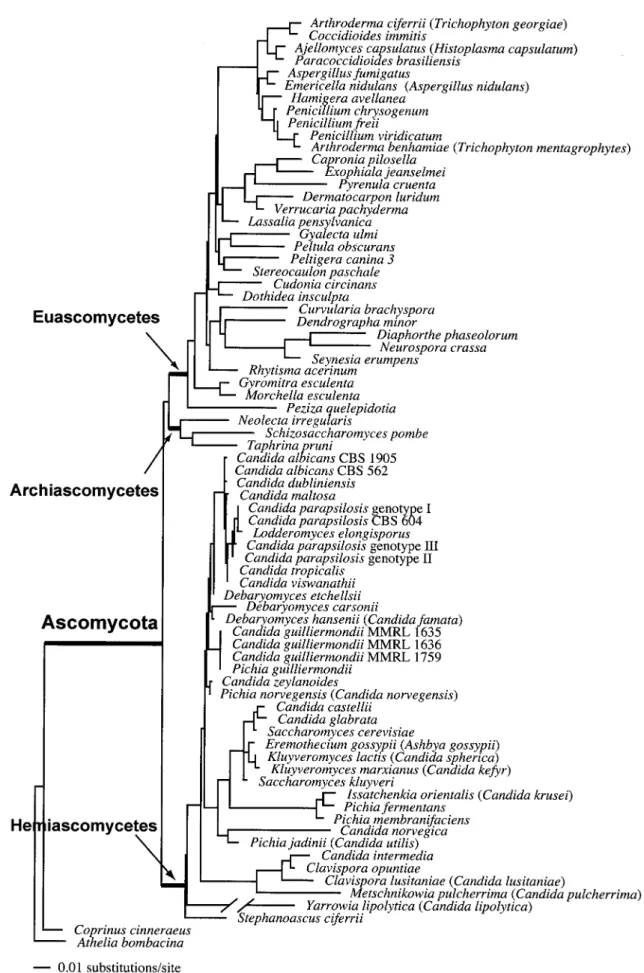
Phylogeny of the Hemiascomycetes.Analysis of 3,057 aligned rDNA characters of 73 ascomycetous taxa by using maximum likelihood revealed the monophyletic origin of the Hemiasco-mycetes (Saccharomycetales). With a likelihood value (⫺ln L) of 10,839, the phylogeny is supported by the data. The homo-geneous Bayesian analysis supported this clade, with a signif-icant posterior probability (100%) (Fig. 1). There was sig-nificant support for monophyly of the Euascomycetes (100%) and of the Archiascomycetes (97%). The Archiascomycetes and Euascomycetes form a monophyletic sibling (or “sister”) clade to the Hemiascomycetes, although support for this rela-tionship is low. Within the Hemiascomycetes only a few ter-minal relationships were resolved with significant support (Fig.
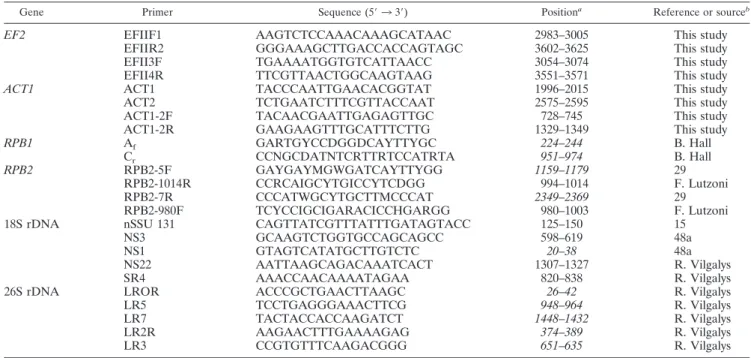
TABLE 2. Primers used for PCR and cycle sequencing
Gene Primer Sequence (5⬘ 3 3⬘) Positiona Reference or sourceb
EF2 EFIIF1 AAGTCTCCAAACAAAGCATAAC 2983–3005 This study
EFIIR2 GGGAAAGCTTGACCACCAGTAGC 3602–3625 This study
EFII3F TGAAAATGGTGTCATTAACC 3054–3074 This study
EFII4R TTCGTTAACTGGCAAGTAAG 3551–3571 This study
ACT1 ACT1 TACCCAATTGAACACGGTAT 1996–2015 This study
ACT2 TCTGAATCTTTCGTTACCAAT 2575–2595 This study
ACT1-2F TACAACGAATTGAGAGTTGC 728–745 This study
ACT1-2R GAAGAAGTTTGCATTTCTTG 1329–1349 This study
RPB1 Af GARTGYCCDGGDCAYTTYGC 224–244 B. Hall Cr CCNGCDATNTCRTTRTCCATRTA 951–974 B. Hall RPB2 RPB2-5F GAYGAYMGWGATCAYTTYGG 1159–1179 29 RPB2-1014R CCRCAIGCYTGICCYTCDGG 994–1014 F. Lutzoni RPB2-7R CCCATWGCYTGCTTMCCCAT 2349–2369 29 RPB2-980F TCYCCIGCIGARACICCHGARGG 980–1003 F. Lutzoni
18S rDNA nSSU 131 CAGTTATCGTTTATTTGATAGTACC 125–150 15
NS3 GCAAGTCTGGTGCCAGCAGCC 598–619 48a
NS1 GTAGTCATATGCTTGTCTC 20–38 48a
NS22 AATTAAGCAGACAAATCACT 1307–1327 R. Vilgalys
SR4 AAACCAACAAAATAGAA 820–838 R. Vilgalys
26S rDNA LROR ACCCGCTGAACTTAAGC 26–42 R. Vilgalys
LR5 TCCTGAGGGAAACTTCG 948–964 R. Vilgalys
LR7 TACTACCACCAAGATCT 1448–1432 R. Vilgalys
LR2R AAGAACTTTGAAAAGAG 374–389 R. Vilgalys
LR3 CCGTGTTTCAAGACGGG 651–635 R. Vilgalys
aPosition of the primer relative to C. albicans or S. cerevisiae (in italics). ND, no data available.
bURLs for sources are as follows: B. Hall, http://faculty.washington.edu/benhall/; F. Lutzoni, http://www.lutzonilab.net/pages/primer.shtml; R. Vilgalys, http://www
.biology.duke.edu/fungi/mycolab/primers.html.
TABLE 3. Overview of evolutionary substitution models applied to combined- and single-gene analyses and to different codon positions in the protein-coding genes
Fungal data set
Substitution models applied to single or combined genes
Substitution models applied to different codon positions of a gene Gene(s) Alignment length (bp) Modela Gene Codon position(s) Modela
Ascomycota 18S and 26S rDNA 3,057 TrN⫹I⫹G RPB1 1 and 2 TrN⫹G
Saccharomycetales 6 genes 5,064 TrN⫹I⫹G RPB1 3 TVM⫹I⫹G
RPB1 825 TrNef⫹I⫹G RPB2 1 and 2 TVM⫹I⫹G
RPB2 1,238 TrN⫹I⫹G RPB2 3 GTR⫹I⫹G
ACT1 489 GTR⫹I⫹G ACT1 1 and 2 JC⫹G
EF2 603 TrN⫹G ACT1 3 GTR⫹I⫹G
18S rDNA 1,149 TrN⫹I⫹G EF2 1 and 2 TVM⫹I⫹G
26S rDNA 760 TIM⫹I⫹G EF2 3 TIM⫹I⫹G
aI, proportion of invariable sites; G, gamma distribution; TrN, Tamura-Nei variable base frequencies (46); TrNef, Tamura-Nei equal transversion frequencies (46);
FIG. 1. Single most likely tree based on a combined analysis of the nuclear 18S rDNA and 26S rDNA of 73 ascomycetous taxa, using two basidiomycetes as outgroups. The nodes marking the Ascomycota, Euascomycetes, Archiascomycetes, and Hemiascomycetes as well as many terminal branches are supported by homogeneous Bayesian posterior probabilitiesⱖ95%. Arrows indicate the origins of the three classes of the phylum Ascomycota. The branch length for Y. lipolytica⫽ 0.22906 U of expected substitutions per site.
1). No statistical support was observed for the backbone of the tree within the Hemiascomycetes. Although the topology dif-fers from the tree obtained from the Saccharomycetales data (Fig. 2), none of these conflicts was supported in the analysis of the rDNA genes.
Analyses of single genes and topological congruence. The phylogeny of the Hemiascomycetes inferred from each indi-vidual gene (data not shown) was compared with the phyloge-netic tree from the heterogeneous Bayesian analysis of the combined genes (Fig. 2). For this comparison, we considered all clades that were statistically supported by posterior proba-bilities (ⱖ95%) (28 groups; thick branches in Fig. 2). Although single-gene trees were compatible with the combined phylog-eny in almost all cases, only 29 to 64% as many clades received significant support in the single-gene trees compared to the combined analysis. The individual genes and the number of groups with significant support are as follows: RPB1 (18 clades), RPB2 (15 clades), EF2 (10 clades), 18S rDNA (10 clades), 26S rDNA (10 clades), and ACT1 (8 clades). Table 4 lists each node recognized in the combined analysis (Fig. 2) and its statistical support as calculated in the single-gene tree. Twelve nodes were not supported by any of the genes. How-ever, 5 of the 12 (nodes 4, 15, 16, 32, and 35) appeared in the combined analysis with significant support. The remaining seven were recognized but not significantly supported. Fifteen clades were supported when the rDNA genes were combined, but when the four protein-coding genes were analyzed, 35 groups were resolved with statistically significant support. In the combined analysis of protein-coding genes and rDNA genes, 7 of the 35 nodes lost their statistical support. These nodes can be found throughout the tree: node 3 is located on the backbone, nodes 19 and 20 define relationships of groups of 10 and 6 taxa, respectively, and nodes 6, 12, 14, and 24 show sibling relationships between two terminal taxa.
Among the protein-coding genes, the analysis revealed sub-stitutional saturation in the third codon position (data not shown). For the first and second codon positions, we found no deviation from a 1:1 ratio in the distance plot, and therefore, these codon positions were unsaturated. Hence, evolutionary models were assigned to the first and second codon positions versus the third codon position in the analysis of single genes. In two cases, there was statistically significant conflict (poste-rior probability of 95%) among trees from the six genes. First, analysis of ACT1 grouped Issatchenkia orientalis with Pichia
norvegensis, an association that was not observed in any other
gene tree. In the analyses of the RPB1, RPB2, and the 26S rDNA gene sequences, P. norvegensis appeared to be closely related to Candida zeylanoides, with a posterior probability of 100%. BLAST searches of ACT1 sequences of I. orientalis,
P. norvegensis, and C. zeylanoides in GenBank confirmed their
identity. Second, in the EF2 gene phylogeny, P. norvegensis appeared most closely related to Candida intermedia. This re-sult could be attributed to missing EF2 nucleotide data for
C. zeylanoides, which was a sibling species to P. norvegensis in
the other gene analyses.
Phylogenetic analysis of the combined data sets for Saccha-romycetales. (i) Homogeneous and heterogeneous Bayesian analyses of the Saccharomycetales.The maximum likelihood analysis of the combined data for the six genes (5,064 aligned nucleotides) resulted in the single tree shown in Fig. 2 (⫺ln L
48,580; 8 df). The heterogeneous analyses of the combined data set resulted in trees with⫺ln L 47,829 (6-model analysis) and⫺ln L 46,486 (10-model analysis) at 142 and 168 df, re-spectively. The likelihood ratio for the homogeneous analysis and the 6-model analysis revealed that the heterogeneous model significantly improved the likelihood of the data. The 6-model analysis was then compared with the 10-model anal-ysis. Applying different evolutionary models to codon posi-tions, as in the 10-model analysis, results in the highest likeli-hood and statistical support for the relationships within the Saccharomycetales.
(ii) Phylogenetic relationships among Saccharomycetales.
Three major clades were resolved within the Saccharomyce-tales with strong support. Clade 1 originates with node 29, clade 2 originates at node 16, and clade 3 originates at node 4 (Fig. 2). Yarrowia lipolytica was significantly supported as a sibling species to these three clades. Stephanoascus ciferrii formed the most basal taxon of the order, although the posi-tion of S. ciferrii was supported only by the analysis of the protein-coding genes. Clade 1 is comprised of six Candida species (C. albicans, C. dubliniensis, C. maltosa, C. tropicalis,
C. viswanathii, and C. parapsilosis) and Lodderomyces elongi-sporus. They are most closely related to clade 2, which contains
a monophyletic clade of the C. guilliermondii complex, the Metschnikowiaceae (i.e., species of Clavispora and
Metschni-kowia), and the sibling species C. zeylanoides and P. norvegen-sis. These taxa have a sibling relationship with a monophyletic
clade of three Debaryomyces species. However, this association was significantly supported only by the analysis of the protein-coding genes, and there was no support for monophyly of the
Debaryomyces clade. Clade 3 contains the Saccharomycetaceae
and has a sibling relationship with clades 1 and 2 (Fig. 2). In clade 3, S. cerevisiae appears most closely related to Candida
castellii and Candida glabrata. These three species are related
to a clade composed of Eremothecium gossypii, Saccharomyces
kluyveri, Kluyveromyces lactis, and K. marxianus, which together
form the sibling group to Candida norvegica and Pichia jadinii. A clade of Issatchenkia orientalis, Pichia fermentans, and Pichia
membranifaciens completes this sample of Saccharomycetaceae. Ancestral character state evolution. Ancestral character states for codon reassignment were reconstructed under the asymmetric two-parameter model. The logarithmic likelihood calculated under the model (⫺15.57) was significantly greater than that calculated under the one-parameter Markov k-state model (⫺20.57) at ␣ ⫽ 0.05. The reconstruction indicated that codon reassignment occurred once in the evolutionary history of the Saccharomycetales in the most common ancestor of clades 1 and 2 (Fig. 3). The forward transition rate (031) was calculated to be 0.16, while the backward rate (130) was 4.26. Losses of the character are therefore more likely than gains. The left panel in Fig. 3 shows the reconstructed character states for each node. Gains or losses were assigned to nodes with statistical support higher than 87% support (black and white branches in Fig. 3). A character state could not be as-signed unambiguously for nodes with less than 87% support (gray branches). The reconstruction indicates that codon reas-signment occurred once, and there were at least five specific losses at the branches leading to Lodderomyces elongisporus,
Clavispora opuntiae, Metschnikowia pulcherrima, Pichia norve-gensis, and the Debaryomyces species (compare Fig. 2 and 3).
FIG. 2. Combined maximum likelihood analysis of six genes (ACT1, EF2, RPB1, RPB2, 18S rDNA, and 26S rDNA) for 38 taxa of Hemias-comycetes and two outgroup species, an Archiascomycete (S. pombe) and a Euascomycete (N. crassa). Thickened lines denote heterogeneous Bayesian posterior probabilitiesⱖ95% as calculated in the combined analysis. Node numbers are indicated above each branch. Refer to Table 4 for the statistical support of each node by each gene, as well as the combined multigenic support. Branch lengths leading to Y. lipolytica (0.19157) and the outgroup taxa (0.31967) were shortened to fit the figure. Black lines on the right indicate the three clades recognized in this study.
For the Co-Q9 reconstruction, the likelihood ratio test
showed no significant improvement for the asymmetry two-parameter model (⫺ln L ⫽ 16.68) over the one-parameter Markov k-state model (⫺ln L ⫽ 16.69). Hence, the latter was chosen to assess the evolution of Co-Q9. Transitions from 0 to
1 and vice versa were calculated to have occurred at a rate of 1.093. Character states of nodes in the tree were assigned as described above for codon recapture. The reconstruction of the evolution of nine isoprene subunits of Co-Q suggests that the most common ancestor of all three clades had nine sub-units and that multiple losses occurred within clades 2 and 3 (Fig. 2 and 3).
When correlated evolution between codon recapture and Co-Q9was tested, the null hypothesis of independent evolution could not be rejected (P⫽ 0.1430). Likelihoods for two models
of evolution (independent versus dependent) were calculated and compared in a likelihood ratio statistic. The likelihood of the model of dependent evolution was not significantly higher than the likelihood of the independent model. Since no signif-icant correlation between the evolution of these characters could be detected by these reconstruction methods, we con-clude that they evolved independently.
DISCUSSION
The phylogenetic results provide statistically significant sup-port for the monophyletic origin of two families of Saccharo-mycetales, the Metschnikowiaceae and Saccharomycetaceae. Previous studies also concluded that these families are mono-phyletic, albeit with low statistical support (7, 21). The
combi-TABLE 4. Single-gene posterior probabilities for nodes in the combined analysis of the Saccharomycetales shown in Fig. 2
Group Node
Posterior probabilitya
Single-gene analyses
Combined analysis (28)
ACT1 (8) EF2 (10) RPB1 (18) RPB2 (15) 18S rDNA
(10) 26S rDNA (10) 1 ⬍0.01 ⬍0.01 ⬍0.01 ⬍0.01 1.00 ⬍0.01 ⬍0.01 2 1.0 1.00 1.00 0.31 0.77 1.00 1.00 3 ⬍0.01 ⬍0.01 ⬍0.01 0.89 0.33 ⬍0.01 0.68 Clade 3 4 ⬍0.01 ⬍0.01 0.42 0.50 0.76 ⬍0.01 1.00 5 ⬍0.01 1.00 1.00 1.00 1.00 1.00 1.00 6 ⬍0.01 0.88 ⬍0.01 0.54 ⬍0.01 ⬍0.01 0.86 7 ⬍0.01 ⬍0.01 0.69 1.00 ⬍0.01 ⬍0.01 1.00 8 0.99 1.00 1.00 1.00 0.95 0.33 1.00 9 ⬍0.01 0.66 1.00 1.00 0.94 0.48 1.00 10 ⬍0.01 ⬍0.01 1.00 0.90 0.99 0.68 1.00 11 1.0 0.31 1.00 1.00 1.00 1.00 1.00 12 0.29 ⬍0.01 0.77 0.16 ⬍0.01 0.39 0.63 13 ⬍0.01 ⬍0.01 1.00 1.00 ⬍0.01 0.59 1.00 14 ⬍0.01 ⬍0.01 ⬍0.01 ⬍0.01 0.25 0.64 0.31 15 ⬍0.01 ⬍0.01 0.94 ⬍0.01 0.78 ⬍0.01 0.96 Clade 2 16 ⬍0.01 ⬍0.01 0.94 0.43 ⬍0.01 ⬍0.01 0.96 17 ⬍0.01 ⬍0.01 ⬍0.01 ⬍0.01 ⬍0.01 ⬍0.01 0.88 18 ⬍0.01 ⬍0.01 ⬍0.01 0.83 ⬍0.01 ⬍0.01 0.55 19 ⬍0.01 0.34 ⬍0.01 ⬍0.01 ⬍0.01 ⬍0.01 0.85 20 ⬍0.01 ⬍0.01 0.98 ⬍0.01 ⬍0.01 ⬍0.01 0.75 21 ⬍0.01 ⬍0.01 1.00 1.00 ⬍0.01 1.00 1.00 22 ⬍0.01 ⬍0.01 0.48 0.99 1.00 0.64 1.00 23 ⬍0.01 ⬍0.01 ⬍0.01 ⬍0.01 1.00 0.62 1.00 24 0.21 ⬍0.01 ⬍0.01 0.28 0.97 ⬍0.01 0.73 25 1.00 1.00 1.00 1.00 1.00 1.00 1.00 26 ⬍0.01 0.78 0.74 1.00 0.20 0.20 1.00 27 0.20 1.00 0.97 1.00 0.20 0.20 1.00 28 ⬍0.01 1.00 0.99 0.32 0.47 ⬍0.01 0.96 Clade 1 29 ⬍0.01 ⬍0.01 0.85 0.51 1.00 0.98 1.00 30 1.00 ⬍0.01 1.00 0.51 ⬍0.01 0.99 1.00 31 0.75 0.98 0.18 0.51 ⬍0.01 0.97 1.00 32 0.24 0.33 0.62 0.93 0.20 0.40 1.00 33 0.99 1.00 1.00 0.51 0.20 1.00 1.00 34 0.40 ⬍0.01 1.00 1.00 ⬍0.01 ⬍0.01 1.00 35 0.19 0.79 ⬍0.01 0.92 ⬍0.01 ⬍0.01 1.00 36 0.36 ⬍0.01 1.00 1.00 ⬍0.01 0.34 1.00 37 1.00 1.00 1.00 1.00 ⬍0.01 1.00 1.00 38 1.00 0.98 1.00 1.00 ⬍0.01 0.84 1.00
nation of multiple-gene and statistical approaches provided strong support for these two families. Kurtzman and Fell (23) were uncertain about the placement of the genera Issatchenkia and Debaryomyces within the Saccharomycetaceae. Our results suggest that Issatchenkia is a basal genus of the Saccharomyc-etaceae (clade 3). The three species of Debaryomyces appear to be closely related to the Metschnikowiaceae (clade 2).
Most, but not all, of the pathogenic species of Candida were placed within the well-supported clade 1. However, common pathogenic Candida species and emerging pathogenic yeasts (11) can be found in every major clade of the phylogram (Fig. 2); e.g., C. glabrata is in clade 3. C. viswanathii, a rare oppor-tunistic pathogen, is closely related to C. tropicalis, as noted by Barns et al. (2). With the exception of C. glabrata (Torulopsis
glabrata), the most prominent clinical species of Candida are
clustered in clade 1. However, clade 1 also includes at least two nonpathogenic species (C. maltosa and L. elongisporus). This result, as well as the placement of other opportunistic
patho-gens in different clades (e.g., C. glabrata, C. lusitaniae, C.
guil-liermondii, I. orientalis [C. kruesei], and S. cerevisiae), suggests
that pathogenicity evolved independently on multiple occa-sions. Indeed, the base of the phylogram includes two ex-tremely rare pathogens, Y. lipolytica (anamorph, Candida
lipo-lytica) and Stephanoascus ciferrii (anamorph, Candida ciferrii)
(11).
Combining sequence data for six genes in a phylogenetic analysis enabled us to clarify several other relationships among the species and families of medical yeasts. (i) Previous studies analyzed single genes and failed to define the relationships among C. albicans, C. viswanathii, C. tropicalis, and C.
parapsi-losis with significant statistical support (7, 14, 21, 50). This
investigation resolved the phylogeny of these species. (ii)
S. kluyveri was thought to be most closely related to S. cerevi-siae, despite low statistical support (7). However, our analysis
determined that S. kluyveri belongs in the Saccharomycetales but is more closely related to the genus Kluyveromyces than
FIG. 3. Diagrammatical representation of phylogram in Fig. 2 with character states for the translation of CUG (left side) and the presence or absence of Co-Q9(right side) in the terminal taxa. The small rectangles in the center denote each species in Fig. 2. Different branch shading demarks reconstruction of ancestral character states. Black and white branches represent branches for which the presence or absence of the character could be reconstructed unambiguously with a statistical support value ofⱖ87%. Uncertainty in character reconstruction is indicated by gray branches (⬍87%).
Saccharomyces. (iii) The results also support transferring Ere-mothecium gossypii from the family Ermotheciaceae to the
Saccharomycetaceae, where it is closely related to S. kluyveri and Kluyveromyces species (25). This finding warrants further analysis of the Ermotheciaceae family, which contains four other species of Eremothecium. (iv) We included strains of the three recognized genotypes of C. parapsilosis (28) and con-firmed that genotype I (ATCC 96138) most resembles the type strain (CBS 604). This analysis provides statistical support for a sibling relationship between genotypes II (ATCC 96140) and III (ATCC 96144) within a clade that includes genotype I and the type strain. (v) Our data confirm the polyphyletic compo-sition of both Pichia and the anamorphic genus, Candida (7, 21). As neither genus is monophyletic, we recommend a reex-amination and revision of these multifarious genera.
A discrepancy of minor importance involves the placement of P. norvegensis, a member of the polyphyletic genus Pichia. Kurtzman and Robnett’s comparison of 26S rDNA sequences of 500 species of ascomycetous yeasts put C. zeylanoides in the Debaryomyces clade, and P. norvegensis was grouped with
Pichia and Issatchenkia (24). Similarly, an analysis of the actin
gene phylogeny placed P. norvegensis with the other Pichia species, some distance from C. zeylanoides (7). In agreement with these studies, our actin gene tree also grouped P.
norve-gensis with other Pichia species. However, analyses of the RPB1, RPB2, and 26S rDNA genes (Table 4, node 21)
pro-vided excellent support for the arrangement in our com-bined tree (Fig. 2). The previous studies used the type strain of P. norvegensis (CBS 6564), whereas we used a different strain, P. norvegensis var. zeylanoides (CBS 1922).
We also investigated the evolutionary associations of two traits common among the Saccharomycetales: codon usage and the Co-Q9system. Although an examination of these character
states among the terminal taxa suggested a correlation be-tween codon recapture and Co-Q9(44), our comparative
anal-yses did not find significant support for the coevolution of these characters. Of course, this analysis may have been affected by the taxa we sampled, and the inclusion of more taxa might lead to a different conclusion. However, there was significant support for the monophyletic origin of CUG usage. Most human pathogenic species of Saccharomycetales are equipped with alternative CUG usage, Co-Q9, or both. These
attributes may be advantageous for pathogenicity of these or-ganisms in mammals, which is a hypothesis that remains to be tested. Recent reviews of the CUG reassignment from leucine to serine indicate that the requisite serine-tRNACAGevolved
in an ancestor to both Saccharomyces and Candida, and this gene was subsequently lost from Saccharomyces (34, 43). There is some experimental evidence that the redefinition of the CUG codon destabilized the proteome, leading to the overex-pression of stress proteins that may have imparted an evolu-tionary advantage to pathogenic yeasts (43).
Regarding the type of Co-Q, our data significantly support a phylogeny with Co-Q9as the ancestral character state for the
entire Saccharomycetales, with a loss in the Saccharomyce-taceae lineage. Co-Q9is present in the two most distal taxa, Y. lipolytica and Stephanoascus ciferrii, as well as in the
Archi-ascomycetes, EuArchi-ascomycetes, and many basidiomycetes. Ad-ditional taxa will need to be analyzed to determine more precisely where, and how often, species within the
Saccharo-mycetaceae replaced Co-Q9(with Co-Q6or Co-Q7among the
taxa in clade 3). Obviously, neither the redefinition of CUG or the presence of Co-Q9is essential for pathogenicity, as many
pathogenic yeasts and molds translate CUG as leucine and use other forms of Co-Q.
For a long time, rDNA genes were the only accessible source of data to investigate phylogenetic relationships among fungi. That situation has changed over the last several years with the increasing accumulation of protein-coding DNA sequences in databases and the completion of genome sequencing projects. This investigation demonstrates the value of including protein-coding sequences, which contributed significantly to the statis-tical support and resolution of the phylogeny. Protein-coding DNA sequences are easier to align than data derived from rDNA genes, especially when the investigated taxa span sev-eral families, as presented here. Another limitation of rDNA sequence data is that these genes are highly conserved, varia-tion is limited, and multiple substituvaria-tions may occur. This study also illustrates the importance of analyzing relevant genes to elucidate specific relationships; for example, clade 1 was de-fined by the rDNA genes, but relationships within the clade were resolved by analyzing the RPB1 and RPB2 genes. As il-lustrated in Table 4, reliance on a single gene or two may yield inaccurate results. The availability of a well-supported multi-gene phylogeny also provides a valuable framework for assess-ing the results of ongoassess-ing genome projects and comparative genomics.
This multilocus phylogeny has clarified the evolutionary re-lationships among the medically important and related species of Saccharomycetales, defined taxa that require further in-vestigation, and analyzed the origins of pathogen-related char-acters.
ACKNOWLEDGMENTS
For insightful comments on the manuscript and discussion we thank H. E. O’Brien, T. Y. James, M. L. Berbee, and F. S. Dietrich, who also generously provided DNA sequence data for E. gossypii ATCC 10895. We thank W. Schell, W. Meyer, and G. Bulmer for providing cultures. We are grateful to F. M. Lutzoni for assistance with the rDNA align-ment. The EF2 and ACT1 primers were designed by G. Luo. We appreciate the expert technical assistance of L. Buckovnik and J. A. Jackson. The informative comments of two anonymous reviewers were most helpful.
This study was funded by Public Health Service grant AI 28836 from the National Institutes of Health and the German Academic Exchange Service in the form of a diploma stipend for S.D.
REFERENCES
1. Alexopoulos, C. J., C. W. Mims, and M. Blackwell. 1996. Introductory my-cology, 4th ed. John Wiley & Sons, Inc., New York, N.Y.
2. Barns, S. M., D. J. Lane, M. L. Sogin, C. Bibeau, and W. G. Weisburg. 1991. Evolutionary relationships among pathogenic Candida species and relatives. J. Bacteriol. 173:2250–2255.
3. Berbee, M. L., and J. W. Taylor. 1992. Detecting morphological convergence in true fungi, using 18S rRNA gene sequence data. Biosystems 28:117–125. 4. Calderone, R. A. (ed.). 2001. Candida and candidiasis. ASM Press,
Wash-ington, D.C.
5. Cannone, J., S. Subramanian, M. Schnare, J. Collett, L. D’Souza, Y. Du, B.
Feng, N. Lin, L. Madabusi, K. Muller, N. Pande, Z. Shang, N. Yu, and R. Gutell.2002. The comparative RNA web (CRW) site: an online database of comparative sequence and structure information for ribosomal, intron, and other RNAs. BMC Bioinformatics 3:2.
6. Corpet, F. 1988. Multiple sequence alignment with hierarchical clustering. Nucleic Acids Res 16:10881–10890.
7. Daniel, H. M., T. C. Sorrell, and W. Meyer. 2001. Partial sequence analysis of the actin gene and its potential for studying the phylogeny of Candida species and their teleomorphs. Int. J. Syst. Evol. Microbiol. 51:1593–1606.
8. Felsenstein, J. 1981. Evolutionary trees from DNA-sequences—a maximum-likelihood approach. J. Mol. Evol. 17:368–376.
9. Foster, P. 11 June 2004, accession date. p4—software for heterogeneous models of molecular sequences. [Online.] www.nhm.ac.uk/zoology/home /foster.htm.
10. Gardes, M., and T. D. Bruns. 1993. ITS primers with enhanced specificity for basidiomycetes—applications to the identification of mycorrhizae and rusts. Mol. Evol. 2:113–118.
11. Hazen, K. 1995. New and emerging yeast pathogens. Clin. Microbiol. Rev.
8:462–478.
12. Huelsenbeck, J. P., and F. Ronquist. 2001. MRBAYES: Bayesian inference of phylogenetic trees. Bioinformatics 17:754–755.
13. Jukes, T. H., and C. Cantor. 1969. Evolution of protein molecules. Academic Press, New York, N.Y.
14. Kato, M., M. Ozeki, A. Kikuchi, and T. Kanbe. 2001. Phylogenetic relation-ship and mode of evolution of yeast DNA topoisomerase II gene in the pathogenic Candida species. Gene 272:275–281.
15. Kauff, F., and F. Lutzoni. 2002. Phylogeny of the Gyalectales and Ostropales (Ascomycota, Fungi): among and within order relationships based on nu-clear ribosomal RNA small and large subunits. Mol. Phylogenet. Evol. 25: 138–156.
16. Kawaguchi, Y. H., J. Honda, and S. Taniguchi-Morimura. 1989. The codon CUG is read as serine in an asporogenic yeast Candida cylindracea. Nature
341:164–166.
17. Kirk, P. M., P. F. Cannon, J. C. David, and J. A. Staplers (ed.). 2001. Ainsworth & Bisby’s dictionary of the fungi, 9th ed. CABI Publishing. 18. Kishino, H., and M. Hasegawa. 1989. Evaluation of the maximum-likelihood
estimate of the evolutionary tree topologies from DNA-sequence data, and the branching order in Hominoidea. J. Mol. Evol. 29:170–179.
19. Kjer, K. M. 1995. Use of rRNA secondary structure in phylogenetic studies to identify homologous positions: an example of alignment and data presen-tation from the frogs. Mol. Phylogenet. Evol. 4:314–330.
20. Kumar, S., K. Tamura, and M. Nei. 1994. MEGA: molecular evolutionary genetics analysis software for microcomputers. Comput. Appl. Biosci. 10: 189–191.
21. Kurtzman, C., and C. Robnett. 1997. Identification of clinically important ascomycetous yeasts based on nucleotide divergence in the 5⬘ end of the large-subunit (26S) ribosomal DNA gene. J. Clin. Microbiol. 35:1216–1223. 22. Kurtzman, C. P. 1994. Molecular taxonomy of the yeasts. Yeast 10:1727–
1740.
23. Kurtzman, C. P., and J. W. Fell (ed.). 1998. The yeasts: a taxonomic study, 4th ed. Elsevier, Amsterdam, The Netherlands.
24. Kurtzman, C. P., and C. J. Robnett. 1998. Identification and phylogeny of ascomycetous yeasts from analysis of nuclear large subunit (26S) ribosomal DNA partial sequences. Antonie Leeuwenhoek 73:331–371.
25. Kurtzman, C. P., and C. J. Robnett. 2003. Phylogenetic relationships among yeasts of the ‘Saccharomyces complex’ determined from multigene sequence analyses. FEMS Yeast Res. 3:417–432.
26. Lanave, C., G. Preparata, C. Saccone, and G. Serio. 1984. A new method for calculating evolutionary substitution rates. J. Mol. Evol. 20:86–93. 27. Lewis, P. O. 2001. A likelihood approach to estimating phylogeny from
discrete morphological character data. Syst. Biol. 50:913–925.
28. Lin, D., L. C. Wu, M. G. Rinaldi, and P. F. Lehmann. 1995. Three distinct genotypes within Candida parapsilosis from clinical sources. J. Clin. Micro-biol. 33:1815–1821.
29. Liu, Y. J., S. Whelen, and B. D. Hall. 1999. Phylogenetic relationships among ascomycetes: evidence from an RNA polymerse II subunit. Mol. Biol. Evol.
16:1799–1808.
30. Lott, T. J., B. M. Burns, R. Zancope-Oliveira, C. M. Elie, and E. Reis. 1998. Sequence analysis of the internal transcribed spacer 2 (ITS2) from yeast species within the genus Candida. Curr. Microbiol. 36:63–69.
31. Lott, T. J., R. J. Kuykendall, and E. Reiss. 1993. Nucleotide sequence analysis of the 5.8S rDNA and adjacent ITS2 region of Candida albicans and related species. Yeast 9:1199–1206.
32. Maddison, D. W., and W. P. Maddison. 11 June 2004, accession date. Mesquite—a modular system for evolutionary analysis (version 1.02). [On-line.] http://www.mesquiteproject.org.
33. Maddison, W. P., and D. R. Maddison. 1997. MacClade. Analysis of phy-logeny and character evolution. Sinauer Associates, Inc., Sunderland, Mass. 34. Massey, S. E., G. Moura, P. Beltrao, R. Almeida, J. R. Garey, M. F. Tuite,
and M. A. S. Santos.2003. Comparative evolutionary genomics unveils the molecular mechanism of reassignment of the CTG codon in Candida spp. Genome Res. 13:544–557.
35. Nishida, H., and J. Sugiyama. 1994. Archiascomycetes: detection of a major new lineage within the ascomycota. Mycoscience 35:361–366.
36. Pagel, M. 1994. Detecting correlated evolution on phylogenies: a general method for the comparative analysis of discrete characters. Proc. Biol. Sci.
255:37–45.
37. Pagel, M. 12 June 2004, accession date. Discrete: a method for the analysis of discrete or categorical traits on phylogenies. Ancestral states, correlated evolution. [Online.] http://sapc34.rdg.ac.uk/meade/Mark/.
38. Pagel, M. 1999a. Inferring the historical patterns of biological evolution. Nature 401:877–884.
39. Pagel, M. 1999b. The maximum likelihood approach to reconstructing an-cestral character states of discrete characters on phylogenies. Syst. Biol.
48:612–622.
40. Posada, D., and K. A. Crandall. 1998. MODELTEST: testing the model of DNA substitution. Bioinformatics 14:817–818.
41. Rodriguez, F., J. L. Oliver, A. Marin, and J. R. Medina. 1990. The general stochastic model of nucleotide substitution. J. Theor. Biol. 142:485–501. 42. Schluter, D., T. Price, A. O. Mooers, and D. Ludwig. 1997. Likelihood of
ancestor states in adaptive radiation. Evolution 51:1699–1711.
43. Silva, R. M., I. Miranda, G. Moura, and M. A. S. Santos. 2004. Yeast as a model organism for studying the evolution of non-standard genetic codes. Briefings Funct. Genomics Proteomics 3:35–46.
44. Sugita, T., and T. Nakase. 1999. Non-universal usage of the leucine CUG codon and the molecular phylogeny of the genus Candida. Syst. Appl. Mi-crobiol. 22:79–86.
45. Swofford, D. L. 2002. PAUP*. Phylogenetic analysis using parsimony (*and other methods), 4th ed. Sinauer Associates, Inc., Sunderland, Mass. 46. Tamura, K., and M. Nei. 1993. Estimation of the number of nucleotide
substitutions in the control region of mitochondrial-DNA in humans and chimpanzees. Mol. Biol. Evol. 10:512–526.
47. Tavare, S. 1986. Some probalistic and statistical problems in the analysis of DNA sequences. Lect. Math. Life Sci. 17:57–86.
48. Thompson, J. D., D. G. Higgins, and T. J. Gibson. 1994. CLUSTAL W: improving the sensitivity of progressive multiple sequence alignment through sequence weighting, positions-specific gap penalties and weight matrix choice. Nucleic Acids Res. 22:4673–4680.
48a.White, T. J., T. Bruns, S. Lee, and J. W. Taylor. 1990. Amplification and direct sequencing of fungal ribosomal RNA genes for phylogenies, p. 315– 322. In M. A. Innis, D. H. Gelford, J. J. Sninsky, and T. J. White (ed.), PCR protocols: a guide to methods and applications. Academic Press, San Diego, Calif.
49. Yamada, Y., M. Nojiri, M. Matsuyama, and K. Kondo. 1976. Coenzyme Q system in the classification of the ascosporogenous yeast genera
Debaryomy-ces, SaccharomyDebaryomy-ces, KluyveromyDebaryomy-ces, and Endomycopsis. J. Gen. Appl.
Micro-biol. 22:325–337.
50. Yokoyama, K., S. K. Biswas, M. Miyaji, and K. Nishimura. 2000. Identifi-cation and phylogenetic relationship of the most common pathogenic
Can-dida species inferred from mitochondrial cytochrome b gene sequences.
J. Clin. Microbiol. 38:4503–4510.