Dora Nazaré Marques
Myopia and Colour Vision, a Case Study
Universidade do Minho
Escola de Ciências
Dor a N azar é Mar q ues Myopia and Colour V
ision, a Case Study
1
Universidade do Minho
Escola de Ciências
Dora Nazaré Marques
Myopia and Colour Vision, a Case Study
Trabalho realizado sob orientação do
Professor Doutor Jorge Manuel Martins Jorge
e do
Professor Doutor João Manuel Maciel Linhares
Dissertação de Mestrado
A
CKNOWLEDGMENTSI would like to express my outmost gratitude to my advisors, Professor Jorge Manuel Martins Jorge and Professor João Manuel Maciel Linhares, for all their support, guidance, knowledge, and patience.
I would like to thank my parents, family and friends for their love, friendship and support.
I would also like to thank my friends of the CEORlab and the Colour Science Lab for all their help. And I would like to thank the participants, both ametropic and emmetropic, for their kindness and availability, and all those who somehow contributed to the completion of this work.
A
BSTRACTThe increasing prevalence of myopia has become a major cause for concern since high myopes are at risk of developing pathologic myopia and blindness. Several structural and functional differences have been identified between a myopic and a normal eye. The myopic eye is usually more elongated and stretched than the normal eye. The excessive elongation of the eye causes a lower packing density of the photoreceptors in the retina, and the electric activity of the retinal neurons is diminished in high myopes. Therefore, it is possible that the chromatic discrimination in myopes is worse than in normal subjects.
The aim of this thesis was to assess the differences in the chromatic discrimination thresholds between non-myopic and myopic subjects.
Forty-two healthy young adults were enrolled in this case study. First, habitual prescription and axial length were measured and ocular health was assessed, including visual acuity, retinography, biomicroscopy, tonometry and wavefront aberrometry. Afterwards, the chromatic discrimination thresholds were determined from the Colour Assessment and Diagnosis (CAD) test and the Cambridge Colour Test (CCT) data. Participants were divided in four groups in accordance to their refractive error (non-, low, moderate and high myopes), and in three groups of axial length (small, medium and long eyes).
It was found that the CAD test has more sensitivity in detecting discrimination differences between the groups, and that the CCT is unable to detect such differences. High myopes have significantly increased chromatic discrimination thresholds in the CAD test, in general, and in the red and blue regions of the colour space than the other groups. The results suggest that the chromatic discrimination in high myopes is significantly worse than non- and low-to-moderate myopes and that the CAD test may be useful in determining such differences.
R
ESUMOA elevada prevalência de alta miopia a nível mundial tem sido encarada como um problema de saúde pública. O comprimento axial excessivo característico da alta miopia pode acarretar complicações oculares patológicas e eventualmente resultar em cegueira. A densidade dos fotorreceptores na retina dos míopes difere da dos não-míopes, sendo menor nos primeiros dado o maior comprimento axial do olho míope, e a resposta neuronal obtida a partir de electroretinografia é diminuída nos altos míopes. Assim, pode acontecer que a perceção cromática seja diferente entre míopes e não-míopes e, para tal, os limiares de deteção cromática de ambos foram determinados.
O objetivo deste trabalho é o de determinar a discriminação cromática de sujeitos míopes e não míopes e avaliar a sua diferença.
Este caso de estudo incluiu 42 jovens adultos saudáveis. Primeiro, determinou-se a correção habitual e o comprimento axial, bem como a acuidade visual. A saúde ocular foi avaliada recorrendo a biomicroscopia, retinografia, tonometria e aberração de frente de onda. De seguida, os limiares de deteção cromática foram determinados dos dados obtidos pelo teste Colour Assessment and Diagnosis (CAD) e o Cambridge Colour Test (CCT). Os participantes foram divididos em 4 grupos refrativos (não-míopes, baixos-, moderados- e altos-míopes), e 3 grupos de comprimento axial (olhos pequenos, médios e grandes).
Comparando ambos os testes, o CAD parece ser mais sensível na determinação de alterações da perceção cromática, pois apresenta uma correlação estatisticamente significativa com o comprimento axial e o erro refrativo, ao contrário do CCT. Detetou-se um aumento estatisticamente significativo dos limiares de deteção cromática determinados com o CAD dos altos-míopes em comparação com os restantes grupos, em particular nas regiões vermelha e azul. Os resultados apontam para uma pior perceção cromática dos altos míopes do que a dos não-míopes e baixos/moderados-não-míopes e o CAD aparenta ser um teste útil na deteção destas diferenças.
I
NDEXACKNOWLEDGMENTS ... III ABSTRACT ... V RESUMO ... VII ABBREVIATIONS AND ACRONYMS ... XI INDEX OF FIGURES ... XIII INDEX OF TABLES ... XV
1. LITERATURE REVIEW ... 17
1.1. The Visual System ... 17
1.1.1. Retina ... 18
1.1.2. Photoreceptors ... 20
1.1.3. Post-retinal Pathways ... 22
1.2. Colour Vision ... 23
1.2.1. Light and Colour ... 23
1.2.2. Chromaticity Diagrams: The CIE Colour Specification System ... 24
1.2.3. Colour Confusion Lines ... 27
1.2.4. Colour Vision Tests ... 27
1.3. Myopia ... 32
1.3.1. Myopia and Visual Impairment ... 32
1.3.2. Worldwide Prevalence of Myopia ... 33
1.3.3. Risk Factors for Myopia ... 33
1.3.4. The Myopic Retina ... 36
1.3.5. Wavefront Aberrations and Myopia ... 37
1.3.6. Chromatic Signals and Myopia ... 38
1.3.7. Pathologic Myopia ... 39
2. HYPOTHESIS AND AIMS OF THE STUDY ... 41
2.1. Problem Formulation ... 41
2.2. Hypothesis ... 41
2.3. Aims ... 41
3. MATERIAL AND METHODS ... 43
3.2. Participants and Sample Size ... 43
3.3. Experimental Procedure ... 43
3.3.1. Refractive Error ... 44
3.3.2. Visual Acuity ... 44
3.3.3. Ocular Health Assessment ... 45
3.3.4. Wavefront Aberrometry ... 45
3.3.5. Axial Length ... 46
3.3.6. Chromatic Thresholds Determination ... 46
3.4. Statistical Analysis ... 47
4. RESULTS ... 51
4.1. Sample Demographics ... 51
4.2. Ocular Parameters ... 53
4.3. Colour Vision ... 53
4.3.1. Corneal Biomechanics and Wavefront Aberrations ... 53
4.3.2. Sensitivity of Colour Vision Tests ... 55
4.3.3. Chromatic Discrimination Thresholds and Myopia ... 60
5. DISCUSSION ... 63
5.1. Ocular Parameters ... 63
5.2. Colour Vision ... 64
5.2.1. Corneal Biomechanics and Wavefront Aberrations ... 64
5.2.2. Sensitivity of Colour Vision Tests ... 65
5.2.3. Chromatic Discrimination Thresholds and Myopia ... 66
5.3. Limitations ... 68
6. CONCLUSIONS ... 71
7. FUTURE WORK ... 73
A
BBREVIATIONS ANDA
CRONYMSAOSLO: Adaptive Optics Scanning Laser Ophthalmoscopy B: Blue
C’: Negative cylinder
CAD: Colour Assessment and Diagnosis CCT: Cambridge Colour Test
CH: Corneal hysteresis
CIE: Commission Internationale de l’Eclairage CRF: Corneal resistance factor
EM: Electromagnetic
ETDRS: Early Treatment of Diabetic Retinopathy Study ffERG: Full-field electroretinography
G: Green
GCL: Ganglion cell layer H: Horizontal cells
HOA: Higher order aberrations ILM: Internal limiting membrane INL: Inner nuclear layer
IOP: Intraocular pressure
IOPcc: Corneal compensated intraocular pressure IOPg: Goldmann correlated intraocular pressure IPL: Inner plexiform layer
J0: Vertical astigmatism component
J45: Oblique astigmatism component
LGN: Lateral geniculate nucleus
LogMAR: Units of measurement of visual acuity by the logarithm of the Minimum Angle of Resolution
M: Mean spherical equivalent component mERG: Multifocal electroretinography NFL: Nerve fibre layer
OLM: Outer limiting membrane ONL: Outer nuclear layer OPL: Outer plexiform layer
Q1: Red quadrant of the Cambridge Colour Test Q2: Yellow quadrant of the Cambridge Colour Test Q3: Green quadrant of the Cambridge Colour Test Q4: Blue quadrant of the Cambridge Colour Test R: Red
RMS: Root mean square
RPE: Retinal pigment epithelium S: Mean sphere
V1: Striate visual cortex or visual area 1 Y: Yellow
I
NDEX OFF
IGURESFigure 1. Cross section of the three main layers of the human eye. Adapted from Schwartz 2010. ...17 Figure 2. Cross section of the human retinal layers and their major cell types: cones (C) and rods (R); bipolar cells (B); horizontal cells (H); amacrine cells (A); Müller glial cells (M) and ganglion cells (G). Light passes through the inner limiting membrane and the inner retina before reaching the photoreceptors. Adapted from Swaroop, Kim & Forest 2010. ...19 Figure 3. a) Cone and rod photoreceptors: outer segment (OS) (connected to the retinal pigment epithelium (RPE)), inner segment (IS), cell body (CB) and synaptic pedicle (Syn). b) Human cone photoreceptor distribution mosaic: Short-, medium- and long-wavelength sensitive cones, represented in blue, green and red, are randomly distributed in the retina. Adapted from Swaroop, Kim & Forest 2010. ...20 Figure 4. Visual pathway. Information from the retinal nerve cells passes through the optic nerve, and the information from the nasal retinas is crossed in the optic chiasm. The optic tract conducts the information to the lateral geniculate nucleus (LGN) layers. Cortical area V1 receives the information from the three pathways of the LGN. Adapted from Solomon & Lennie 2007. ...22 Figure 5. The electromagnetic spectrum. Visible light is only a small part of the spectrum. Wavelength is in nanometres (1 nm=10-9 m). Adapted from Goldstein 2013. ...23
Figure 6. The CIE-x, y 1931 chromaticity diagram. On the left, x and y are the coordinates that represent chromaticity coordinates. All the monocromatic colours experiences lie along the limiting contour, ranging from 380 to 780 nm. All the other colours result form combinations of these colours. On the right, each line represents a perceptual colour difference of the same magnitude and luminance across the diagram. The length of the lines should be the same for uniformity purposes. Adapted from http://www.efg2.com (left) and Hunt & Pointer 2011 (right). ...25 Figure 7. The CIE 1976- u', v' uniform chromaticity diagram, with u', v' coordinates. On the left, additive mixture of colours are represented by points lying on the straight line joining the points that represent constituent colours, ranging from 380 to 780 nm. On the right, each line represents a perceptual colour difference of the same magnitude and luminance. The lengths of the lines are more similar than for the x, y coordinates. Adapted from http://www.efg2.com (left) and Hunt & Pointer 2011 (right). ...26 Figure 8. Colour confusion lines plotted on the CIE-x, y 1931 chromaticity diagram for (A) deutan, (B) protan and (C) tritan subjects. All lines origin at a different point for each colour vision defect. Adapted from Schwartz 2010. ...27 Figure 9. C-shaped target of the Cambridge Colour Test with two different orientations. Adapted from Mollon & Regan 2000. ...29
Figure 10. CCT results for a normal observer, with three ellipses from three different background chromaticities. The small crosses are the individual thresholds for the different hue directions. Adapted from Mollon & Regan 2000. ...29 Figure 11. CCT results for colour deficient observers. (a) Protan, (b) deutan and (c) tritan observer. The major axes of the ellipses are oriented along the confusion lines for each deficiency. Adapted from Mollon & Regan 2001. ...30 Figure 12. Moving squares in a dynamic background of the CAD test. The coloured square moves randomly in the diagonal and the observer must identify its direction. Adapted from Barbur, Rodríguez-Carmona & Harlow 2006. ...30 Figure 13. Results of a normal trichromat CAD test observer. The results are plotted in the CIE-x,y 1931 diagram. The black-dotted ellipse represents the median for 250 normal trichromats. The grey region represents the threshold limits for 95% of the normal observers. The inner and outermost ellipses are the 2.5% and 97.5% corresponding statistical limits. The deutan, protan and tritan confusion bands are displayed in green, red and blue, respectively. The black cross (0.305, 0.323) indicates background chromaticity (x,y). Adapted from Barbur, Rodriguez-Carmona, Evans & Milburn 2009. ...31 Figure 14. Chromatic thresholds for two colour vision deficient observers with severe colour vision deficiency. Grey lines represent the largest chromatic displacements away from background chromaticity that are set by the isoluminant condition and the limits imposed by the phosphors of the display. The greater the elongation along the deuteranopic (left) or the protanopic (right) confusion lines, the lower the level of chromatic sensitivity and the greater the colour vision loss. Adapted from Barbur et al 2009. ...32 Figure 15. Correlations between the mean CAD chromatic discrimination thresholds and the axial length (left) and mean spherical equivalent (right). R2 = coefficient of determination. ...57
Figure 16. Correlations between the mean CAD chromatic discrimination thresholds for the red hue and the axial length (left) and mean spherical equivalent (right). R2 = coefficient of determination. ...58
Figure 17. Correlations between the mean CAD chromatic discrimination thresholds for the yellow hue and the axial length (left) and mean spherical equivalent (right). R2 = coefficient of determination. ...58
Figure 18. Correlations between the mean CAD chromatic discrimination thresholds for the green hue and the axial length (left) and mean spherical equivalent (right). R2 = coefficient of determination. ...59
Figure 19. Correlations between the mean CAD chromatic discrimination thresholds for the blue hue and the axial length (left) and mean spherical equivalent (right). R2 = coefficient of determination. ...59
I
NDEX OFT
ABLESTable 1. Chromatic thresholds of the CAD test and the CCT grouped into hues and quadrants. ...48 Table 2. Subjects’ demographics. AL = axial length; M = mean spherical equivalent; J0 = vertical astigmatism component; J45 = oblique astigmatism component; IOPcc = corneal compensated intraocular pressure; IOPg = Goldmann correlated intraocular pressure; CRF = corneal resistance factor; CH = corneal hysteresis; RMS = root mean square; HOA = higher order aberrations; SD = standard deviation. ...51 Table 3. Mean higher-order Zernike coefficients determined by wavefront sensing. SD = standard deviation. ...52 Table 4. Chromatic thresholds of CAD test and CCT expressed in mean and standard deviation. R = red; Y = yellow; G = green; B = blue; Q = quadrant; SD = standard deviation. ...54 Table 5. Non-parametric correlations between refractive error and chromatic discrimination thresholds grouped by hue and quadrant. R = red; Y = yellow; G = green; B = blue; Q = quadrant; = Spearman correlation coefficient; * statistically significant at p-value < 0.05. ...55 Table 6. Non-parametric correlations between axial length, refractive error and the chromatic discrimination thresholds of the CAD test and the CCT, and the chromatic discrimination thresholds grouped by hue and quadrant. AL = axial length; M = mean spherical equivalent; R = red; Y = yellow; G = green; B = blue; Q = quadrant; = Spearman’s rank correlation coefficient; * statistically significant at p-value < 0.05; ** statistically significant at p-value < 0.01. ...56 Table 7. Comparative analysis of chromatic discrimination thresholds of the CAD test and the CAD test hues for axial length and mean spherical equivalent between refractive error groups. AL = axial length; M = mean spherical equivalent; non = non-myopes; low = low myopes; moderate = moderate myopes; high = high myopes. SD = standard deviation; R = red; Y = yellow; G = green; B = blue; * = statistically significant for p-value <0.05; ** = statistically significant for p-p-value <0.01. ...60
1.
L
ITERATURER
EVIEW1.1.
The Visual System
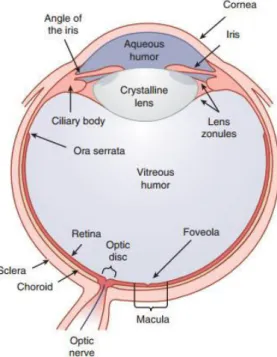
The human eye can be divided into three main layers: the sclera, the uvea and the retina. These layers surround three transparent structures that are responsible for the refraction and transmission of light, from the outside of the eye into its inside, which are the aqueous humour, the vitreous humour and the crystalline lens1,2 (Figure 1).
The outer layer of the eye contains the cornea and the sclera1. The cornea is a transparent
tissue that protects the eye and acts as a refractive lens. It is responsible for most of the refractive power of the eye (two-thirds), with about 43 D3. The sclera is a white connective tissue coat
responsible for the support and protection of the eye and is connected to the cornea through the limbus1,2.
The middle layer, or the uvea, contains the iris, the ciliary body and the choroid4. The iris
is responsible for pupil size and for the amount of light that enters the eye. It constricts in response to higher light levels and dilates when the light level drops1,2.
The choroid is a pigmented vascular tissue and is mainly responsible for the blood and nutrient supply to the retina2.
Figure 1. Cross section of the three main layers of the human eye. Adapted from Schwartz 2010.
The ciliary body is responsible for the accommodation of the crystalline lens and the production of aqueous humour. The ciliary muscle of the ciliary body is able to alter the shape of the lens and its power, making it possible for the eye to focus on near or far stimuli, fluidly – a process called accommodation. The lens is responsible for about one-third of the refractive power of the eye, and has a dioptric power of 20 D3, so a transparent lens is of great importance. Any
change to the lens transparency will prevent the light to seamlessly progress into the retina. The aqueous humour is responsible for the nutrition and the support of the internal structures of the eye, such as the cornea and the lens. The eye drains the aqueous humour through the channel of Schlemm. It maintains an intraocular pressure (IOP) of about 16 mm Hg that is responsible for the structural integrity of the eye. In case of an elevated IOP, when there is an overproduction and/or poor drainage of the aqueous, ganglion cells start to die and retinal damage occurs1, with great impact on the eye peripheral vision first and central vision later.
The vitreous humour is in the posterior chamber, and it fills the space from the lens and ciliary structures to the retina. It is mostly made of collagen and hyaluronic acid and is responsible for the structural support of the retina2. Finally, the inner layer, the retina, acts as the sensory layer
of the eye4.
1.1.1. Retina
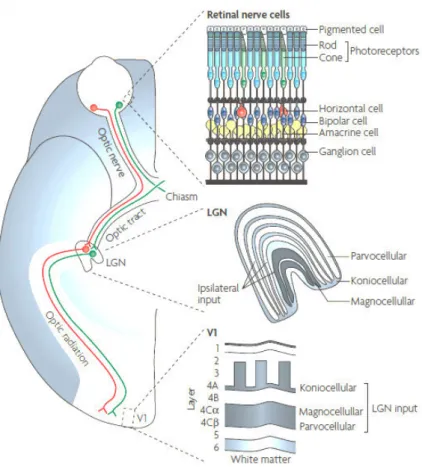
The human retina is a complex nervous tissue responsible for capturing and processing the light that enters the eye5 (Figure 2). It has six major types of distinct cells in its layers. Light
Figure 2. Cross section of the human retinal layers and their major cell types: cones (C) and rods (R); bipolar cells (B); horizontal cells (H); amacrine cells (A); Müller glial cells (M) and ganglion cells (G). Light passes through the inner limiting membrane and the inner retina before reaching the photoreceptors. Adapted from Swaroop, Kim & Forest 2010.
The retinal pigment epithelium (RPE) is the outer layer of the retina. It is mainly responsible for the nutrition of the photoreceptors1,6, for the phagocytosis of the products they release7 and for
the diminishing of light scattering8 by absorption by its dark pigment, which contributes for a clear
image in the normal eye.
Photoreceptors are near the choroid for blood supply and the maintenance of their metabolic activity. They make the outer limiting membrane (OLM) and the outer nuclear layer (ONL). Next to them are the outer plexiform layer (OPL), which connects the photoreceptors to the bipolar and horizontal cells, and the inner nuclear layer (INL), which contains their cell bodies, as well as Müller glial and amacrine cells5,6. Both rods and cones are connected to bipolar cells.
Horizontal cells connect the bipolar cells to the photoreceptors horizontally. Amacrine cells connect the bipolar cells to the ganglion cells also horizontally. Müller glial cells are responsible for trophic and neuroprotection functions and interact with most of the other retinal cells9,10.
The inner plexiform layer (IPL) is comprised by the axons of the bipolar and amacrine cells, which connect to the ganglion cells in the ganglion cell layer (GCL). Next to this layer is the nerve fibre layer (NFL), which contains the axons of the ganglion cells. These form the optic nerve that synapses in the brain1,6. The previous layers are limited by the internal limiting membrane (ILM),
between the retina and the vitreous humour1.
1.1.2. Photoreceptors
There are two types of photoreceptors: rods, responsible for scotopic vision or low light level vision, and cones, responsible for photopic vision or higher light level vision1,6. Rods and cones,
together, are responsible for mesopic vision (twilight)1. Photoreceptors can be divided in an inner
and an outer segment. The inner segment consists of the cell body and the synaptic pedicle. The outer segment contains visual pigment molecules in a stack of disks, with two main components: opsin and retinal (Figure 3). Opsin is a large protein that determines the absorption characteristics of the molecule11. The cones mediate colour vision and there are three distinct types of cones in
the human retina: short- (S-), middle- (M-), and long- (L-), wavelength-sensitive-cones. Each class of cone has a different opsin. In contrast, there is only one type of rod opsin12. Retinal is a
light-sensitive molecule that is identical for all cone photopigments. When the retinal absorbs one photon of light, a series of events take place that result in the transformation of light into electrical signals. This process is called visual transduction8,11.
Figure 3. a) Cone and rod photoreceptors: outer segment (OS) (connected to the retinal pigment epithelium (RPE)), inner segment (IS), cell body (CB) and synaptic pedicle (Syn). b) Human cone photoreceptor distribution mosaic: Short-, medium- and long-wavelength sensitive cones, represented in blue, green and red, are randomly distributed in the retina. Adapted from Swaroop, Kim & Forest 2010.
Photoreceptors are differently distributed across the retina. The fovea, an avascular area of the central retina, contains only cones, in a total of about 1 percent (50 000) of the cones in the retina. At the centre of the fovea, there is a region comprised only by M- and L-cones and without S-cones, the foveola13. The peripheral retina contains both cones and rods, in a total of about 6
million cones and 120 million rods. In the blind spot, the area where the optic nerve leaves the eye, there are neither cones nor rods11.
The cone distribution in the retina seems to be random, both in the centre as well as in the periphery14. A study involving Adaptive Optics Scanning Laser Ophthalmoscopy (AOSLO)
imaging has shown that more than 90% of the human cone mosaic consisted of L- and M-cones and only 5-10% S-cones15. Although with high variation, L-cones tended to outnumber the M-cones15,
which is consistent with other studies15,16. Nevertheless, this variation does not seem to affect colour
vision17. As far as for S-cones, they also seem to have a random distribution in the human retina18.
A study on the photoreceptors packing density has shown a high variability in the distribution both between and within individuals. Curcio and collaborators19 found a distribution
range of 100,000 to 324,000 cones/mm2 in eight cadaver retinas and a mean cone estimation of
about 199,000 cones/mm2. Cone density was higher in the horizontal meridian, especially in the
nasal quadrant (40 to 45% higher) and decreased with increasing eccentricity in the temporal, inferior and superior quadrants, respectively. Rod density was also higher in the nasal quadrant, followed by the temporal, superior and inferior quadrants. The rod-free zone in the fovea had a horizontal oriented ellipse shape with a ratio of 1.29, where the horizontal diameter was 0.350 mm, or 1.25º. In turn, rod density ranged between 77.9 to 107.3 million in the retina, with higher density in the superior quadrant. Other studies have found similar results20–22.
Retinal neurons use pooling to transmit information. There are nearly 130 million photoreceptors in the human retina, but only 5 million bipolar cells and 1 million ganglion cells5.
Therefore, the electrical signals must be pooled together throughout the retina11. Since there are
many more rods than cones, rod signals are much more pooled than cone signals, in an average of 120 rods to one ganglion cell against an average of 6 cones to one ganglion cell, while in the foveola there is up to a 1 to 1 connection. As a result, rods have greater sensitivity and respond faster than cones, but cones have better visual acuity and detailed vision11.
1.1.3. Post-retinal Pathways
Once the optic nerve leaves the retina, it projects the information onto the optic chiasm, where the ganglion cell fibres from the nasal retina cross over to join the temporal fibres of the contralateral eye.The right optic tract will carry the information from the left visual field and vice versa1,23 (Figure 4).
The optic tract transmits information to the lateral geniculate nucleus (LGN), which has six layers. Layers 1, 4 and 6 receive input from the contralateral eye and layers 2, 3 and 5 receive input from the homolateral eye. The LGN has three parallel pathways that process different features of the retinal image: the parvo, the magno and the konio retinogeniculate pathways. The four lateral layers of the LGN consist of parvo cells and the two medial layers consist of magno cells. These layers are intercalated by the konio cells. The parvo pathway is involved in detailed and red-green colour vision. The magno pathway encodes luminance and fast movement. The konio pathway is involved in yellow-blue colour vision1.
Figure 4. Visual pathway. Information from the retinal nerve cells passes through the optic nerve, and the information from the nasal retinas is crossed in the optic chiasm. The optic tract conducts the information to the lateral geniculate nucleus (LGN) layers. Cortical area V1 receives the information from the three pathways of the LGN. Adapted from Solomon & Lennie 2007.
The axons of the LGN end in the striate visual cortex or visual area 1 (V1), the cortical area of the cerebral cortex: parvo cells project to layer 4Cβ, magno cells to layer 4Cα, and konio cells to lower layer 3 and layer 4A23. The cells of the striate visual cortex project their axons to nearby
cortical areas of vision in the extra-striate visual cortex, and from there onto several higher cortical areas. These will be partly responsible for the integration of visual information with memory and other sensory perceptions1.
1.2.
Colour Vision
1.2.1. Light and Colour
Visible light is the part of the electromagnetic (EM) spectrum that is detected by the human eye (Figure 5). It ranges from 400 (short-wavelengths) to 780 nm (long-wavelengths). Wavelengths from about 400 to 450 nm are perceived as violet; 450 to 490 nm, as blue; 500 to 575 nm, as green; 575 to 590 nm, as yellow; 590 to 620 nm, as orange; and 620 to 780 nm, as red11, by
colour normal observers.
The amount of the wavelengths of the light spectrum reflected by an object is responsible for the colour perception, and produces the hue of the object, like red, green or blue11. The
probability of a cone absorbing a photon of a given wavelength depends on the wavelengths that reach the eye, in terms of the number of photons per wavelength (principle of univariance)24. This
determines the spectral sensitivity of a cone, which is different for each cone class. The genes of the three cone types, S, M and L, that are responsible for the three maximum photon absorptions
Figure 5. The electromagnetic spectrum. Visible light is only a small part of the spectrum. Wavelength is in nanometres (1 nm=10-9 m). Adapted from Goldstein 2013.
have been isolated and sequenced, and their opsins have been identified in the past25. Their
maximums lie in the short- (419 nm), middle- (531 nm) and long-wavelength (558 nm) sections of the visual spectrum12,26,27. The overlap between the L- and M-cone absorption spectra allows for the
combination of the cone signals and improves visual acuity at the fovea28. Thus, colour vision at the
photoreceptors level is trichromatic and is mediated by these three cone types29. Rods have their
absorption peak in 500 nm12, but are not involved in colour vision2.
Changes to the spectral sensitivity of the cones of the eye may have an impact on the colour perception of the colours that reach the eye. If the three cone types are present but their maximum sensitivity is shifted, these observers are called anomalous colour vision observers, specifically deuteranomalous (a shift on the M-cone) or protanomalous (a shift on the L-cone). A great variability of shifts is commonly found on the S-cone of normal colour vision observers, and as such there is no classification of a tritanomaly observer. If one of the cone types is missing, the observer is called dichromat: protanope, deuteranope and tritanope if the L-, M- or S- cone is missing, respectively. Other types of colour vision deficiency are possible (for example monochromacy), but will not be further explored in this work29.
Regarding the ganglion cell information processing, colour perception is converted into opponent processes due to three neural mechanisms: two opponent channels for colour and a luminance channel. In the luminance or L+M channel, L- and M-cones signals are summed to compute the intensity of a stimulus. In the red-green or L–M colour opponent channel, the signals of L- and M-cones are subtracted from each other to compute the red-green component of a stimulus. In the yellow-blue or S–(L+M) opponent channel, the sum of the signals of L- and M- cones is subtracted from the signal of S-cones to compute the yellow-blue component of the stimulus. These channels match the three pathways of the LGN described before30,31.
1.2.2. Chromaticity Diagrams: The CIE Colour Specification System
In 1931, the Commission Internationale de l’Eclairage (CIE) created the CIE colour space chromaticity diagram, commonly referred to as the x, y chromaticity diagram. It works as an objective colour measurement system to match the colour perception of a given observer. The colours in the diagram are specified based on the trichromatic colour matching results of a normal trichromatic observer with a 2° field of view29.
In the CIE 1931- x, y chromaticity diagram, all colours can be matched with the mixture of positive amounts of three primaries in the red, green and blue regions of the electromagnetic spectrum, by varying the amount of each primary in the match29,32. Consequently, the adding of the
three primaries in equal amounts will produce white. However, sometimes the trichromatic mixture is too desaturated to match the test colour exactly, so, in order to obtain the exact match, an additional desaturating colour must be added to the test colour29. To do so, it requires the use of
imaginary colours, or primaries29. The CIE primaries are designated as X, Y and Z, and their relative
amounts are x, y and z 33:
= + + = + + = + + .
The sum of these amounts equals 1, so only two amounts, x and y, need to be quantified, and the total colour range can be represented in a two-dimensional diagram for each luminance level29. This means that white and all grey shades are mapped in the same coordinate. Also, many
browns are mapped in the same coordinates as yellows and oranges. All additive mixtures of pairs of colours must lie along a straight line that connects them, hence the shape of the diagram32. For
instance, the bottom line from the short- to the long-wavelength is known as the purple boundary as it includes all the purple colours that come from the mixture of violet and red33 (Figure 6).
Figure 6. The CIE-x, y 1931 chromaticity diagram. On the left, x and y are the coordinates that represent chromaticity coordinates. All the monocromatic colours experiences lie along the limiting contour, ranging from 380 to 780 nm. All the other colours result form combinations of these colours. On the right, each line represents a perceptual colour difference of the same magnitude and luminance across the diagram. The length of the lines should be the same for uniformity purposes. Adapted from
The CIE-x, y 1931 chromaticity diagram has the disadvantage of a highly non-uniform colour distribution. When plotting two colours of a perceptual difference of the same magnitude and luminance, their representation in the diagram is very different – the lines have very different lengths33, as is represented on the right hand side of Figure 6. In order to minimize this effect, CIE
created a new diagram with the same properties as the previous one and based on it, but with different chromaticity coordinates – the CIE 1976 uniform chromaticity scale (UCS) diagram, commonly referred to as the u’, v’ diagram –, which is obtained by plotting u’ against v’ (Figure 7). On the right hand side of Figure 7, the uniformity can be ascertained by observing the higher regularity in the length of the plotted lines, and where33:
′ = + + = − + + ′= 9 + + = 9 − + +
Figure 7. The CIE 1976- u', v' uniform chromaticity diagram, with u', v' coordinates. On the left, additive mixture of colours are represented by points lying on the straight line joining the points that represent constituent colours, ranging from 380 to 780 nm. On the right, each line represents a perceptual colour difference of the same magnitude and luminance. The lengths of the lines are more similar than for the x, y coordinates. Adapted from http://www.efg2.com (left) and Hunt & Pointer 2011 (right).
The u’, v’ diagram is very useful for tracing the confusion lines which consist of the positions of colours of equal luminance likely to be confused by observers that do not have a normal colour vision perception, but the x, y is still the norm33.
In chromaticity diagrams, the chromatic discrimination of an observer is represented by a series of ellipses. The size of each ellipse varies according to the chromaticity coordinates of the
colour under testing and represents the ability of the observer to distinguish colours29. The larger
the ellipse, the poorer the chromatic discrimination of the observer.
1.2.3. Colour Confusion Lines
Colour confusion lines include all colours that are indistinguishable for dichromats, who lack one of the cone types. All the sets of confusion lines originate from the same virtual point for each defect (Figure 8). Confusion lines are why protan (L-cones missing) and deutan (M-cones missing) defects are often referred to as red-green, because a protan confuses blue-green with red and a deutan confuses blue-green with reddish purple. On the other hand, a tritan defect is also referred to as blue-yellow because they confuse blue-violet and yellow stimuli1.
1.2.4. Colour Vision Tests
There are several colour vision tests that are used in clinical practice to identify and grade colour vision deficiencies29: screening tests (normal or abnormal colour vision); classifying tests (in
protan, deutan or tritan defect); grading tests (for the severity of the defect); diagnosis tests (type of deficiency, dichromat or anomalous trichromat), and, finally, occupational tests (selection of personnel for specific occupations that require good colour vision). They can also be used to assess some retinal pathologies and their effects on colour vision and to measure their progression34.
The psychophysical methods used for colour vision tests are varied. Visual tasks may consist of colour matching, identification of a figure, arrangement of a sequence of hues or colour Figure 8. Colour confusion lines plotted on the CIE-x, y 1931 chromaticity diagram for (A) deutan, (B) protan and (C) tritan subjects. All lines origin at a different point for each colour vision defect. Adapted from Schwartz 2010.
naming. Currently, the widest application tests for colour vision screening are pseudoisochromatic tests29.
Pseudoisochromatic tests involve the identification of a figure. Test plates are made of coloured patches that vary in size and lightness and that are placed in a way that a normal colour vision observer is able to correctly identify the figure, but a colour deficient observer is not. That is due to the fact that the figure and the background are coloured within isochromatic regions based on colour confusion lines that seem to have the same colour to them. Also, the circular patches in a matrix design helps disguising the outline and the shape of the figure29.
Computerized pseudoisochromatic tests usually use a staircase procedure to grade the defect severity29: the test starts with an easily detectable stimulus over its background that
decreases intensity (in saturation) each time the subject responds correctly, until an error occurs. This is a crossover point, when the stimulus is not differentiated from its background. The next stimuli presented are made easier to detect until the participant is able to detect them again over the background. This is another crossover point. At this point the threshold is the mean value between the two crossover points. This procedure is then repeated several times and, in the end, the chromatic thresholds of the observer are obtained by averaging the crossover points11.
Only two computerized colour vision tests will be used in this work and hence described fully: the Cambridge Colour Test (CCT) and the Colour Assessment and Diagnosis Test (CAD).
1.2.4.1. Cambridge Colour Test
The Cambridge Colour Test (CCT) allows the screening of colour vision deficiencies and the monitoring of changes in colour discrimination that occur due to congenital or acquired colour vision deficiencies35.
The CCT is based on the pseudoisochromatic principles described above. It consists of a C shaped target that differs in chromaticity from the background (Figure 9). Both the target and the background consist of discrete colour patches of randomized luminance. Each patch has its own contour. The C is randomly presented in four different positions – up, down, left and right – and the observer must identify the orientation of the gap of the letter. It is presented in several levels of saturation and hue along the confusion lines of the protan, deutan and tritan defects. The
difference in chromaticity between target and background is adjusted according to the performance of the observer35,36. The bigger the difference, the worst the chromatic discrimination of the observer.
This test determines the step sizes of the staircases and measures chromatic thresholds within the CIE-u’,v’ 1976 chromaticity diagram, mainly due to its uniformity35. The normal result
output consists of discrimination ellipses with an axis ratio less than 2.035 (Figure 10).
Colour deficient observers will exceed the ratio mentioned above. The direction of the axis of the major ellipse indicates the type of deficiency, and the longer the axis, the more severe the defect is. For protan and deutan defects, the ellipses are horizontal, with a different orientation,
Figure 9. C-shaped target of the Cambridge Colour Test with two different orientations. Adapted from Mollon & Regan 2000.
Figure 10. CCT results for a normal observer, with three ellipses from three different background chromaticities. The small crosses are the individual thresholds for the different hue directions. Adapted from Mollon & Regan 2000.
but typically oriented along the confusion lines. For tritan defects, the ellipses are oriented along tritan confusion axes35 (Figure 11).
1.2.4.2. Colour Assessment and Diagnosis Test (CAD)
The CAD test is also based on pseudoisochromatic principles. It presents a diagonally moving coloured square stimulus in a luminance dynamic grey background. It isolates the colour signals in a dynamic luminance contrast noise, so that the observer is unable to use residual luminance signals as clues to detect the test stimulus37 (Figure 12).
Figure 12.Moving squares in a dynamic background of the CAD test. The coloured square moves randomly in the diagonal and the observer must identify its direction. Adapted from Barbur, Rodríguez-Carmona & Harlow 2006.
Figure 11. CCT results for colour deficient observers. (a) Protan, (b) deutan and (c) tritan observer. The major axes of the ellipses are oriented along the confusion lines for each deficiency. Adapted from Mollon & Regan 2001.
The thresholds are measured along several directions of the colour space (different hues), which allows for the measurement of any chromatic sensitivity loss and the classification of minimal defects that are undetected in the standard colour vision tests38. The resulting ellipses are plotted
on the CIE-x,y 1931 chromaticity diagram38,39.
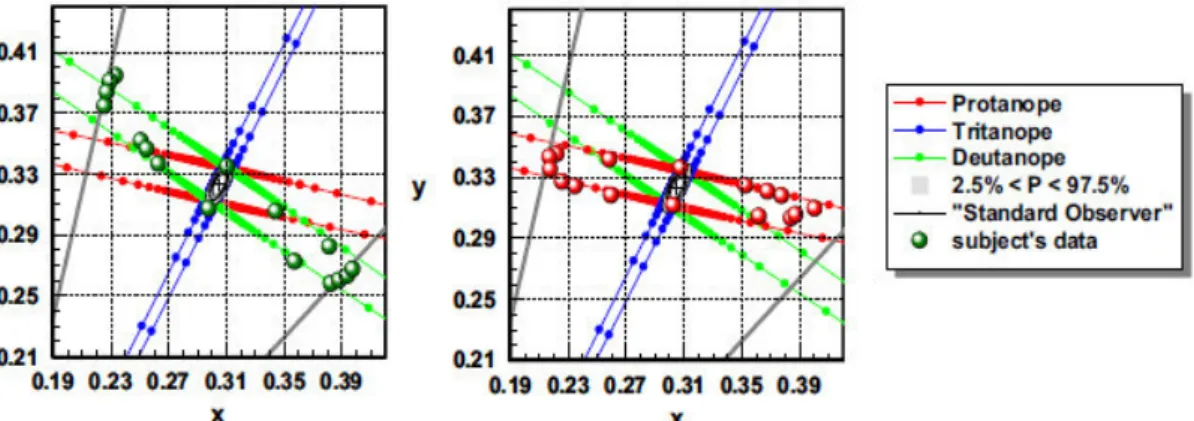
This test was used to establish the chromatic sensitivity in 250 normal and 300 colour deficient observers40. Figure 13 represents the results for a normal trichromat. The grey region
represents the normal variability in both red-green and yellow-blue thresholds, including the median (black-dotted ellipse). It is the region in the CIE diagram where the results of 95% of the normal observers lie, and it is limited by the 2.5% and 97.5% corresponding statistical limits. The deutan, protan and tritan confusion bands are displayed in green, red and blue, respectively. The black cross (0.305, 0.323) indicates background chromaticity (x, y). The dotted black ellipse represents the median chromatic discrimination threshold for the standard normal observer and allows for the assessment of the severity of colour vision loss40.
The CAD test diagnoses the type of deficiency through the elongation of the ellipses major axis along the deuteranopic (Figure 14, left) or protanopic (Figure 14, right) confusion lines. The higher the chromatic discrimination threshold value, the more severe the defect is40.
Figure 13. Results of a normal trichromat CAD test observer. The results are plotted in the CIE-x,y 1931 diagram. The black-dotted ellipse represents the median for 250 normal trichromats. The grey region represents the threshold limits for 95% of the normal observers. The inner and outermost ellipses are the 2.5% and 97.5% corresponding statistical limits. The deutan, protan and tritan confusion bands are displayed in green, red and blue, respectively. The black cross (0.305, 0.323) indicates background chromaticity (x,y). Adapted from Barbur, Rodriguez-Carmona, Evans & Milburn 2009.
The CCT is the standard computerized test for the fast screening of colour vision deficiencies and acquired defects34. On the other hand, the CAD test was developed to detect and measure
minimum changes in chromatic sensitivity39. It is currently the standard testing protocol for English
pilots and traffic controllers41 and is being applied to underground train drivers42. Therefore, different
results should be expected in the frontier cases of colour vision anomalies when using both tests.
1.3.
Myopia
1.3.1. Myopia and Visual Impairment
Refractive error causes the retinal image of a distant object to be blurred, if uncorrected, and currently is a major cause for visual impairment worldwide43. Myopia is the most common
refractive error in children from 5-15 years old in the present day43 and may be corrected with
prescription glasses, contact lenses or refractive surgery44.
Clinically speaking, an eye with an axial length greater than 25 or 26 mm or a refractive error more negative than -6 D is considered highly myopic45,46. High myopia is a significant risk
factor for visual impairment in the general population and has the highest percentage of bilateral blindness and low vision of all of the refractive errors47.
Figure 14. Chromatic thresholds for two colour vision deficient observers with severe colour vision deficiency. Grey lines represent the largest chromatic displacements away from background chromaticity that are set by the isoluminant condition and the limits imposed by the phosphors of the display. The greater the elongation along the deuteranopic (left) or the protanopic (right) confusion lines, the lower the level of chromatic sensitivity and the greater the colour vision loss. Adapted from Barbur et al 2009.
1.3.2. Worldwide Prevalence of Myopia
Recent reviews have shown that the prevalence of myopia varies among populations of different ages, regions and ethnicities48,49. Children from urban areas and from East Asian countries,
namely, China, have the highest myopia prevalence rates48–50. Specifically, children from urban
areas have 2.6 times higher chances of developing myopia than those from rural ones50. As for
adults, Asian populations show the highest prevalence of myopia in comparison with Western-based populations, however, this difference is smaller than for children populations48.
A recent systematic review and meta-analysis studied the global prevalence of myopia and established its temporal trends through the analysis of 145 studies published from 1995 to 2015. This study estimates that in the year 2000 more than 20% of the world population (1406 million people) had myopia, and that by the year 2050 that percentage is expected to increase to nearly 50% (4758 million people). Correspondingly, in 2000, almost 3% of the world population (163 million people) had high myopia, which is expected to increase by 2050 to 10% (938 million people)51.
1.3.3. Risk Factors for Myopia
Several genes responsible for molecular and biological mechanisms of the eye have been recently identified in the development of refractive error, but environmental factors also seem to have a determinant role, which suggests that myopia is multi-factorial in its origin and depends on both genetic and environmental factors44,49,52. The major risk factors that are currently considered to
be related to myopia are peripheral refraction, parental myopia, near work activities and time spent outdoors44,49.
1.3.3.1. Peripheral Refraction
Peripheral refraction is known to be different from the individual refraction. Emmetropes have similar central and peripheral refraction, and a spherical eye shape. Myopic adults usually have a hyperopic peripheral refraction, and hyperopic adults a myopic peripheral refraction53. This
is also found in children54,55. The hyperopic peripheral refraction is associated with an prolate-shaped
Animal studies suggest that hyperopic peripheral defocus induces eye growth and, consequently, influences the emmetropization process57. Correspondingly, a study involving
peripheral refraction in children has shown a change from relative peripheral myopia to relative peripheral hyperopia in those who developed myopia, although the baseline relative to the peripheral refraction did not predict the development or progression of myopia58.
In other studies, there seems to be an association between peripheral refraction and myopia progression. Peripheral refraction was found to be significantly more hyperopic and the nasal retina was found to be significantly steeper in progressive than in stable young adult myopes59.
In a different study, the rate of myopia progression was weakly correlated with changes in the peripheral refraction of the nasal retina of four treatment groups of 14 to 22-years-old myopes (altered spherical aberration and vision training, altered spherical aberration only, vision training only, and control), but no significant differences were found between groups60. So, a causative link
between peripheral refraction and myopia progression remains unproven, but an association does seem to exist60 and this potential risk factor should not be discarded.
1.3.3.2. Parental Myopia
Several studies investigating the influence of parental myopia in the development of myopia in children have found significant associations between them both61–63. Children with a less
hyperopic refraction and at least one myopic parent are at greater risk of becoming myopic62,64,65.
Accordingly, parental myopia seems to be linked with a more negative refraction and a greater axial length in their offspring61,64. In myopic children, those who are younger and have a more negative
refraction and two myopic parents are at higher risk of developing high myopia66.
Genetic studies have found an association between genes, ocular refraction and biometry67,
and several genes have been identified in association with high myopia68. However, the fact that
families share both the same environment and culture is a confounder for the effect of genetic traits in the development of myopia69. Accordingly, environmental and behavioural factors should
1.3.3.3. Near Work
A larger amount of time spent in near work activities has been positively associated with a higher risk for myopia development in Turkish70 and Taiwanese children71. The number of books
read per week as a measure of near work activity was found to be associated with high myopia and early onset myopia in Asian children72. Even so, due to the young age of the participants and
the fact that their myopia is of early onset, this association may not be a risk factor. Instead, it is likely influenced by environmental and/or genetic factors72. Short reading distance and reading for
more than 30 minutes straight have been positively correlated with the development of myopia in Australian children, rather than total time spent reading73.
In another study, near work activities were significantly, although weakly, associated with myopia development in American children of several ethnicities. Instead, parental myopia had a much larger effect, along with others factors such as sports practice and academic performance by a smaller degree. This does not support a truly significant effect of near work activities in myopia development, but suggests that there are several factors at play74.
In contrast, a study involving rural Chinese children has shown no association between time spent in near work activities and myopia development75. In conclusion, the effect of near work
activities on myopia remains unclear, but it should be considered along with genetic, familiar and other environmental factors.
1.3.3.4. Time Spent Outdoors
Studies show that children who spend more time in outdoor activities are at a lower risk of developing myopia76,77. Even in children who spend a long time in near work activities, those who
spend more time outdoors are less likely to develop myopia. Outdoor sports practice seems to be correlated with a lower myopia development, but no association was found between indoor sports and myopia78. Also, time outdoors has a more significant effect in comparison to sports practice,
when considered separately79. Therefore, time spent outdoors rather than sports practice seems to
protect against the development of myopia.
Time spent outdoors influences several biological mechanisms that may be responsible for this protective effect. Dopamine light-stimulated release is influenced by time spent outdoors, and
seems to prevent excessive eye growth80. Thus, high ambient light levels seem to prevent eye
growth, as they promote dopamine release in the retina 81. Also, higher light intensity may increase
the depth of field and decrease blur78. Despite all this, time spent outdoors does not seem to prevent
myopia progression82,83, so further studies are needed.
1.3.4. The Myopic Retina
1.3.4.1. Cone Photoreceptor Packing Density
Due to the retinal stretching caused by the increasing axial length in myopic eyes, cone spacing is expected to be wider and cone packing density is expected to decrease20. Consequently,
the variation of the density of the human cones with axial length and refractive error has been recently studied in vivo using AOSLO. The eyes of healthy young adults were shown to have a significant negative correlation between axial length and refractive error21,22. Cone packing density
was found to be significantly lower in moderate-to-high myopes than in emmetropes and low myopes20,22,84. The cone packing density was also found to decrease with increasing eccentricity and
axial length in these subjects20,84,85.
Factors such as gender, ethnicity and ocular dominance do not seem to influence cone density85. Age, however, has a less evident effect. Some studies have failed to find an association
between cone density and age85,86 although others have found that cone density significantly
decreases in the central fovea in older subjects in comparison with younger ones87,88.
1.3.4.2. Retinal Function
There are several ways to measure retinal function, ranging from interference fringes, contrast sensitivity and spatial summation tasks to electroretinography.
Coletta & Watson89 studied how myopia affects visual acuity with interference fringes in
young adults. Visual acuity was not to significantly affected when optical factors were corrected, but a significant decrease in retinal acuity was found with increasing myopia in the fovea and at 10º eccentricity. This suggests that the magnification of the retinal image due to the excessive axial length compensates the effect of the wider space between retinal cells in high myopes.
There also seems to be some degree of contrast sensitivity loss in high spatial frequencies in high myopes, especially when wearing spectacles in comparison to contact lenses, which may be an indicator of loss of visual function prior to pathological changes of the fundus90. The use of
contact lenses may improve the contrast sensitivity function due to the increase in the size of the image projected at the retina.
Studies involving spatial summation tasks that aimed to assess retinal integrity and visual performance of highly myopic eyes have observed increased critical areas for myopic subjects, when compared to emmetropic subjects45,91. This points to losses of visual function in these
subjects, due to a loss of sensitivity of either the photoreceptors or the post-receptoral neurons (ganglion cells) in the enlarged eye45,91.
Other studies have investigated changes in retinal function of young healthy adults, ranging from emmetropes to high myopes, using multifocal electroretinography (mERG). Retinal responses were found to decrease significantly with increasing myopia92,93.These results suggest a cone loss
function due to the morphological changes that are produced by the increment of the axial length in the myopic eye92,93.
In the same way, when studying the relationship between retinal structure and function in highly myopic young subjects, Koh and collaborators94 found decreased amplitudes in full-field
electroretinography (ffERG) results, but normal outer macula and retinal nerve fibre layer thickness, meaning that functional changes precede structural changes in these subjects.
The previous studies point to the same conclusion, that retinal function may be compromised due to the excessive elongation of the myopic eye, which may affect the function of photoreceptors and post-receptoral processes before any structural or pathological changes are present or visible.
1.3.5. Wavefront Aberrations and Myopia
Wavefront aberrations result from light scattering induced by the ocular media. They can have an effect in the retinal image and impact the quality of vision. Wavefront aberrations are often expressed in Zernike coefficients, which are distributed in several magnitude orders. First order aberrations usually have the highest values, and tend to decrease as the order of the coefficients increase. Second order aberrations include the sphero-cylinder aberrations and can be corrected
with an optical prescription. Terms higher than the second order are known as the higher order aberrations (HOAs). The sum of the HOAs values are approximately zero, and the highest contributions come from the fourth order spherical aberration and third order coma. These are unable to be compensated by the usual optical prescription means95,96.
Several studies have been conducted to see if HOAs differ between myopes and non-myopes, and although some early studies did find that myopes had higher HOAs, methodological limitations constrain these findings, and other more recent studies with more objective methods found none (for a review, see Charman95). So, there is a lack of evidence supporting the role of
wavefront aberrations in the development of myopia at the present time, but it is believed that higher levels of HOAs may be found in some stages of the process, as a consequence of the eye actively shifting its refraction95.
1.3.6. Chromatic Signals and Myopia
Short-wavelengths have a shorter focal length than long-wavelengths due to the eye’s optical components chromatic aberration. This phenomenon blurs part of the retinal image decomposing the image into blurred coloured components97. In a black and white edge, the edge
will have a fringe of the colour of the blurred farthest wavelength. The fringe will be red when there is a hyperopic defocus (blue is focused and red and green are blurred). And the fringe will be blue in a myopic defocus (red is focused and green and blue are blurred)98. Consequently, when a
hyperopic defocus of the longer-wavelength light is present, the eye will use the signal of the most focused colour (the blue one) and grow to try to compensate it99. It was also found that
long-wavelength light seems to induce myopia in some mammals. Guinea-pigs exposed to green light showed a suppression of melatonin production (regulator of eye growth) and suffered a myopic-shift in their refraction, by vitreous chamber and overall axial elongation100. On the contrary, chicks
exposed to blue light by a larger amount of time than other chicks maintained their refraction and seemed to enjoy a protective effect101.
In humans, there also seems to be a relationship between colour vision and myopia development. A study involving Chinese teenage students found that students with normal colour vision were more myopic and had more elongated eyes than students with protan and deutan
defects102. Furthermore, other studies found that myopic subjects are more sensitive to
long-wavelength stimuli than emmetropic ones, when the myopia is effectively stablished97,103.
1.3.7. Pathologic Myopia
The stress induced by the excessive stretching of the eye may causes several degenerative changes in highly myopic eyes, leading to severe complications that include vision loss104.The highly
myopic eye becomes deformed in shape, instead of the spherical shape of an emmetropic eye or the prolate shape of low or moderate myopes, and its scleral and choroidal thickness tends to decrease105. These changes are associated to posterior staphyloma, chorioretinal atrophy and
choroidal neovascularization, lesions of pathologic myopia104,105. Since almost 1 billion people will
be at risk of suffering myopia-related ocular complications and vision loss in the near future51,
2.
H
YPOTHESIS ANDA
IMS OF THES
TUDY2.1.
Problem Formulation
Recent findings have shown that the cone photoreceptor density in myopic eyes differs from non-myopic, being lower in the first ones. High myopic eyes have also been shown to suffer significantly functional losses due to the pressure of an excessive axial length. Accordingly, it is possible that the colour discrimination of high myopes may be limited when compared with non-myopes. High myopes are at greater risk to develop pathological fundus changes associated to pathological myopia, including cone loss. Therefore, it is important to determine when the functional losses become significant and to be able to monitor them before they turn into structural losses. The determination of the chromatic discrimination thresholds may be relevant in the assessment of such losses.
2.2.
Hypothesis
1. The axial length and refractive error are related to the chromatic discrimination thresholds; 2. Subjects with high myopia (< -6 D or an axial length > 25 mm) have significantly different
chromatic discrimination thresholds in comparison to the remaining subjects.
2.3.
Aims
The main goals of this thesis are:
1. To assess the differences in colour perception between myopic and non-myopic subjects; and
2. To evaluate these differences as a possible tool for the detection and monitoring of pathological myopia.
3.
M
ATERIAL ANDM
ETHODS3.1.
Study Design
Little is known about the correlation between the length of myopic eyes, their refractive power and its impact on the colour vision discrimination.
Being a preliminary study, the primary goals of this work were to compare the differences between the colour discrimination thresholds of myopes and non-myopes observers and relate it with their refractive and axial length status. It was divided in two major parts: first, the objective refractive error and the eye axial length were measured, and, second, the chromatic discrimination thresholds were determined.
This study took place at the Clinical and Experimental Optometry Research Lab (CEORLab) and the Colour Science Lab at the University of Minho (Braga, Portugal). All the instruments used in this study were available at the CEORLab (part 1) and at the Colour Science Lab (part 2). All participants signed a Consent Form once the purpose and procedures of the study were fully explained to them (appendix 1). All the experimental procedures performed were non-invasive.
3.2.
Participants and Sample Size
Participants were recruited from the academic community. All participants had to be 18 to 29 years-old and generally healthy. Inclusion criteria also required ocular media transparency, the absence of pathological changes of the fundus, no history of ocular complications and/or surgery and normal intraocular pressure.
At first, 43 participants were enrolled in the study, but one of the participants had a vitrectomy due to a retinal detachment at a young age and had to be excluded. All the other participants met the inclusion criteria, and a total of 42 subjects completed the study.
3.3.
Experimental Procedure
All measures were taken between the months of May and August of 2016. First, the participants were asked about their ocular history, general health history and family health history,
and afterwards the refractive error and visual acuity were determined, along with the ocular health assessment and the axial length measurement (appendix 2). If the participants met the inclusion criteria, they would then perform the chromatic thresholds determination tests.
3.3.1. Refractive Error
The habitual eyeglass or contact lens prescription of the participants was recorded, using the focimeter or the original blisters information, respectively. The refractive error was also objectively determined by the Grand Seiko WAM-5500 open field refractometer (Grand Seiko Co. Ltd., Hiroshima Japan). Five measures were taken for each eye and their mean values were recorded, after ensuring that the participants were comfortably seated and had their head and chin pressed against the rests.
The mean sphere (S), negative cylinder (C’) and cylindrical axis (α) were converted to power vectors (M, J0 and J45) for the statistical analysis of the refractive data. The M component expresses
the mean spherical equivalent, and J0 and J45 express the vertical and oblique astigmatism
components, respectively. J0 is positive for with-the-rule astigmatism and negative for
against-the-rule astigmatism. J45 is positive for 45º and negative for 135º106.
� = � + �′⁄ �0= − �′⁄ cos �
� = − �′⁄ sin �
3.3.2. Visual Acuity
Visual acuity was measured with the habitual prescription and using the Logarithmic Visual Acuity Chart ETDRS distance chart (Precision Vision, La Salle IL, USA) at 4 meters, as recommended by the manufacturer. The ETDRS distance chart used consists of 14 lines with 5 letters each, that are arranged in a geometric progression and printed in high contrast. Each letter has a score value of 0.02 log units. The chart measures visual acuities between 1.0 LogMAR units (0.1 in decimal scale) and -0.3 LogMAR units (2.0 in decimal scale), and the line of 0.0 LogMAR matches 1.0 in decimal scale. Measures were monocular and binocular and room luminance was
at a photopic level of 85 cd.m-2. The score value for each eye was recorded and used as the metric
of the visual acuity.
3.3.3. Ocular Health Assessment
Ocular health was assessed through slit lamp observation, tonometry and retinography, and an optometric assessment was written down in each participant’s clinical chart. Throughout the procedure, it was ensured that the participants were comfortably seated in front of each instrument, with their chin and/or forehead pressed against the chinrest and they were instructed to look at the different fixation targets or relevant directions.
Slit lamp observation was performed in order to evaluate the ocular media transparency and to guarantee that there were no opacities that could impact the colour vision of the participants. The Cobra non-mydriatic fundus camera (C.S.O. SRL, Firenze, Italy) was used for retinal imaging. The participants were told to look at the orange fixation target and warned that there would be a flash for the image acquisition. An optometric decision was then made based on the image acquired. A normal fundus, even a characteristically myopic fundus, was required to ensure a normal function of the retina.
Tonometry was performed with Ocular Response Analyzer (ORA) (Reichert Inc, Buffalo NY, USA). The ORA tonometer measures the Goldmann-correlated intraocular pressure (IOPg), the corneal compensated intraocular pressure (IOPcc), which is compensated for the corneal biomechanical properties by measuring the corneal resistance factor (CRF) and the corneal hysteresis (CH) (also in the output). The participants were instructed to look at the green fixation target, which was surrounded by four red lights and to open their eyes wide. Four measures were taken for each eye and the mean values were estimated and recorded. A normal intraocular pressure was required to exclude high intraocular pressure as a source of retinal ganglion cell death.
3.3.4. Wavefront Aberrometry
Wavefront aberrometry was measured using the IRx3 aberrometer (ImaginEyes, France). Three measures were made for each eye in scotopic conditions without induced mydriasis. The
participants were instructed to look at the fixation target and to blink three times before the measure was taken.The mean values of the root mean squares (RMS) from the third to the sixth order, the HOAs and the coma and spherical aberrations were determined for a 5-mm pupil.
3.3.5. Axial Length
The axial length was measured with the ZEISS IOLMaster Optical Biometer (Carl Zeiss, Jena, Germany). This instrument measures the signal produced by the interference between the light reflected by the tear film and that reflected by the retinal pigmentary epithelium along the visual axis, yielding the axial distance in millimetres. The participants were instructed to look at the fixation target and to blink three times. Five measures were taken for each eye to obtain the mean axial length.
3.3.6. Chromatic Thresholds Determination
After checking for the normal ocular health and the determination of the refractive error and axial length, the participants performed two colour vision tests: The Cambridge Colour Test (CCT) (version 2.31, Cambridge Research Systems Ltd.) and the Colour Assessment and Diagnosis Test (CAD) (version 2.3.1.1, City Occupational Ltd.).
Each test ran for about ten minutes and was repeated twice, with small breaks between tests so that the participant could rest. While performing the tests, the participants wore a trial frame with the habitual prescription (if needed) to eliminate the influence of different filters and treatments of their personal refractive correction. All tests were binocular so they would be completed in only one visit. All tests were performed in a dark room in order to minimize distraction and potential chromatic clues.
3.3.6.1. Cambridge Colour Test
Each plate of the CCT was displayed for 4 seconds and the participants had to identify the orientation of the gap, out of four possible directions (up, down, left and right), by responding on a keypad. The gap should subtend 1° of visual angle, so the participants were seated at 3 meters