Braz. J. of Develop.,Curitiba, v. 6, n. 10, p.83564-83578, oct. 2020. ISSN 2525-8761
Productivity of soybean as a function of soil compaction and doses of
phosphorus
Produtividade de soja em função da compactação do solo e doses de fósforo
DOI:10.34117/bjdv6n10-698
Recebimento dos originais: 13/09/2020 Aceitação para publicação: 30/10/2020
Gustavo Ferreira Da Silva
Doutorando em Agronomia (Agricultura) - Universidade Estadual Paulista "Júlio de Mesquita Filho" - UNESP/FCA - Botucatu
Endereço: Avenida Universitária, nº 3780, CEP:18610-034, Altos do Paraíso, Botucatu, SP, Brasil.
E-mail: [email protected] Nilbe Carla Mapeli
Doutora em Fitotecnia - UFV - Viçosa - MG
Professora Adjunta - Curso de Agronomia - UNEMAT – Cáceres – MT
Endereço: Av. Santos Dumont, s/n°, Cidade Universitária, Bloco I, CEP: 78.211-298, Cáceres-MT.
E-mail: [email protected] Cassiano Cremon
Doutor em Agronomia - UFGD - Dourados - MS
Professor Adjunto - Curso de Agronomia - UNEMAT – Cáceres – MT
Endereço: Av. Santos Dumont, s/n°, Cidade Universitária, Bloco I, CEP: 78.211-298, Cáceres-MT.
E-mail: [email protected] Gabrieli Ferreira Da Silva
Graduanda em Engenharia Florestal - IFMT-Cáceres-MT
Endereço: Av. dos Ramires, Distrito Industrial, CEP: 78.200-000, Cáceres, MT. E-mail: [email protected]
Bruno Cesar Ottoboni Luperini
Doutor em Patologia - UNESP/FMB - Botucatu-SP Professor do Centro Brasileiro de Cursos-CEBRAC Botucatu-SP Endereço: Av. Santana, 563 - Centro, CEP: 18600-020, Botucatu - SP,
E-mail: [email protected] Larissa Chamma
Doutoranda em Agronomia (Agricultura)-Universidade Estadual Paulista "Júlio de Mesquita Filho" - UNESP/FCA - Botucatu
Endereço: Avenida Universitária, nº 3780, CEP: 18610-034, Altos do Paraíso, Botucatu, SP, Brasil.
Braz. J. of Develop.,Curitiba, v. 6, n. 10, p.83564-83578, oct. 2020. ISSN 2525-8761 Altacis Junior De Oliveira
Mestrando em Genética e Melhoramento de Plantas – UNEMAT – Cáceres – MT Endereço: Av. Santos Dumont, s/n°, Cidade Universitária, Bloco I, CEP: 78.211-298,
Cáceres-MT.
E-mail: [email protected] Adeilson Nascimento Da Silva
Mestrando em Agricultura Tropical - UFMT - Cuiabá - MT
Endereço: Av. Fernando Corrêa da Costa, 2367, Boa Esperança, CEP: 78060-900, Cuiabá-MT E-mail: [email protected]
Ana Maria Mapeli
Doutora em Ciências Agrárias (Fisiologia Vegetal) - UFV - Viçosa - MG Professora - Curso de Ciências Biológicas - UFOB - Barreiras - BA
Endereço: Rua Professor José Seabra de Lemos, 316-Recanto dos Pássaros. CEP: 47808-021, Barreiras-BA
Braz. J. of Develop.,Curitiba, v. 6, n. 10, p.83564-83578, oct. 2020. ISSN 2525-8761 ABSTRACT
Soybean (Glycine max (L) Merril) is one of main responsible for Brazilian economic performance, however, compaction and soil phosphorus deficiency can drastically affect its development and productivity. In view of this our aim of this research was to evaluate root development and productivity of soybean in compacted soil and with different doses of P2O5. The experiment was
done in a randomized block design, in a split plot scheme, with three replicates. We tested four compaction levels (0, 2, 4 and 8 number of tractor strokes) and four doses of P2O5 (0, 100, 250 and
500 kg ha-1). Compaction with 4 and 8 tractor strokes reduced the root distribution in soil depth of 0-0.05m. Increase in doses of phosphorus reduced proportionally to the height of the first pod. Dose of 500 kg ha-1 of P provided increased productivity in treatment with 2 tractor strokes. And doses of 100 and 250 kg ha-1 of P provided increases in productivity of 9.53% and 79.12%, respectively, in soils with 2 of tractor strokes.
Key words: Glycine max, root distribution, soil compaction, soil penetration resistance. RESUMO
A soja (Glycine max (L) Merrill.) é uma das grandes responsáveis pelo desempenho econômico brasileiro, entretanto, a compactação e a deficiência de fósforo no solo podem afetar drasticamente o seu desenvolvimento e a sua produtividade. Diante disto, o objetivo desta pesquisa foi avaliar o desenvolvimento radicular e a produtividade da soja em diferentes níveis de compactação do solo e distintas doses de P2O5. A compactação com 4 and 8 passadas de trator reduziu a distribuição
radicular na profundidade de 0-0,05m do solo. O aumento nas doses de fósforo reduziu, proporcionalmente, a altura de inserção da primeira vagem. A dose de 500 kg ha-1 de P proporcionou
aumento da produtividade no tratamento com 2 passadas de trator. E as doses de 100 e 250 kg ha-1 de P proporcionaram aumento de 9,53% e 9,12% na produtividade, respectivamente, em solos com duas passadas de trator.
Palavras chaves: Glycine max, distribuição radicular, compactação do solo, resistência do solo à penetração.
Braz. J. of Develop.,Curitiba, v. 6, n. 10, p.83564-83578, oct. 2020. ISSN 2525-8761 1 INTRODUCTION
Soybean (Glycine max (L) Merrill.) is an agricultural commodity of great representativeness in brazilian economy. In the 2016/17 harvest Brazil had a production record, reaching 114.07 million tons and productivity of 3,364 kg ha-1, remaining the second largest producer in world, losing only to United States (Conab 2017). Against expressiveness of this culture in national economy, any factor that interferes in production becomes of great importance.
In this context, one of the barriers that can reduce soybean productivity is soil compaction, which is recurrent in crops, since management of this crop is highly mechanized (Flowers and Lal 1998, Silva et al. 2011). In this condition, changes in soil structure are observed, mainly represented by decrease of porosity, availability of water and nutrients and diffusion of gases (Taylor and Brar, 1991), which negatively interferes in plant’s physiology, causing damage to root development.
Another limiting factor of soybean production is phosphorus (P) (Novais and Smyth 1999, Sousa and Lobato 2004), which is one of most important nutrients of biomass productivity in tropical soils (Novais and Smyth, 1999), because it acts in initial formation of reproductive parts and in formation of pods and seeds (Raij 1991). Besides this, in several processes, including cell division, aerial and root system growth, photosynthesis, respiration and formation of compounds, such as phosphate-sugars, respiration intermediates and photosynthesis, as well as phospholipids make up plant membranes, coenzymes, phytic acid and nucleotides, which are used in energy metabolism of plants such as ATP and in DNA and RNA (Taiz and Zieger 2013). It also participates in energy transfer reactions and storage of cells and in synthesis and unfolding of carbohydrates (Guerra et al. 2006).
Both fertilization management and physical soil conditions can influence the amount of P absorbed by plants and, once absorbed in an adequate amount, metabolic processes dependent on this nutrient will normally occur, maximizing development and productive potential of soybean (Valadão et al. 2015).
Despite the diverse information on the effect of soil compaction and phosphorus doses on soybean productivity, there are few reports on influence of these associated factors, a characteristic common in plantations in state of Mato Grosso, which corresponds to one of main production points of this crop.
Thus, our aim was to evaluate root development and productivity of soybean at different levels of soil compaction and different doses of diphosphorus pentoxide (P2O5).
Braz. J. of Develop.,Curitiba, v. 6, n. 10, p.83564-83578, oct. 2020. ISSN 2525-8761 2 MATERIAL AND METHODS
Experiment was carried out at Ressaca Farm, located in southwest region of state of Mato Grosso, in municipality of Cáceres, Brazil. Climate of region, according to the classification of Köppen, is predominantly tropical, with two well-defined periods, which are the rains (November to March), with highest index in months of December and January, and the dry season (April to October). Altitude is 176 m, with annual average rainfall of 1,348 mm, mean annual temperature is 25.2 ° C and mean air relative moisture is 80% (Fietz et al. 2008).
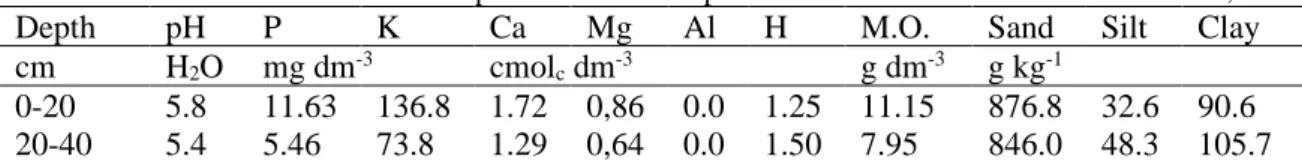
Soil of experiment was characterized as dystrophic Red-Yellow Argisol (Embrapa 2009), with characteristics presented in Table 1.
Table 1. Characteristics of soil of the experiment area at depths of 0-0.2 m and 0.2-0.4 m. Caceres-MT, 2017.
Depth pH P K Ca Mg Al H M.O. Sand Silt Clay
cm H2O mg dm-3 cmolc dm-3 g dm-3 g kg-1
0-20 5.8 11.63 136.8 1.72 0,86 0.0 1.25 11.15 876.8 32.6 90.6
20-40 5.4 5.46 73.8 1.29 0,64 0.0 1.50 7.95 846.0 48.3 105.7
A randomized block design was used, in a split plot scheme, with 3 replications, in a 4x4 factorial. In plots were implanted 4 different levels of compaction, induced by tractor traffic, being 0, 2, 4 and 8 tractor strokes (TS). In subplots were tested 4 doses of P2O5, being 0, 100, 250 and 500
kg ha-1.
Compaction levels were induced shortly after the first rain of October 2016, by traffic superimposed on previous one, each area of each parcel was trafficked with an equal number of times. Agricultural tractor MF 292 (105 cv) was used, with diagonal tire wheels, 1.7 m rear gauge and 5.0 Mg total mass with inflation pressure of 100 kPa on front tires and 117 kPa in rear.
Compaction level determination on soil penetration resistance (SPR) of each plot, was made after sowing (October 28th, 2016) and on day of harvest (March 7th, 2017), by means of an impact penetrometer, as recommended by Asae (1978). Obtained data were transformed to kgf cm-2 by means of equation SPR = 5,6 + 6,89 N (Stolf et al. 1991), and multiplied by constant 0.0980665, to transform units in MPa. Soil samples were collected to determine gravimetric moisture content and chemical analysis routine, according to Claessen (1997).
For fertilization of P2O5 was used as source NPK fertilizer with formulation 00-21-00,
applied in planting groove, 14 days after sowing.
Soybean cultivar used was Brasmax Desafio RR-8473RSF, which shows indeterminate growth and a relative maturation group of 7.4. Sowing was mechanized, done in opposite direction of traffic of tractor, to ensure plant reached compacted area. Line spacing used was 0.5 m, with 14
Braz. J. of Develop.,Curitiba, v. 6, n. 10, p.83564-83578, oct. 2020. ISSN 2525-8761
seeds per linear meter. Sowing was carried out on cultural remains of Urochloa brizantha, and the field used in experiment was managed under crop and livestock integration system, where a cattle farming was practiced only in year 2015, soybean cultivation; in 2016 returned with pasture and, in 2017, had soybean planting again.
For evaluation of root system, 10 plants of useful area of each subplot in R6 stage were analyzed by trench method. A trench was opened in interlude, where vertical wall was 0.05 m distant from the plant, exposing roots by washing with water. Subsequently, a 0.4 x 0.5 m frame divided into 0.05 x 0.05 m squares was placed in trench to estimate root concentration in soil layers of 0-0.05; 0.05-0.10; 0.10-0.15; 0.15-0.20 and 0.20-0.30 m.
For productivity and production components, 10 plants were used per subplots in R9 stage. It was evaluated height of first pod, number of pods per plant, number of grains per pod, mass of 1000 grains, number of grains per plant and productivity (kg ha-1).
Mass of 1000 grains was performed by weighing eight replicates of 100 seeds per treatment (Brazil 2009). For number of grains per plant, number of pods per plant was multiplied by number of grains per pod. For productivity estimation was considered a population density of 12.5 plants per linear meter and grain moisture was corrected to 14%.
The variables were submitted to Analysis of Variance and, when significant, regression analysis was performed. Means of SPR variable and root distribution were compared by Tukey test, at 5% probability.
3 RESULTS AND DISCUSSION
After data analyzing, it was found proportionality between number of TS and SPR in depth up to 0.16 m, with increases of 132, 55 and 55%, respectively, comparing 0 and 8 TS in 0.04-0.08; 0.08-0.12 and 0.12-0.16m depth. From this, there was no difference in compaction levels (Table 2). Treatment with 8 TS promoted highest SPR in soil surface layer (0.00-0.10 m), and other treatments provided an increase in subsurface density (Table 2).
Braz. J. of Develop.,Curitiba, v. 6, n. 10, p.83564-83578, oct. 2020. ISSN 2525-8761
Table 2. Soil penetration resistance (MPa) at different soil depths, due to the number of tractor strokes (TS) evaluated during soybean cultivation. Caceres-MT, 2017.
TS Depth (m) 0-0.04 0.04-0.08 0.08-0.12 0.12-0.16 0.16-0.20 0.20-0.24 0.24-028 0.28-0.32 0 0.55 a 0.90 b 1.59 b 1.59 b 1.59 a 1.59 a 2.20 a 2.20 a 2 0.87 a 2.09 a 2.09 ab 2.09 ab 2.09 a 2.25 a 2.25 a 2.30 a 4 0.55 a 2.18 a 2.18 ab 2.18 ab 2.18 a 2.64 a 2.87 a 2.75 a 8 0.55 a 2.47 a 2.47 a 2.47 a 2.53 a 2.63 a 2.40 a 2.40 a CV(%) 51.14 23.39 17.84 17.84 28.13 21.50 13.97 12.63 TS Depths (m) 0.32-0.36 0.36-0.40 0.40-0.44 0.44-0.48 0.48-0.52 0.52-0.56 0.56-0.60 0 2.15 a 2.15 a 1.92 a 1.92 a 1.75 a 1.75 a 1.75 a 2 1.89 a 1.89 a 1.78 a 1.78 a 1.78 a 1.80 a 1.80 a 4 2.45 a 2.24 a 2.25 a 2.25 a 1.89 a 1.87 a 1.87 a 8 2.30 a 1.98 a 1.98 a 1.98 a 1.99 a 1.99 a 1.99 a CV(%) 21.21 21.96 22.04 22.04 15.13 15.24 15.24
Means followed by the same letter in the column do not differ statistically from each other by Tukey test at 5% probability level.
These data are in concordance with Freddi et al. (2007), Bergamin et al. (2010), Valicheski et al. (2012) and Valadão et al. (2015), who mentioned that more intense machines and implements traffic causes more compactness in superficial layers of soil, and there may also be some physical changes in subsurface at depths of up to 20 cm, by a smaller number of tractor strokes.
Moisture soil influenced the soil penetration resistance evaluated at beginning of experiment and at time of soybean harvest, as showed in (Figure 1). SPR in soil at beginning of experiment, with moisture of 4.87%, and at the time of harvest Ug 10.38%, differed in all depths. In soil with low moisture the SPR reached more than 12 MPa, while in soil with Ug of 10.38% the maximum value of SPR founded was 2.20 MPa.
Braz. J. of Develop.,Curitiba, v. 6, n. 10, p.83564-83578, oct. 2020. ISSN 2525-8761
Figure 1. Soil resistance curves at penetration under wet soil conditions at 0 tractor pass and dry soil before experiment implantation. Cáceres-MT, 2017.
This fact was explained by Cunha et al. (2002), considering that in soil with low moisture, the cohesion and adhesion forces between solid particles are more expressive, resulting in greater soil resistance to penetration.
Mandarino et al. (2017) showed that differences in SPR vary greatly as a result of moisture variation, there may be losses in agricultural crops in regions with a well-defined rainfall cycle, and depending on crop and soil management, to high natural cohesion of its particles, resulting in high SPR values that influence development and distribution of roots. It is evident the requirement for practices managements that minimize the increase of soil penetration resistance, due to sudden variation between wet and dry soil in relation to this compaction parameter.
Regarding distribution of soybean root system, it was found that the P2O5 doses tested did
not have a significant effect, with significance at only 4 and 8 TS at depth 0-0.05m (Table 3). This results are related to the values of SPR (Table 2) found in this research, since treatments with the highest intensity traffic showed higher SPR in the soil surface layer.
Table 3. Root distribution (m) at different depths of the soil, due to the number of tractor strokes (TS) evaluated during soybean cultivation. Cáceres-MT, 2017.
TS Soil depth (m) 0-0.05 0.05-0.10 0.10-0.15 0.15-0.20 0.20-0.30 0 0.169 a 0.206 a 0.144 a 0.028 a 0.012 a 2 0.166 a 0.206 a 0.147 a 0.069 a 0.022 a 4 0.106 b 0.172 a 0.162 a 0.069 a 0.037 a 8 0.119 ab 0.191 a 0.150 a 0.069 a 0.035 a
Averages followed by the same letter in column do not differ statistically from each other by the Tukey test at the 5% probability level.
Braz. J. of Develop.,Curitiba, v. 6, n. 10, p.83564-83578, oct. 2020. ISSN 2525-8761
Treatments 4 and 8 TS had a reduction of 37.28 and 29.59%, respectively, in root distribution at depth up to 0.05 m of soil, compared to the treatment with 0 TS. This reduction is due to the increase in soil density, which causes changes in balance between macro and micropores and in total porosity, influencing the space destined to root growth and ground exploration area by roots (Beamler and Centurion 2004; Bergamin et al. 2010 ). The mechanical impedance decreases root elongation rate due to reduction of meristematic cell division, making the roots less pointed and, consequently, causing a larger diameter of these roots in detriment of length (Torres and Saraiva 1999). In addition, it can alter air present in soil, compromising oxygenation and, consequently, aerobic respiration (Taiz and Zeiger 2013). In this condition, plants probably performed anaerobic respiration, which produces less energy, and reduces root growth, since this process has a high energy demand.
Valadão et al. (2015), in a typical Dystrophic Red-Yellow Latosol, also found reduction of 23% of soybean root area in the 0.00-0.05 m layer in soils with 8 tractor strokes (Ds=1.30 kg dm-3 and SPR of 0.80 MPa) when compared to the soil with no tractor pass (Ds=1.09 kg dm-3 and SPR =
0.35 MPa), and found no roots from 0.15 m depth.
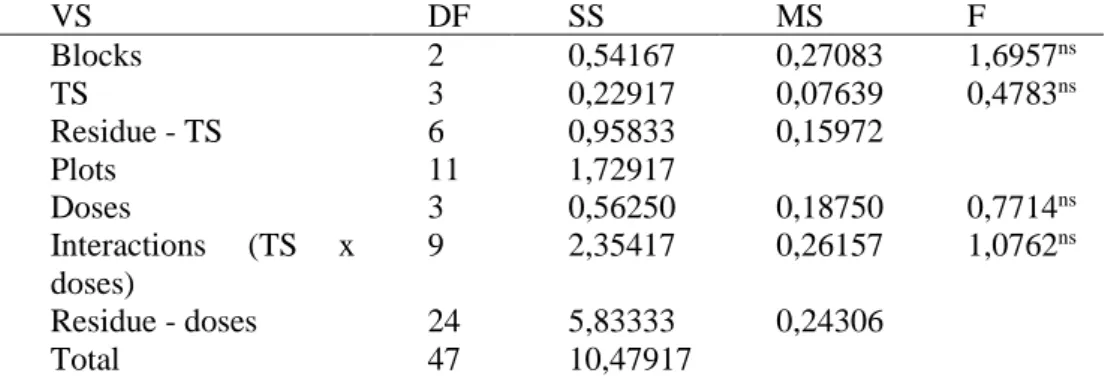
In relation to the number of grains per pod and mass of 1000 grains, it was observed that these were not influenced by the tractor strokes and the doses of P2O5, which may be a genetic
expressibility of this soybean cultivar (Table 4 and 5).
Table 4. Analysis of variance for the number of grains per pod as a function of the number of tractor strokes (TS) and doses of P2O5 (kg ha-1) applied to soybean cultivation. Cáceres-MT, 2017.
VS DF SS MS F Blocks 2 0,54167 0,27083 1,6957ns TS 3 0,22917 0,07639 0,4783ns Residue - TS 6 0,95833 0,15972 Plots 11 1,72917 Doses 3 0,56250 0,18750 0,7714ns Interactions (TS x doses) 9 2,35417 0,26157 1,0762ns Residue - doses 24 5,83333 0,24306 Total 47 10,47917
VS: variation source; DF: degrees of freedom; SS: sum of squares; MS: mean square; F: F test statistic; TS: number of tractor strokes (TS); ns: not significant (p >=0.05).
Braz. J. of Develop.,Curitiba, v. 6, n. 10, p.83564-83578, oct. 2020. ISSN 2525-8761
Table 5. Analysis of variance for mass of 1000 grains the number of grains of soybean as a function of the number of tractor strokes (TS) and doses of P2O5 (kg ha-1) applied to soybean cultivation. Cáceres-MT, 2017.
VS DF SS MS F Blocks 2 1836,91321 918,45661 0,5845ns TS 3 6964,78822 2331,59607 1,4839ns Residue - TS 6 9427,52687 1571,25448 Plots 11 18259,22830 Doses 3 271,66029 920,55343 0,8501ns Interactions (TS x doses) 9 18595,83667 2066,20407 1,9081ns Residue - doses 24 25988,00485 1082,83354 Total 47 65604,73010
VS: variation source; DF: degrees of freedom; SS: sum of squares; MS: mean square; F: F test statistic; TS: number of tractor strokes (TS); ns: not significant (p >=0.05).
Tractor strokes did not affect the insertion height of the first pod, however, fertilization doses with P2O5 provided formation of lower pods (Figure 2). Doses of 100, 250 and 500 kg ha-1 of P2O5
reduced the height of the pod by 10.92%, 27.30% and 54.6% respectively, compared to the treatment with 0 kg ha-1 of P2O5.
Figure 2. Insertion height of the first pod (cm) as a function of phosphorus doses (kg ha-1) applied to soybean cultivation. Cáceres-MT, 2017.
Higher doses of P2O5 provided a higher productive area of the crop, since, according to
Shigihara and Hamawaki (2005), formation of first soybean pod must be 10-15 cm from the soil, and lower values may cause higher losses during harvesting, and higher values despite maximizing harvesting, decrease plant area production, resulting in lower productivity.
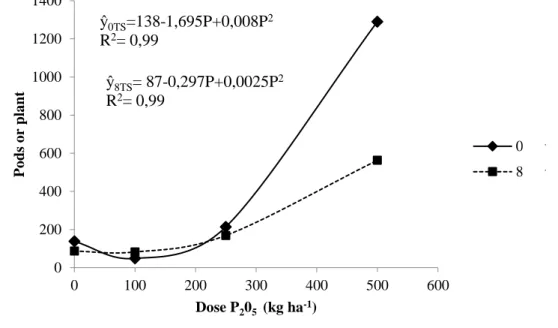
Considering number of pods per plant, it was observed that doses of P and treatments with 0 and 8 TS had a significant influence (Figure 3). Higher doses of P provided greater pod production,
0 2 4 6 8 10 12 14 0 100 200 300 400 500 600 Ins er tio n heig ht o f the first po d ( cm ) Doses P2O5 (Kg ha-1) ŷ= 11,721-0,0128P R2= 0,63
Braz. J. of Develop.,Curitiba, v. 6, n. 10, p.83564-83578, oct. 2020. ISSN 2525-8761
both in treatment without tractor strokes and in treatment with maximum number of tractor strokes. Although TS had higher pod productivity, phosphate fertilization was efficient in 8 TS treatments.
Figure 3. Number of pods per plant as a function of the number of tractor strokes (TS) and doses of P2O5 (kg ha-1) applied to soybean cultivation. Cáceres-MT, 2017.
Higher pods production with increasing doses of P in 0 TS may be related to SPR values (Figure 1) and to root distribution in soil surface layer (Table 3), because lower SPR found in the treatment with 0 TS, may have benefited the highest root densities in 0-0.10 m depth, favoring a larger area of soil exploration and, consequently, a higher absorption of P2O5. In treatment of 8 TS,
the increase in soil density may have favored diffusion of the P to the root system, through the concentration of this element near the roots, since the factors considered in its estimation are the radicular area, distance from the element to absorption unit and the element concentration gradient (Malavolta 2006).
These results agree with those found for height of insertion of the first pod (Figure 2), and higher doses resulted in formation of lower pods, resulting in a higher number of pods per plant, maximizing productive area of plant.
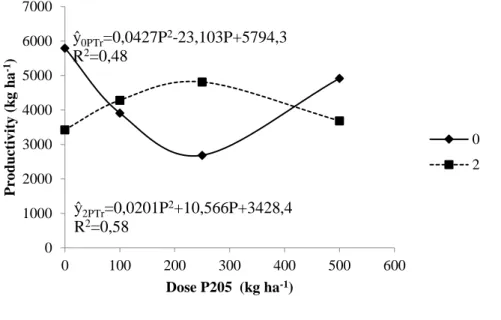
Soybean productivity also showed interaction for the 0 and 2 TS and the P2O5 doses (Figure
4). Only dose of 500 kg ha-1 of P provided an increase in productivity of 16.01% in soil without tractor strokes. Maximum productivity (4,813.65 kg ha-1) was reached in soil with the minimum number of passes established (2 TS), with a dose of 250 kg ha-1 of P, being that from this point there was a reduction of productivity. Dose of 500 kg ha-1 of P there was a reduction of 23.42% in productivity. 0 200 400 600 800 1000 1200 1400 0 100 200 300 400 500 600 P o ds o r pla nt Dose P205 (kg ha-1) 0PTr 8PTr ŷ0TS=138-1,695P+0,008P2 R2= 0,99 ŷ8TS= 87-0,297P+0,0025P2 R2= 0,99
Braz. J. of Develop.,Curitiba, v. 6, n. 10, p.83564-83578, oct. 2020. ISSN 2525-8761
Figure 4. Productivity (kg ha-1) as a function of the number of tractor strokes (TS) and doses of P
2O5 (kg ha-1) applied to the cultivation of soybeans. Cáceres-MT, 2017.
At 0 dose of P combined with 2 TS there was a 40.83% reduction in productivity in relation to 2 TS treatment. Rosolem et al. (1994) also found reduction of soybean productivity in compacted soils, reporting a reduction of more than 50% in soybean productivity in soils with SPR higher than 0.69 MPa. In this study the values of SPR were superior to that quoted by the author in all evaluated depths.
At doses of 100 and 250 kg ha-1 of P2O5 there was an increase of 9.53% and 79.12%,
respectively, between treatments 0 and 2 TS. These results demonstrate the importance of phosphate fertilization to soybean productivity in compacted areas, considering that SPR values (Table 2) are higher than those reported by Rosolem et al. (1994) as restricting soybean productivity, and yet there was an increase in productivity.
As reported by Malavolta (2006), the P uptake was also affected by soil compaction, since the main means of absorption is by diffusion, and since root growth and the soil area to be roots are reduced, diffusion of P can also be affected, since it is directly related to the root area, distance of element to unit of absorption and gradient of concentration of element.
4 CONCLUSIONS
Root development of soybean in topsoil is affected by more intense traffic of the tractor (4 and 8 strokes).
Doses of 100 and 250 kg ha-1 of P2O5 provide increased productivity in soils with 2 tractor
strokes. 0 1000 2000 3000 4000 5000 6000 7000 0 100 200 300 400 500 600 P ro du ct iv it y ( k g ha -1) Dose P205 (kg ha-1) 0 PTr 2 PTr ŷ0PTr=0,0427P2-23,103P+5794,3 R2=0,48 ŷ2PTr=0,0201P2+10,566P+3428,4 R2=0,58
Braz. J. of Develop.,Curitiba, v. 6, n. 10, p.83564-83578, oct. 2020. ISSN 2525-8761 REFERENCES
ASAE - American Society of Agricultural Engineers. Soil Cone Penetrometer. IN: ASAE. Agricultural Engineers Yearbook of Standards. p.368-369, 1978 (ASAE R313.1).
BERGAMIN, A. C.; VITORINO, A. C. T.; FRANCHINI, J. C.; SOUZA, C. M. A.; SOUZA, F. R. Compactação em um Latossolo Vermelho distroférrico e suas relações com o crescimento radicular do milho. R Bras Ci Solo, v. 34, p. 681-91, 2010.
BEUTLER, A. N.; CENTURION, J. F. Compactação do solo no desenvolvimento radicular e na produtividade de soja. Pesq Agropec Bras, v.39, n.6, p.581-8, 2004.
BRASIL. Regras para análise de sementes. 1 ed., Brasília, DF: Ministério da Agricultura, Pecuária e Abastecimento, 2009. 398p.
CLAESSEN, M. E. C. (Org.). Manual de métodos de análise de solo. 2 ed. rev. atual. Rio de Janeiro, RJ: EMBRAPA-CNPS, 1997. 212 p. (EMBRAPA-CNPS. Documentos, 1).
CONAB - Companhia Nacional de Abastecimento. Acompanhamento da safra brasileira de grãos: v. 4-safra 2017/18. Primeiro levantamento, Brasília, p. 1-118, out., 2017.
CUNHA, J. P. A. R.; VIEIRA, L. B.; MAGALHÃES, A. C. Resistência mecânica do solo à penetração sob diferentes densidades e teores de água. Eng na Agric, v.10, n. 1-4, p.1-7, 2002. EMBRAPA - EMPRESA BRASILEIRA DE PESQUISA AGROPECUÁRIA. Sistema brasileiro de classificação de solos. 1. ed. Brasília: EMBRAPA, 2009. 412 p.
FIETZ, C. R.; COMUNELLO, E. ; CREMON, C.; DALLACORT, R. Estimativa da Precipitação Provável para o Estado de Mato Grosso. 1. ed. Dourados: EMBRAPA, 2008. 239 p.
FLOWERS, M. D.; LAL, R. Axle load and tillage effects on soil physical properties and soybean grain yield on a molic ochraqualf in northwest Ohio. Soil Tillage Res, v. 48, p.21-35, 1998.
FREDDI, O. S.; CENTURION, J. F.; BEUTLER, N. A.; ARATANI, R. G.; LEONEL, C. L. Compactação do solo no crescimento radicular e produtividade da cultura do milho. R Bras Ci Solo, v. 31, n. 04, p. 627-636, 2007.
GUERRA, C. A.; MARCHETTI, M. E.; ROBAINA, A. D.; SOUZA, C. F.; GONÇALVES, M. C.; NOVELINO, J. O. Qualidade fisiológica de sementes de soja em função da adubação com fósforo, molibdênio e cobalto. Acta Sci Agron, v.28, p.91-97, 2006.
MALAVOLTA, E. Manual de nutrição mineral de plantas. São Paulo: Agronômica Ceres, 2006. 638p.
MANDARINO, A. P.; CREMON, C.; MAPELI, N. C.; SILVA, G. F.; SILVA, A. N.; OLIVEIRA, M. dos R.; CARDOSO, W. P. S.; FREITAS, S. E. Resistência do solo à penetração do milho sobre efeito de soluções homeopáticas em terras altas do Pantanal. Global Science and Technology, v.10, n.01, p.60 – 68, 2017.
Braz. J. of Develop.,Curitiba, v. 6, n. 10, p.83564-83578, oct. 2020. ISSN 2525-8761
NOVAIS, F. R.; SMYTH, T. J. Fósforo em solo e planta em condições tropicais. Viçosa: UFV, 1999. 399p.
RAIJ, B. V. Fertilidade do solo e adubação. Piracicaba: Ceres: Potafos, 1991. 343p.
REICHERT, J. M.; SUZUKI, L. E. A. S.; REINERT, D. J. Compactação do solo em sistemas agropecuários e florestais: Identificação, efeitos, limites críticos e mitigação. In: CERETTA, C. A.; SILVA, L. S.; REICHERT, J. M., eds. Tópicos Ciência do Solo. Viçosa, MG, Sociedade Brasileira de Ciência do Solo, 2007. v. 5, p.49-134.
ROSOLEM, C. A.; ALMEIDA, A. C. S.; SACRAMENTO, L. V. S. Sistema radicular e nutrição da soja em função da compactação do solo. Bragantia, v. 53, n. 02, p. 259-266, 1994.
SHIGIHARA, D; HAMAWAKI, O. T. Seleção de genótipos para Juvenilidade em progênies de soja (Glycine max (L.) Merrill). Biosci J, p. 01-26, 2005.
SILVA, F. de A. S. e.; AZEVEDO, C. A. V. de. The Assistat Software Version 7.7 and its use in the analysis of experimental data. Afr J Agric Res, v.11, n.39, p.3733-3740, 2016.
SILVA, A. R.; DIAS JUNIOR, M. S.; LEITE, F. P. Avaliação da intensidade de tráfego e carga de um forwarder sobre a compactação de um Latossolo Vermelho-Amarelo. Rev Árvore, v. 35, n. 3, p.547-554, 2011.
SOUSA, D. M. G.; LOBATO, E. Cerrado: correção e adubação. 2º ed. Brasília, DF: Embrapa Informação tecnológica, p.147-167, 2004.
STOLF, R. Teoria e teste experimental de fórmulas de transformação dos dados de penetrômetro de impactoem resistência do solo. R Bras Ci Solo, v. 15, p. 229-235, 1991.
STONE, L. F.; GUIMARÃES, C. M.; MOREIRA, J. A. A. Compactação do solo na cultura do feijoeiro – 1: efeitos nas propriedades físicohídricas do solo. Rev Bras Eng Agríc Ambient, v. 6, p. 207-212, 2002.
TAIZ, L.; ZEIGER, E. Fisiologia vegetal. Editora: Artmed, 2013. 954 p.
TAVARES FILHO, J.; BARBOSA, G. M. C.; GUIMARÃES, M. F.; FONSECA, I. C. B. Resistência do solo a penetração e desenvolvimento do sistema radicular do milho (Zea mays) sob diferentes sistemas de manejo em um Latossolo Roxo. R Bras Ci Solo, v. 25, p. 725-730, 2001. TAYLOR, H. M.; BRAR, G. S. Effect of soil compaction on root development. Soil Tillage Res, v. 19, p. 111-119, 1991.
TORRES, E.; SARAIVA, O. F. Camadas de impedimento do solo em sistemas agrícolas com soja. Londrina: Empresa Brasileira de Pesquisa Agropecuária; 1999. (Circular técnica, 23).
VALADÃO, F. C. A., WEBER, O. L. S., VALADÃO JÚNIOR, D. D., SCAPINELLI, A., DEINA, F. R.; BIANCHINI, A. Adubação fosfatada e compactação do solo: sistema radicular da soja e do milho e atributos físicos do solo. R Bras Ci Solo, v. 39, n. 04, p. 243-255, 2015.
Braz. J. of Develop.,Curitiba, v. 6, n. 10, p.83564-83578, oct. 2020. ISSN 2525-8761
VALICHESKI, R. R.; GROSSKLAUS, F.; STURNER, S. L. K.; TRAMONTIN, A. L.; BAADE, E. S. A. Desenvolvimento de plantas de cobertura e produtividade da soja conforme atributos físicos em solo compactado. Rev Bras Eng Agríc Ambient, v.16, n. 09, p. 969-p77, 2012.