219
A
VALIA
ÇÃ
O EM BIBLIO
TECAS UNIVERSIT
ÁRIAS
1 Assembleia Legislativa do Estado de Santa Catarina, Palácio Barriga Verde. R. Doutor Jorge Luz Fontes, 310, Centro, 88020-900, Florianópolis, SC, Brasil.
Correspondência para/Correspondence to: C.P.C. PEREIRA. E-mail: <carlapcpereira@gmail.com>.
2 Universidade Federal de Santa Catarina, Departamento de Engenharia e Gestão do Conhecimento. Florianópolis, SC, Brasil. Received on July 1, 2016, final version resubmitted on October 18, 2017 and approved on October 23, 2017.
Como citar este artigo/How to cite this article
Pereira, C. P. C.; Varvakis, G. Evaluation and decision making in university library from performance indicators. Transinformação, v. 30, n. 2, p. 219-235, 2018. http://dx.doi.org/10.1590/2318-08892018000200007
ORIGINAL
ORIGINAL
Evaluation and decision making in a university
library from performance indicators
Avaliação e tomada de decisão em biblioteca universitária
a partir de indicadores de desempenho
Carla Purcina de Campos PEREIRA1 0000-0003-3743-0357
Gregorio VARVAKIS2 0000-0003-2576-4835
Abstract
The purpose of using performance indicators in Brazilian university libraries is to provide information for decision making and to promote quality in the educational system. We analyzed the performance indicators used in 95 university libraries. Among them, the relevance of the indicators and their use in the decision-making process was assessed. The performance evaluation models were the performance indicators for the evaluation of university libraries based on “International Organization for Standardization 11.620/2008 Information and documentation – Library performance indicators”. It was evidenced that indicators are relevant for decision making. However, there is a discrepancy between their use and relevance. The set of indicators applied to university libraries is usually the same as those proposed by the Ministry of Education. An adequate management of the performance indicators and the application in the decision-making process promote the quality of the offered products and, therefore, the quality of the education of the higher education institutions.
Keywords: Decision making. Performance indicators. Quality control. University libraries.
Resumo
A finalidade de utilizar indicadores de desempenho nas bibliotecas universitárias brasileiras é prover informações para a tomada de decisão e promover qualidade no sistema educacional. Analisaram-se os indicadores de desempenho utilizados em 95 bibliotecas universitárias, aferindo-se a relevância dos indicadores e seu uso no processo de tomada de decisão. Caracterizaram-se modelos de avaliação de desempenho e analisaram-se os indicadores de desempenho para avaliação de bibliotecas universitárias com base na norma ISO 11.620/2008 Information and documentation – Library performance indicators. Evidenciou-se que, embora os indicadores possuam relevância para a tomada de decisão, há discrepância entre a relevância e o uso. O conjunto de indicadores aplicados às bibliotecas universitárias abrange em geral os mesmos impetrados pela avaliação do Ministério da Educação. Uma adequada gestão dos indicadores de desempenho e sua aplicação no processo decisório promovem a qualidade dos produtos oferecidos e, por conseguinte, a qualidade da educação nas instituições de ensino superior.
C.P
.C. PEREIRA & G.
VAR
VAKIS
220
Introduction
The quality of the university library may be defined by the capacity of the management or management team to meet the expectations and needs of its clients, since the search for excellence in the management of information units, particularly Higher Education Institutions (HEI), involves understanding, organizing and managing the dense volume of information produced by the academy.
Effective managers make decisions based on reliable and accurate information, derived from the analysis of performance evaluation data. However, despite the development and accuracy of information and communication technologies, according to McGee and Prusak (1994, p.xvi), “The fundamental problem remains the same: ‘to define the right information in a timely manner and in the right place’ ”.
In this research, the performance indicators used in university libraries and their use in the decision-making process are analyzed in order to present the performance evaluation as a tool to improve the quality of university libraries regarding the performance of the team to provide the correct information, timely, and in the right place.
The evaluation of university libraries is a necessary element for the accreditation and renewal of the accreditation of universities, as well as for the recognition and renewal of the recognition of undergraduate programs. These regulation and control evaluations are part of the Sistema Nacional de Avaliação da Educação Superior (SINAES, National System for Evaluating Higher Education), in which the university library is evaluated as per its Infrastructure, although the evaluation indicators essentially refer to the composition and characteristics of the collection.
It is understood that valuation implies judgments about the value and merit of the evaluated object, with a view to guiding decisions and recommending improvement actions. For SINAES (Brasil, 2013), evaluation should be a collectively constructed process of voluntary adherence, with the purpose of systematizing information for political, pedagogical and administrative decision-making, in order to raise the educational capacity and improve the quality of institutions of the country.
Evaluation of a university library
Performance evaluation in university libraries is relevant in that it “[…] gathers the data needed to determine which of several alternative strategies seem to be most likely to achieve a desired outcome” or in the fact that “[…] assessment is made not as an exercise but to gather useful data for problem-solving or decision-making activities” (Lancaster, 2004, p.1).
The purpose of the evaluation is to gather data. The data is structured into indicators, which may be expressed numerically, symbolically or semantically, with the intention of characterizing: activities, objects, people or events, quantitatively or qualitatively, and as indicated by Lancaster (2004), for the purpose of assessing the value of such activities to contribute to the decision-making process.
The intense development of technologies and demand for information imply new challenges for library administrators, requiring them to be more skilled. They need to have a proactive stance, understand the importance of establishing goals and actions so it may be clear where one wants to get to and how to get there. Therefore, it is imperative for the librarian to have a solid theoretical-practical foundation on management, more precisely on evaluation systems.
221
A
VALIA
ÇÃ
O EM BIBLIO
TECAS UNIVERSIT
ÁRIAS
Harrington and Harrington (1997) emphasize that one cannot make the planning or decisions without at least knowing the actual situation of the institution. To achieve this:
As medições são essenciais. Se você não pode medir algo, não será capaz de controlá-lo. Se não puder controlá-lo, não poderá gerenciá-lo. Se não puder gerenciá-lo, não poderá melhorá-lo. Sem melhorias, todo resultado será uma surpresa. As medições são o ponto de partida para as melhorias, porque lhe possibilitam entender onde você se encontra e fixa metas que o ajudem a chegar onde desejar (Harrington; Harrington, 1997, p.429).
Research carried out on performance indicators emphasizes the measurement of target activities of the university library. Consequently, the evaluation of the support activities of the institution is in the background, causing gaps in the way of managing the university library. This process of emphasis occurs because of the valuation through institutions that oversee the target activities, those that directly affect the perception of higher education.
University library
The “Lei de Diretrizes e Bases da Educação Nacional” (LDB, Law on the Guidelines and Bases of National Education), nº 9.394, dated December 20, 1996, regulates national education and aims at improving the quality of teaching, as well as providing opportunities for the development of university libraries, since these were included in the indicators in the evaluation of educational institutions in the country.
The evaluation of Brazilian universities and undergraduate programs is currently being carried out through the Sistema Nacional de Avaliação da Educação Superior, which was instituted by Law nº 10.861, of April 14, 2004, and has the objective of promoting the quality of education, the orientation of the expansion of its offer, the permanent increase in its institutional effectiveness, its academic and social effectiveness and, in particular, the deepening of social commitments and responsibilities.
The objectives and activities of the university library are established in accordance with the university’s objectives. Tarapanoff (1981) points out that the university library in formulating its objectives must fit the functions performed by the maintaining institution, propose products and services based on teaching, research and extension of the university, structure the activities from the university structure, maintain keep integrated into the university policy, whenever necessary, to evaluate the objectives and update them, and to maintain cooperation with other institutions.
Evaluation process in a university library
The evaluation process in university libraries is divided into three phases that involve planning, research, and change (Almeida, 2005).
The planning phase includes the perception of the need for evaluation, the formation of the evaluation committee, and the preparation of the evaluation. The research phase is the application of the evaluation and the analysis of the data. And, finally, the phase of change that involves decision-making and communication to the team, funders, and clients.
The planning phase consists of the “need assessment” stage, that may be perceived by the institution itself. In this case, by the library, the coordination which the library is linked to, or by an institutional requirement, and also by the requirement of the auditing entities.
C.P
.C. PEREIRA & G.
VAR
VAKIS
222
The formation stage of the evaluation committee is intended to attribute to a team, formed by people directly interested in the performance of the library, the mission of developing and applying evaluation in the library. Such committee should comprise the library manager or his/her representative, the person in charge of the Human Resources department, and the main persons responsible for the library departments that have a significant impact on the image of the library. It is also at this stage that means must be established for the communication to occur among members, and the importance of the employees in the process and results of the organization must be emphasized.
The elaboration of the evaluation involves describing how the evaluation process will take place in the university library, collecting and ordering the relevant information for the evaluation so it may be possible to establish indicators, whose characteristics of relevance, gradation of intensity, univocity, standardization and traceability (Trzesniak, 1998) must be respected. It is based on these characteristics that the evaluation will have a valid character for the decision making and acceptance of the maintaining institution. According to ISO nº 11620 (International Organization for Standardization, 2008), an indicator should have the following characteristics:
– Information Content: serve as a tool to identify successes, problems, and failures in library performance; provide information for decision making.
– Reliability: producing the same results when used repeatedly in the same circumstances.
– Validity: be valid, that is, it must measure what it is intended to measure. – Relevance: be appropriate to the purpose for which it was established.
– Practical: be practical, use the data available in the library, spending a minimum of time and qualification of staff, operational cost, and time users.
– Comparability: allowing comparison between similar libraries, that is, having the same level of quality or the same level of efficiency.
The next phase of the evaluation process consists of two stages: the application of the evaluation, and the analysis of the data.
The application of the evaluation is characterized by the use of the indicators in the units checked, detailed in the elaboration of the evaluation stage. In this research the following categories are used as measured units: administration; academic context; training, technical processing and development of collections; and user services.
The data analysis stage is composed of the weighting of the collected data, which will be treated quali-quantitatively, in order to satisfy the goals described in the evaluation planning phase.
The last phase of the evaluation process is the change. It involves decision making and is carried out from the results of the data analysis obtained through the performance indicators applied to university libraries.
As it was observed in the bibliographic review, the decision making begins with the identification of the needs identified by the results of the application of the indicators, so that possible improvement actions are developed. In this case, in the analyzed categories: administration, academic context, training, technical processing and development of collections, and user services.
Finally, it is necessary to communicate to the team, funders and clients the results obtained and the decisions taken, as well as the solutions of any problems detected through the application of the evaluation, in order to guarantee the full functioning of the university library.
Models of evaluation systems
223
A
VALIA
ÇÃ
O EM BIBLIO
TECAS UNIVERSIT
ÁRIAS
provide quality education, as demonstrated by Alonso Arévalo, Echeverría Cubillas and Martín Cerro (1999, p.1):
“Dentro de La Universidad, La Biblioteca constituye un servicio clave de apoyo a las dos funciones que constituyen la razón de ser de la institución universitaria: La investigación o creación de conocimiento y la enseñanza o comunicación de dicho conocimiento”.
The same authors also claim that the most prestigious universities in the world in terms of teaching and research are those with the best libraries. Equally, in order to be a recognized and prestigious organization, the Higher Education Institutions must be clear about its goal and therefore the assessment to see whether the goal is being achieved and how it is being achieved.
Among the bibliographical survey was realized that the use of indicators to evaluate university libraries is undoubtedly important and necessary for the development of the organization. For Stubbs (2004, p.151), the use of performance indicators in libraries is important because:
Una biblioteca tiene variadas razones para medir su desempeño; por razones políticas, incluyendo compromisos vinculados con las políticas nacionales de información de un país, responsabilidad ante quienes apoyan política y financieramente el funcionamiento desarrollo de la biblioteca, para mostrar los resultados de los logros y mejoras obtenidas a los usuarios y a la comunidad en general, como ayuda en la toma de decisiones y como herramienta de gestión.
There is a wide denomination in the literature for evaluating the performance of university libraries. However, in a more careful analysis, it is perceived that its constitution is related to the development of the theoretical thought of the administration, which in a certain moment sought to identify, consider and evaluate the environment in which decision-making should take place.
In this research, the term “performance indicator” will be used as: Expression (which may be numeric, symbolic or verbal) used to characterize activities (events, objects, persons) both in quantitative and qualitative terms in order to assess the value of the activities characterized, and the associated method (International Organization for Standardization, 2008).
According to the International Organization for Standardization nº 11620 (2008), the purpose of using performance indicators is self-diagnosis, with the intent of encouraging meaningful and useful comparisons in different libraries. However, comparisons should be made considering the characteristics of each library.
For the International Organization for Standardization nº 11620 (2008), the performance indicators have two main objectives: (a) to facilitate control in the management process; and (b) to serve as a basis for reference and for dialogues between library staff, funding bodies, and the user community.
Performance indicators are intended to serve a large number of proposals related to the measurement of library resources, processes, products and performance and are an important tool in the evaluation process, providing relevant information for decision making (Stubbs, 2004).
For Alonso Arévalo, Echeverría Cubillas and Martín Cerro (1999), the key to success in using performance indicators for the evaluation of university libraries is to have a clear plan of how the evaluation will proceed; maintain communication among key stakeholders, predict problems and resolve them, make decisions with cohesive data, monitor the progress of the evaluation, and justify resource allocation. Likewise, the purpose of the assessment will be clear when there is an understanding that performance indicators may enable the monitoring and progress of the university library.
The construction of indicators should be carried out based on a research that enables a guarantee of success. Therefore, “if the indicators are not well constructed, many bad decisions may be made” (Trzesniak, 1998, p.164).
C.P
.C. PEREIRA & G.
VAR
VAKIS
224
The text by Trzesniak (1998) is also worth mentioning because it presents the care that must be taken in the proposal of indicators and some care at the moment in which the existing models are being analyzed, in order to verify whether they are really applicable to such organization.
Decision making
The decision making or decision-making process begins with the identification of needs, which occurs through the analysis of a problem, and thus possible solutions are developed. These solutions may be measured through information systems that enable communication, and the integration of data and information to the decision makers.
According to Choo (1998) and Guimarães and Evora (2004), the formal decision making is composed of methodologies that specify the roles, methods, and norms that establish values that influence how the organization faces choice and uncertainty. The combination of culture, communication, and consensus improves the efficiency and effectiveness of the decision-making process. For Maximiano (2004, p.111):
Uma decisão é uma escolha entre alternativas e possibilidades. As decisões são tomadas para resolver problemas ou aproveitar oportunidades. O processo de tomar decisões (ou processo decisório) é a seqüência de etapas que vai da identificação de uma situação que oferece um problema ou oportunidade, até a escolha e colocação em prática de uma ação ou solução.
It is verified that the decision making is based on the knowledge of the decision maker, as well as on the information systems available in the organization. These systems are developed based on data and information with added value, which are collected and systematized for the purpose of assisting decision making. The data may be collected through assessments and performance indicators.
Methodological procedures
In order to support the research, we selected the standard “ISO nº 11620/2008 Information and documentation – Library performance indicators”, developed by the International Organization for Standardization, as a guiding model for the evaluation of indicators in university libraries.
After identifying the model to be used in this research for the purpose of using performance indicators in university libraries, and to improve the research on how to conduct the performance evaluation in these institutions, we selected the indicators of International Organization for Standardization nº 11620 (2008).
According to ISO nº 11620 (2008), the performance indicators should be informative, reliable, valid, appropriate, practical and comparable. The standard is structured in four categories:
1) Category: “Resources, Access and Infrastructure”. Performance indicators that measure the appropriateness and availability of library resources and services (staff, titles, public access workstations).
2) Category: “Use”. Performance indicators that measure the usage of library resources and services.
3) Category: “Efficiency”. Performance indicators that measure resources and service efficiency (cost per lending, electronic service, or download, the time required to acquire or process documents, and correct answer fill rate).
225
A
VALIA
ÇÃ
O EM BIBLIO
TECAS UNIVERSIT
ÁRIAS
development (a percentage of investments in electronic resources and attendances at formal training lessons for staff ).
The four categories of indicators represent 44 indicators:
– Resources, Access and Infrastructure (13 indicators)
1) Required titles availability.
2) Percentage of required titles in the collection.
3) Subject catalog search success rate.
4) Percentage of rejected sessions.
5) Shelving accuracy.
6) Median time of document retrieval from closed stacks.
7) Speed of interlibrary lending.
8) Percentage of successful interlibrary lending.
9) Public access workstation per capita.
10) User area per capita.
11) Seats per capita.
12) Hours open compared to demand.
13) Staff per capita.
– Use (15 indicators)
1) Collection turnover.
2) Lending per capita.
3) Percentage of stock not used.
4) Number of content units downloaded per capita.
5) In-library use per capita. 6) Library visits per capita.
7) Percentage of information requests submitted electronically.
8) Percentage of external users.
9) Percentage of total library lending to external users.
10) User attendances at library events per capita.
11) Number of user attendances at training lessons per capita.
12) Public seating occupancy rate.
13) Workstation use rate.
14) Percentage of target population reached.
15) User satisfaction.
– Efficiency (11 indicators).
C.P
.C. PEREIRA & G.
VAR
VAKIS
226
2) Cost per database session.
3) Cost per content unit downloaded.
4) Cost per library visit.
5 Median time to document acquisition.
6) Median time of document processing.
7) User service staff as a percentage of total staff.
8) Correct answer fill rate (Reference Service).
9) Ratio of acquisition expenditure to staff costs.
10) Employee productivity in media processing.
11) Cost per user.
– Potentials and development (5 indicators)
1) Percentage of expenditure on information provision spent on the electronic collection.
2) Percentage of library staff providing and developing electronic services.
3) Number of attendance hours at formal training lessons per staff member.
4) Percentage of library means received by special grant or incoming generated.
5) Percentage of institutional means allocated to the library.
The indicators are assessed on the basis of criteria and standards, presented in Annex B of ISO nº 11620. The International Organization for Standardization nº 11620 (2008) describes the indicators as follows: name; objective; scope of performance indicator; definition of the performance indicator; method; interpretations and factors affecting the performance indicator; sources; and related performance indicators.
The study participants were divided into two groups. The first group is composed of librarians from libraries of Higher Education Institutions: Universities, University centers and the Institutos Federais de Educação, Ciência e Tecnologia (IFE, Federal Institutes of Education, Science and Technology). Faculties were disregarded in this research due to a large number of institutions, 2,025 units, according to the INEP (Brasil, 2013).
For the first group of respondents, the questionnaire was structured in electronic form, using the tools of the Google Docs. A brief presentation of the researcher and the research is included, whose main objective was to verify the use of the indicators.
The questionnaire was sent via e-mail to 353 librarians in early August 2012. Of these, 190 are librarians who work in University Libraries, 126 are librarians working in University centers and 37 are librarians in IFE. Of the 353 questionnaires sent, 95 questionnaires were returned, equivalent to 27% of the questionnaires sent, which according to Owen and Jones (1994) is a satisfactory return. The authors suggest that a response rate of 20% is considered adequate and satisfactory, while 40% is exceptionally satisfactory.
Thus, based on Owen and Jones (1994), the data collected were considered representative and, therefore, we were able to proceed with the analysis and interpretation of the results.
227
A
VALIA
ÇÃ
O EM BIBLIO
TECAS UNIVERSIT
ÁRIAS
The selection of these 78 university libraries was determined by the following criteria: to be part of the organizational structure of universities; to represent the best performers; and to represent different administrative categories: private, and public state and federal.
From the results of the data collected from the first group of the research, the performance indicators used were identified and a second questionnaire was formulated to identify the relevance of performance indicators to librarians.
This second questionnaire is structured in 4 modules. The first one is the characterization of the respondents; the second module deals with the verification of the relevance of the 44 (forty-four) performance indicators, which was verified through the Likert scale from 1 to 5: (1) None; (2) Little; (3) Average; (4) Large; and (5) Essential relevance for decision making; the third module refers to the use of performance indicators by university libraries; and the fourth module has the purpose of ascertaining whether performance indicators are used in decision making and how they are used.
From the collected data, in this second questionnaire, we analyzed the performance indicators that are used in university libraries and their real use in the decision-making process. The results of the relevance of the indicators were compared with the use of the indicators.
In order to verify the degree of reliability of the adopted scale, we used the Cronbach’s alpha coefficient. Reliability refers to the extent to which data collection techniques or the analysis of the procedures adopted will produce consistent results (Saunders; Lewis; Thornhill, 2007).
Cronbach’s alpha measures the correlation between responses in a questionnaire by analyzing the profile of responses given by respondents. This is an average correlation between questions (Hora; Monteiro; Arica, 2010, p.89).
For Hair Jr., Black and Babin (2005, p.90), Cronbach’s alpha is a “reliability measure that ranges from 0 to 1, with values from 0.60 to 0.70 considered the lower limit of acceptability”. Thus, the closer to 1, the greater the reliability of the scale.
The use of Cronbach’s alpha coefficient is valid (Hernández; Fernández; Baptista, 2006) when: the data collection instrument is applied once; there is only one version of the instrument to be applied; the participants who provide the data do so only once; what is sought is to verify the consistency of the answers to the items of the research instrument.
In order to obtain the Cronbach’s alpha coefficient, the statistical package SPSS (Statistical Package for the Social Sciences) version 20.0 was used.
This coefficient was verified in each of the analyzed categories: Resources, Access and Infrastructure; Use; Efficiency; Potentials and development.
Analysis of the use of the categories and performance indicators of the libraries of Brazil
Of the 353 questionnaires sent to Higher Education Institutions, 95 questionnaires were returned, with universities representing 49% of the institutions that answered the questionnaire, 36% of university centers and 15% of Institutos Federais de Educação, Ciência e Tecnologia (IFE).
C.P
.C. PEREIRA & G.
VAR
VAKIS
228
The category Resource, Access and Infrastructure, is subdivided into collection, access, facilities, and staff, which represents 13 indicators.
According to the data collected from librarians who coordinate university libraries, the majority (39%) use the indicators of the category Resources, Access and Infrastructure, which measure the appropriateness and availability of library resources and services (officials, titles, public access workstations).
Although the indicators of this category are the most used by librarians of university libraries, it is still considered a low percentage, since these represent the main function of the library, which is to offer information to its users. It is recommended that the indicators of this category may be employed, since the library is considered as an institution that promotes knowledge, providing information to support research (Klaes, 1991).
The indicators of the category “Use” are intended to measure the use of library resources and services. It is used by 34% of librarians, which is considered unsatisfactory, considering that libraries, “[...] as suppliers of inputs of strategic value in the process of growth and modernity, must learn to act in this changing environment, adapting their products to the new demands of their customers” (Rocha; Gomes, 1993, p.1).
The category “Efficiency” is subdivided into 11 indicators, whose purpose is to measure the efficiency of the resources and services offered. These indicators are used by only 17% of librarians. This percentage may be considered low since this category of indicators basically verifies the resources employed in the products and services offered to the users. According to Andrade (2004, p.101):
É necessário atentar que as bibliotecas universitárias não podem mais justificar a sua necessidade apenas pelo aspecto teórico da importância da informação, mas faz-se necessário agregar a esse discurso, dados e objetivos que justifiquem sua necessidade para as instituições as quais estão ligadas, particulares ou públicas, bem como os gastos por elas realizados.
The indicators of the category “Efficiency” are used, on average, by 19% of the librarians: collection (12%); access (29%), staff (29%), and general (7%). Considering that the percentage of use of the indicators of the category Efficiency is relatively low and that these are supposed to produce the maximum with the minimum of consumption, it is possible to infer that the managers of the information units, for the most part, are not evaluating the adequate use of the material, financial and human resources, which may have a negative impact on the way in which the university library is managed.
Based on this information, the question is what are the means the managers of units of information use to map the resources invested and what are the returns that the library has, as well as the maintaining institution that controls the resources destined to the university library.
According to Alonso Arévalo, Echeverría Cubillas and Martín Cerro (1999, p.44) “Sem um sistema de avaliação de resultados e de custos, a administração pública abre margem para encobrir ineficiência. Como já foi ressaltada, a inexistência de medidas de desempenho é, por si só, uma forte indicação de ineficiência”. It is observed that evaluating is an inherent activity to the function of managing an organization, that verifies the costs of the products and services is necessary to provide and propose products and services with quality.
The five indicators of the category “Potentials and Development” are used by 10% of the librarians participating in the research. These indicators aim to measure the “investimento da biblioteca em serviços e recursos de informação emergentes, e seu potencial e capacidade de angariar recursos para o desenvolvimento (percentual de investimentos em recursos eletrônicos e em cursos formais de capacitação do pessoal)” (International Organization for Standardization, 2008, p.18).
229
A
VALIA
ÇÃ
O EM BIBLIO
TECAS UNIVERSIT
ÁRIAS
We analyzed the correlation of the indicators of ISO nº 11620/2008. Of the 44 indicators, eight present a discrepancy of more than 10% among the correlated indicators.
This discrepancy of the indicators related to the same purpose, which in some cases are used, but in others are not, generates incomplete data for the managers of the libraries to make decisions. For example, the library visits indicator is used by 45% of the librarians and the cost per library visit indicator is used by only 8% of the librarians.
Analysis of the use of the categories and performance indicators
In this section, data from 22 librarians are presented and analyzed, which is equivalent to 29% of the 78 questionnaires sent to Higher Education Institutions, whose grade in the “Índice Geral de Cursos” is 4 or 5. Of these librarians, 73% are from universities, 9% from university centers and 18% from IFE.
Of the 22 respondent librarians, one holds an undergraduation degree, 13 hold a specialization, eight hold a master’s degree and none hold a doctorate. As for the time of training in the area, two respondents graduated less than 1 year ago, two between 1 and 5 years, four between 5 and 10 years and 14 over 10 years ago, two between 1 and 5 years, four between 5 and 10 years and 14 more than 10 years ago.
The operation time of the librarians in the process of evaluation of the university library is in the average 9 years, as well as how long ago they graduated in the area are considered satisfactory, because they present a high index of graduation and performance, thus favoring the research.
The degree of reliability was verified by means of the Cronbach’s alpha coefficient, which, according to Hair Jr., Black and Babin (2005), the closer to 1, the greater the reliability of the scale. If lower values are noticed, elimination simulations of each indicator were performed individually, in order to verify whether the reliability value of the adopted scale could be higher.
The category “Resources, Access and Infrastructure”, composed of 13 indicators, obtained the Cronbach’s alpha coefficient of 0.895.
The category “Use” is analyzed on the basis of 15 indicators and obtained the Cronbach’s alpha coefficient of 0.912.
The category “Efficiency” is analyzed on the basis of 11 indicators and obtained the Cronbach’s alpha coefficient of 0.919.
The category “Potentials and Development” is analyzed on the basis of five indicators, obtaining the Cronbach’s alpha coefficient of 0.910.
From the reliability value of the categories, it is verified that even if some indicator is discarded, the increase would be minimal and there would be no influence on the reliability of the categories.
Thus, it is considered that all indicators are relevant to research and related to the management of university libraries.
In the category “Resources, Access and Infrastructure”, it is observed that only two performance indicators. Speed of Interlibrary lending and Percentage of successful interlibrary lending, did not obtain more than 50% of relevance; the remaining 11 indicators have relevance superior to 50% for the decision making. In this way, it may be inferred that the performance indicators of this category are relevant for decision making, pointing to the indicators: Percentage of required titles in the collection, and Hours open compared to demand, as the key performance indicators relevant to decision making.
C.P
.C. PEREIRA & G.
VAR
VAKIS
230
making. However, in verifying the purpose of this category, which is to measure the use of the resources and services of the library, it is questioned how the managers of these university libraries evaluate the use of the products offered by the unit of information.
In the category “Efficiency”, of the 11 performance indicators, 7 presented a low percentage of relevance. And only four indicators have relevance greater than 50% for decision making. From this result, it may be concluded that performance indicators in the category Efficiency are not being applied in order to support decision making, which could lead to losses to the management of the university library, such as the lack of resources to maintain or operate certain products.
The last category, “Potentials and development”, which addresses performance indicators that measure the library’s investment in services, up-to-date information resources, and the potential and capacity to raise resources for development (percentage of investments in electronic resources and formal staff training courses) is evaluated based on five indicators, which, in general, have a low percentage of relevance, according to respondent librarians.
It is verified that the librarians managers/coordinators of university libraries are not using the indicators of performance of this category in the decision making, with the exception of the indicator Percentage of institutional means allocated to the library, which has a relevance percentage of 55%, but which is still considered a low percentage due to the relevance of such indicator for decision making.
Indicators and management of university libraries
According to the notes of the librarians that compose the second stage of this research, the performance indicators have a degree of importance of 77%. It is concluded that librarians recognize the importance of using performance indicators. However, the application of these indicators, according to the results shown in the first stage of the research, corresponds to the average of only 32%.
According to the librarians, the periodicity of the evaluation in the university library is once a year (27%). On the other hand, the application of the evaluation is 32% conditioned to the evaluation of the university library by the Ministry of Education.
It is verified that the librarians managers/coordinators of university libraries are conditioned to the evaluation of the Brazilian Ministry of Education. It institutionally satisfies the basic needs of the maintaining institution, which are related to the accreditation and renewal of accreditation of universities and the recognition and renewal of recognition of the undergraduate courses.
The evaluations that are applied by the Brazilian Ministry of Education, which integrate the “Sistema Nacional de Avaliação da Educação Superior”, the university library is in the Dimension “Infrastructure”. It refers essentially to the evaluation of the composition and characteristics of the collection, and the data collected through this process are insufficient for a more proactive management.
The management of the university library is considered an important point for the quality of the education and achievement of a satisfactory performance of the maintaining institution.
The periodicity of the evaluation in university libraries is conditioned to the evaluation of the maintaining institution. Thus, it is verified that 33% of librarians point out that the performance evaluation of the library is performed by the institutional requirement.
231
A
VALIA
ÇÃ
O EM BIBLIO
TECAS UNIVERSIT
ÁRIAS
Respondent librarians, at this stage of the research, are asked whether the institutions they are part of have sector libraries or if there is only one central library and what their participation in the evaluation committee is: 14 librarians point out that there are sector libraries, but only seven of these libraries are part of the evaluation committee.
The librarians on the evaluation committee are filled in the following sectors of university libraries: management; reference; technical processing; collection development, and information technology. That is, they are in the main sectors of university libraries, which are responsible for the main products and services offered to users.
Librarians managers/coordinators of university libraries are questioned about the number of members in the evaluation committee. The average number of participants in the commission is six members.
Librarians conduct the performance evaluation in the university libraries where they work with the purpose of improving the management, and therefore, to offer more products adapted to the needs of the users. In the answers, there were some common terms to the management of organizations, such as continuous improvement and user satisfaction, observing the librarian B report and that, to some extent expresses the main purpose of the university library:
O processo de avaliação dentro de uma biblioteca é de extrema importância, tendo em vista que, será a partir dos resultados obtidos que melhorias serão realizadas e até mesmo à adequação da biblioteca para atender as necessidades dos usuários. Pois a biblioteca deve existir com o intuito de atender as necessidades dos seus usuários e para que isso aconteça avaliações devem ser realizadas periodicamente (Pereira, 2013, p.132).
Relationship of performance indicators and the decision-making
In order to verify the use of performance indicators for decision making, librarians were asked whether they were based on data provided by performance indicators to make decisions. According to librarians, 77% use the results in decision making.
It is verified, therefore, that the librarians use the results obtained through the application of performance indicators to make decisions. Such action is considered positive for the management of the organizations, as well as of the university library. For Neely et al. (1996), the performance indicator allows institutions to know what they are doing and what the results of their actions are. Thus, it is possible to quantify the efficiency and/or effectiveness of a decision-making process. In this way, the librarian, when using the results of the performance evaluation for the decision making, may improve the products offered to the users. Consequently, a better higher education is also offered, since the use of properly developed performance indicators to the needs of university libraries provides efficiency, speed, and security to managers, who begin to better evaluate the various decisions to be made and their impact (Soares, 2006).
The next question verifies the purpose of the university library of using performance indicators for decision making. Based on the answers, it turns out that there is the interest of the librarians to follow the performance indicators, and based on the results, to make the decisions in order to improve the products offered.
The satisfactory performance of the university library is established through management tools, the inclusion of the team and the ability of the manager to apply the methodologies for the management and to meet the needs of the academic community and the criteria established by the Ministry of Education.
C.P
.C. PEREIRA & G.
VAR
VAKIS
232
In this research, librarians are asked which of the four categories from ISO n° 11620 (International Organization for Standardization, 2008) Information and documentation – Library performance indicators: Resources, Access and Infrastructure; Use; Efficiency; and Potentials and development, would be considered for decision making. According to them, all four categories (70%) are necessary for decision making, but in general, the categories Resources, Access and infrastructure, and Use would be the most used in it.
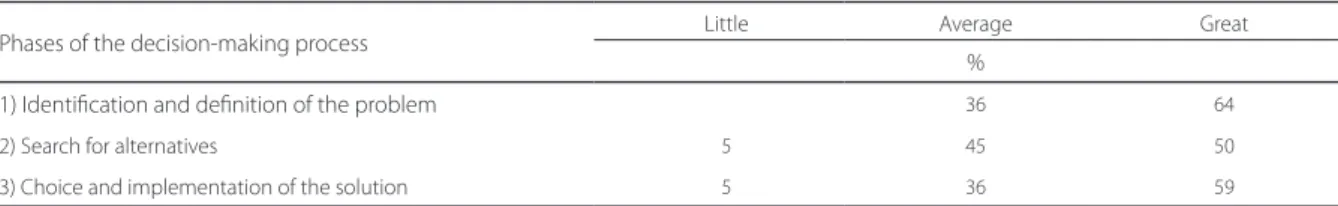
According to Choo (2006), the decision-making process is arranged in three major phases: (1) identification and definition of the decision problem, (2) development and search for solution alternatives, and (3) analysis and choice.
Thus, in order to verify in which phases of the process the use of performance indicators were mostly used, librarians were asked to specify the intensity of use of the indicators in each phase (Table 1).
We noted that the use of performance indicators is being used more in the identification and definition of the problem (64%). In the phase of choice and implementation of the solution, the use of performance indicators has great intensity (59%), since for the librarian G, the use is: “To improve the quality of the services offered by the library, and implement new services according to the needs of users”.
Based on this module of the questionnaire, we see the importance that librarians attach to the use of performance indicators for decision making (73%), but for some reason, from the precarious infrastructure to few human resources, the performance evaluation is not done. As a consequence, they do not apply the results obtained through the performance indicators in decision making, which according to respondent librarians makes it impossible to satisfactorily improve the products and services offered.
Based on the data collected, it is verified that the performance indicators are considered relevant for decision-making by about 50% of the librarians participating in the second stage of the research. However, it is on average little used by about 30% of the librarians participating in the first stage of the research.
Considerations regarding the use and relevance of performance indicators
According to the data collected, together with the 95 librarians of university libraries and the 22 librarians managers/coordinators of university libraries, only six indicators out of 44 are used more than 50%. They are Required titles availability; Percentage of required titles in the collection; Hours open compared to demand; collection turnover; Lending per capita; and In-library use per capita.
These indicators represent the categories of “Resources, Access and Infrastructure”, and the category “Use” of ISO nº 11620/2008 Information and documentation – Library performance indicators.
The indicators most commonly used by librarians are present in the “Institutional Evaluation of the Ministry of Education”, through Sistema Nacional de Avaliação da Educação Superior, indicators that appear in Dimension 7 of the evaluation document, more precisely in item 7.4, which deals with Library: collection, services, and physical space.
Table 1. Intensity of the use of performance indicators in the decision-making phases, according to Choo (2006).
Phases of the decision-making process Little Average Great
%
1) Identification and definition of the problem 36 64
2) Search for alternatives 5 45 50
3) Choice and implementation of the solution 5 36 59
233
A
VALIA
ÇÃ
O EM BIBLIO
TECAS UNIVERSIT
ÁRIAS
The coincidence between the most used indicators and the Sistema Nacional de Avaliação da Educação Superior indicators corroborates with the data collected in the second stage of the research, which shows that the evaluation of the university libraries is more incisive based on the institutional requirement (33%) and by a requirement of the Ministry of Education (30%).
The User Manual – HEI Module (Brasil, 2012), which provides information about the data collection that is in effect for the 2011 education census, lists the following items that are evaluated in the library: type of library (central or sectoral); wireless network; online catalog of public service; seats (number of seats available to library users); home lending; interlibrary lending; bibliographic switching; users trained in qualification programs; and collection.
These indicators are set out in International Organization for Standardization nº 11620 (2008). However, they are little used, according to the librarians. The online catalog of public service is mentioned in ISO nº 11620/2008 as the indicator Subject catalog search success rate, which obtained a percentage of 35% of use.
The variable seat (number of seats available to users of the library) is mentioned in ISO nº 11620/2008 as a
per capita indicator of seats and obtained a percentage of 43% of use.
The home lending is included in ISO nº 11620/2008 as per capita lending and obtained a percentage of 57% of use.
The item interlibrary lending, mentioned in the standard as Percentage of successful interlibrary lending has a percentage of use of 23% according to the librarians of HEIs.
The item Users trained in qualification programs, described in the standard as an indicator Number of user attendances at training lessons per capita, had a use percentage of 34%.
Finally, the last item to be evaluated by the “Censo de Educação” collection (2011), that according to ISO nº 11620/2008 is described as Required titles availability, which has obtained the percentage of use of 61%. This is the most used indicator out of 44 indicators available in the standard.
From this comparison, it is verified that of the eight items listed in the census manual of higher education, six indicators are listed in the standard and that only two, per capita lending and collection, have the percentage of use greater than 50%. It is believed that if a new research was carried out with the librarians of Higher Education Institutions, these four indicators that obtained a percentage lower than 50% would probably obtain a higher percentage of use, since, from this census, these variables were included.
As seen, only 6 indicators out of 44 have a percentage of use greater than 50%. However, when the relevance of these indicators to the decision making is verified, 23 of them are relevant. On the other hand, there is a discrepancy between the use and relevance of performance indicators to the decision making.
The six most commonly used indicators in performance evaluation are “Required titles availability”, “Percentage of required titles in the collection”, “Hours open compared to demand, collection turnover, per capita
lending”, and “In-library use per capita”. On the other hand, the 11 indicators: – Cost per user.
– Cost per library visit.
– Cost per content unit downloaded.
– Cost per lending.
– Number of content units downloaded per capita.
– Ratio of acquisition expenditure to staff costs.
C.P
.C. PEREIRA & G.
VAR
VAKIS
234
– Percentage of library staff providing and developing electronic services.
– Number of attendance hours at formal training lessons per staff member.
– Percentage of library means received by special grant or incoming generated.
– Percentage of institutional means allocated to the library.
They obtained a percentage of use of less than 18%, a value considered negative since such indicators are considered relevant for decision making such as the indicator cost per user, which has a percentage of use of 7% and a value of relevance of 23%. This leads us to conclude that librarians are not evaluating the use of resources allocated to the library.
Conclusion
The evaluation of educational institutions aims to facilitate control in the management process and serve as a reference base for communication between library staff, funding agencies and the community of users, providing for the maintenance of educational systems and the instruments for the development of human knowledge.
It is concluded that the indicators are relevant for decision making and their use has the purpose of identifying and defining the problem in order to improve the quality of the services offered and, consequently, improve the performance of the library, but its use is by a small number of librarians.
It is verified that 30 indicators have a high percentage of a difference between use and relevance of the indicators for decision making. Performance indicators are relevant for decision-making and therefore for better management of the resources made available to the university library, but these indicators are generally not used, such as indicators relating to costs and library resources. Although considered relevant for decision-making, they generally have low utilization rates.
In practice, what is observed in university libraries are generally fragmented and unsystematic evaluations, in which opinions about the performance of these institutions are issued without the necessary theoretical and methodological background, thus making it impossible to plan actions and make decisions.
Finally, it is concluded that performance indicators are essential for the management of libraries and that the indicators of the ISO nº 11620/2008 Information and documentation – Library performance indicators are relevant for decision-making, but they are generally not used, and when it happens, it is in order to satisfy the evaluations carried out through Sistema Nacional de Avaliação da Educação Superior.
Acknowledgments
I thank all the librarians who participated in the research, Coordenação de Aperfeiçoamento de Pessoal de Nível Superior for the financial incentive, professor Grego for the perseverance and support, especially my dear Professor Delsi Fries Davok, friend and reference in life, a star that shines in the sky.
Contributors
235
A
VALIA
ÇÃ
O EM BIBLIO
TECAS UNIVERSIT
ÁRIAS
References
Almeida, M. C. B. Planejamento de bibliotecas e serviços de informação. 2. ed. Brasília: Briquet de Lemos, 2005.
Alonso Arévalo, J.; Echeverría Cubillas, M. J.; Martín Cerro, S. La gestión de las bibliotecas universitarias: indicadores para su evaluación. León: Universidad de León, 1999. Disponible en: <http://eprints.rclis.org/4285/1/Indicadores.pdf>. Acceso en: 2 oct. 2017.
Andrade, M. V. M. Gestão pela qualidade em bibliotecas universitárias: indicadores de desempenho e padrões de qualidade. 2004. 115 f. Dissertação (Mestrado em Sistemas de Gestão) – Universidade Federal Fluminense, Niterói, 2004. Disponível em: <http://www.bdtd.ndc.uff.br/tde_arquivos/ 14/TDE-2007-04-17T151438Z-734/Publico/Dissertacao%20 MarcosAndrade.pdf>. Acesso em: 2 out. 2017.
Brasil. Ministério da Educação. Censo da educação superior 2011: manual do usuário: módulo IES. Brasília: Ministério da Educação, 2012. Disponível em: <http://download.inep.gov. br/educacao_superior/censo_superior/questionarios_e_ manuais/2011/manual_ies_v2501.pdf>. Acesso em: 2 out. 2017.
Brasil. Ministério da Educação. Censo da educação superior 2010: resumo técnico. Brasília: INEP, 2013. Disponível em: <http:// download.inep.gov.br/download/superior/censo/2011/ resumo_tecnico_censo_educacao_superior_2011.pdf>. Acesso em: 2 out. 2017.
Choo, C. W. The management of uncertainty: Organizations as decision-making systems. In: Choo, C. W. The knowing organizations: How organizations use information to construct meaning, create knowledge, and make decisions. Oxford: Oxford University, 1998. p.155-205.
Choo, C. W. A organização do conhecimento: como as orga-nizações usam a informação para criar significado, construir conhecimento e tomar decisões. 2. ed. São Paulo: Senac, 2006. Guimarães, E. M. P.; Évora, Y. D. M. Sistema de informação: instrumento para tomada de decisão no exercício da gerência. Ciência da Informação, v. 33, n. 1, p. 72-80, 2004. Disponível em: <http://www.scielo.br/pdf/ci/v33n1/v33n1a09. pdf>. Acesso em: 2 out. 2017.
Hair Jr., J. F.; Black, W. C.; Babin, B. J. Análise multivariada de dados. 5. ed. Porto Alegre: Bookman, 2005.
Harrington, H. J.; Harrington, J. S. Gerenciamento total da melhoria contínua: a nova geração da melhoria do desempenho. São Paulo: Makron Books, 1997.
Hernández, R.; Fernández, C.; Baptista, P. Metodología de la investigación. 4. ed. Ciudad de México: McGraw Hill, 2006. Hora, R. G. M.; Monteiro, G. T. R.; Arica, J. Confiabilidade em questionários para qualidade: um estudo com o coeficiente Alfa de Cronbach. Produto e Produção, v. 11, n. 2, p. 85-103, 2010. Disponível em: <http://seer.ufrgs.br/ProdutoProducao/ article/view/9321>. Acesso em: 2 out. 2017.
International Organization for Standardization. ISO 11620: Information and documentation: Library performance indicators. Genebra: ISO, 2008.
Klaes, R. R. Dados e informações usados na tomada de decisão em bibliotecas universitárias brasileiras: o contexto da atividade de desenvolvimento de coleções. 1991. 288 f. Dissertação (Mestrado em Biblioteconomia e Documentação) – Univer-sidade de Brasília, Brasília, 1991. Disponível em: <http://www. lume.ufrgs.br/handle/10183/1412>. Acesso em: 2 out. 2017.
Lancaster, F. W. Avaliação de serviços de bibliotecas. Brasília: Lemos Informação e Comunicação, 2004.
Maximiano, A. C. A. Introdução à administração. 6. ed. São Paulo: Atlas, 2004.
McGee, J., Prusak, L. Gerenciamento estratégico da informação: aumente a competitividade e a eficiência de sua empresa utilizando a informação como uma ferramenta estratégica. Rio de Janeiro: Campus, 1994.
Neely, A. et al. Performance measurement system design: Should process based approaches be adopted? International Journal Production Economics, v. 46-47, p. 423-431, 1996. Available from: <http://www.sciencedirect.com/science/article/ pii/S0925527396000801>. Cited: Oct. 2, 2017.
Owen, F.; Jones, R. Statistics. London: Pitman, 1994.
Pereira. C. P. C. Avaliação de desempenho e tomada de decisão em bibliotecas universitárias. 2013. 197 f. Dissertação (Mestrado em Ciência da Informação) – Universidade Federal de San-ta CaSan-tarina, Florianópolis, 2013. Disponível em: <https:// repositorio.ufsc.br/handle/123456789/107216>. Acesso em: 2 out. 2017.
Rocha, E. C.; Gomes, S. H. A. Gestão da qualidade em unidades de informação. Ciência da Informação, v. 22, n. 2, p. 142-152, 1993. Disponível em: <http://revista.ibict.br/ciinf/article/view/ 501/501>. Acesso em: 2 out. 2017.
Saunders, M.; Lewis, P.; Thornhill, A. Research methods for business students. 4th ed. Harlow: Pearson Education, 2007.
Soares, E. A. R. Entidades beneficentes de assistência social educacionais: uma investigação sobre a medição de desem-penho organizacional. 2006. 131 f. Dissertação (Mestrado em Ciências Contábeis) – Universidade de Brasília, Brasília, 2006. Disponível em: <http://repositorio.unb.br/handle/104 82/2278?mode=full>. Acesso em: 2 out. 2017.
Stubbs, E. A. Indicadores de desempeño: naturaleza, utilidad y construcción. Ciência da Informação, v. 33, n. 1, p. 149-154, 2004. Disponible em: <http://www.scielo.br/pdf/ci/v33n1/ v33n1a18.pdf>. Acceso en: 2 oct. 2017.
Tarapanoff, K. Planejamento de e para bibliotecas universitárias no Brasil: sua posição sócio-econômica e estrutural. In: Seminário Nacional de Bibliotecas Universitárias, 2., 1981, Brasília. Anais... Brasília: Capes, 1981. p. 9-35.