ISSN 1980-5527
http://dx.doi.org/10.1590/198055272212 elocation - e182212
www.ie.ufrj.br/revista | www.scielo.br/rec
THE HISTORICAL PEAK OF THE RATE
OF SURPLUS VALUE AND THE “NEW
NORMAL” OF THE CHINESE ECONOMY:
A POLITICAL ECONOMY ANALYSIS
Hao Qia
aAssistant Professor at the School of Economics, Renmin University of China.
Manuscript received on 2017/03/07 and accepted for publication on 2017/08/171
ABSTRACT: This paper reports homogenous series of the rate of surplus value for
the Chinese economy over the period 1956-2015 with a Marxian approach. It finds that the rate of surplus value reached the historical peak of the whole period in 2008 and that the high profitability in the decade before the 2008 crisis had relied on the continuous growth in the rate of surplus value. It provides a time series analysis to show that the rising wage pressure and value composition of capitalhas restrained profitability since 2008. Thus, this paper interprets the so-called “new normal” of the Chinese economy as a stage of declining profitability that results mainly from the stag-nant rate of surplus value and the rising value composition of capital.
KEYWORDS: rate of surplus value; profitability; new normal; chinese economy.
JEL CODES: B51; O53; P2.
O PICO HISTÓRICO DA TAXA DE MAIS-VALIA E
O “NOVO NORMAL” DA ECONOMIA CHINESA:
UMA ANÁLISE DE ECONOMIA POLÍTICA
RESUMO: Este artigo apresenta séries homogêneas da taxa de mais-valia para a
eco-nomia chinesa no período 1956-2015 a partir de uma abordagem marxiana. Verifica-se que a taxa de mais-valia atingiu o pico histórico de todo o período em 2008, e que a alta rentabilidade na década anterior à crise de 2008 se baseou no contínuo crescimento da taxa de mais-valia. O artigo fornece uma análise de séries temporais para mostrar que a crescente pressão salarial e a composição orgânica do capital têm restringido a lucra-tividade desde 2008. Assim, este artigo interpreta o chamado “novo normal” da eco-nomia chinesa como uma fase de declínio da lucratividade que resulta principalmente da estagnação da taxa de mais-valia e do aumento da composição orgânica do capital.
PALAVRAS-CHAVE: taxa de mais-valia; rentabilidade; novo normal; economia
1. INTRODUCTION
This paper reports a homogeneous series of the rate of surplus value (RSV, hereaf-ter) for the Chinese economy using a Marxian approach. This approach highlights the division between productive labor and unproductive labor, and argues that the value that unproductive labor obtains is a transfer of surplus value. The origin of the approach dates back to classical economists, including Adam Smith, David Ricardo, and Karl Marx; in recent decades, Moseley (1985) and Shaikh and Tonak (1994) de-veloped the approach and made it empirically applicable with statistical data. Some country-specific studies have applied the approach and obtained interesting findings (CRONIN 2001; MANIATIS, 2005; MOHUN, 2005; MOHUN, 2013; PAITARIDIS and TSOULFIDIS, 2011). This approach is not unfamiliar to Chinese economists, who had intensive discussions on the division of productive and unproductive labor from the late 1970s to the early 1990s (for instance, YU, 1981; SUN, 1981; WEI, 1981; LUO, 1990). Chinese economist Luo Gengmo compared the U. N. System of National Ac-counts and Marxian theories and attempted to establish a statistical system that is con-sistent with the Marxian division of productive and unproductive labor (LUO, 1990). In an earlier paper, I discussed the theoretical issues about the definitions of Marxian variables in China’s transitioning economy. I also built series of the RSV for the Chi-nese economy over an extended period from 1956 to 2014 (QI, 2017), which might be the first attempt to build series of Marxian variables for China over such a long period.
In this paper, I replicate the results of the earlier paper and extend the series to 2015 with recently published China’s official statistical data. More importantly, I make use of the series to provide a political economy analysis of the Chinese economic dy-namics, in particular, the “new normal” stage of the economy. “New normal” in the West refers to the conditions of financial markets and advanced capitalist economies after the global crisis, which Summers (2015) interpreted as “secular stagnation”. In May 2014, President Xi Jinping proposed that the Chinese economy had entered a “new normal” phase; however, what the concept means for the Chinese economy is ambiguous. The objective of this paper is to understand China’s so-called “new nor-mal” from the dynamics of the RSV and its crucial role in affecting profitability during the reform era. The main findings are: the RSV followed a U-shape from 1978 to 2008, reached the trough in 1997, stagnated and slightly fell after 2008. While the RSV in China was not as high as that in the U.S.1, it reached its historical peak when the global crisis broke out. With a time series analysis, I find that the rising wage pressure and
1 The RSV in the U.S. was around 3.5 in 2008 (PAITARIDIS and TSOULFIDIS, 2011), compared to 2.6 in
the value composition of capital are the main factors that restrained profitability in the “new normal” stage.
In what follows, this paper is organized into four sections. Section 2 briefly intro-duces the definitions of the RSV and relevant Marxian variables and describes their historical trends. Section 3 analyzes what factors affected the net rate of profit during the reform era with a time series analysis. Section 4 discusses why these factors have restrained profitability since 2008. Section 5 concludes the paper.
2. DYNAMICS OF THE RSV IN THE ENTERPRISE SECTOR
This section briefly introduces the definitions of the RSV and relevant Marxian vari-ables. For a detailed introduction of the calculation procedures and data sources, please see Qi (2017). Then, this section discusses the trends of the RSV and relevant Marxian variables and discusses the relationship between the RSV and the net rate of profit.
2.1. DEFINITIONS
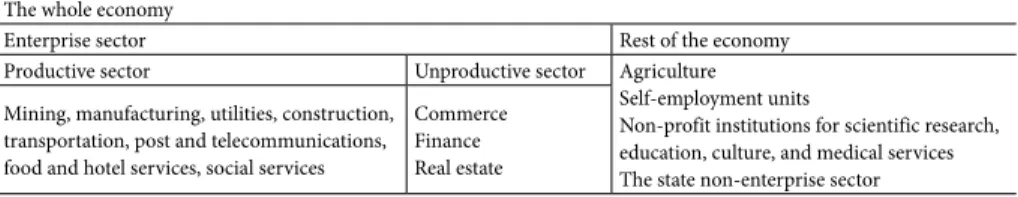
The division between productive and unproductive labor is a perspective to see how the new value of an economy is circulated and distributed, which enables us to trace the flow of new value and measure critical Marxian variables (e.g. Marxian value added, variable capital, surplus value). Current studies that take the transfer of surplus value into account start with restructuring the economy by a division of productive and unproductive labor (sectors) and then measure Marxian variables using data from input-output tables and GDP accounting. Following this approach, I divide the Chi-nese economy into productive sectors and unproductive sectors, as shown in Table 1. “Productive sectors” means that there are some productive activities in these sectors, while “unproductive sectors” means that there is no productive activity in these sec-tors. A kind of labor is productive if it creates objects of use values, while labor is un-productive if it only distributes existing objects of use values or maintains social order.
Table 1 – The Chinese Economy from a Marxian Perspective
The whole economy
Enterprise sector Rest of the economy
Productive sector Unproductive sector Agriculture
Self-employment units
Non-profit institutions for scientific research, education, culture, and medical services The state non-enterprise sector Mining, manufacturing, utilities, construction,
transportation, post and telecommunications, food and hotel services, social services
Commerce Finance Real estate
We focus on the enterprise sector because, first of all, it was the dominant part of the economy over the entire period and, secondly, it was a relatively homogenous sec-tor. Within this sector, the worker-socialist state relation transited to the worker-cap-ital relation as the economic transition proceeded. Commerce, finance and real estate are unproductive sectors in the sense that no productive activity exists in these sectors. In China’s state-socialist economy, a part of the surplus value was transferred from productive sectors to unproductive sectors, similar to the transfer of surplus value in a capitalist economy.
It is noteworthy that Marxian variables describe a capitalist economy. Thus, they are not directly applicable to China. China established a state-socialist economic sys-tem in 1956, when it accomplished the Socialist Transformation, and experienced the transition to a capitalism-dominated economic system that started in 1978 and ac-celerated after 1992. There was no capitalist component in the economy from 1956 to 1978, and the capitalist component did not play a major role until 1992. Given China’s economic transition, can one apply the Marxian conceptions designed for a capitalist economy to the Chinese economy, in particular for the period before 1992?
In a capitalist economy, it is the contested terrain in the workplace where exploita-tion occurs that generates the division between variable capital and surplus value. The micro-foundation of China’s state-socialist economy was much different: all means of production were publicly owned assets; workers enjoyed job security and various ben-efits; before 1978, especially during the Cultural Revolution, workers had some rights to criticize cadres in factories; the economic inequality between workers and cadres were small. Although no capitalist-worker conflict existed in the socialist economy, there was a contradiction between workers and the state, between the national prod-ucts distributed to workers as wages and that submitted to the state as surplus. Raising wages could enhance the living standards of workers; nevertheless, the state aimed at not only enhancing the living conditions, but also accomplishing industrialization, for which accumulation of surplus was obviously a prerequisite. Giving this contradiction, the distribution between workers and the state could reflect the contradiction between workers’ living standards and the aim of industrialization. For the sake of simplicity, admitting the difference between wages and variable capital and that between surplus and surplus value, the rest of the paper uses variable capital and surplus value for the entire period.
The RSV is the ratio of surplus value (SV) to variable capital (VC). The RSV, SV, and VC are given by equations (1)-(3):
RSV = SV⁄VC (1)
VC = (1 – α)ECp (2)
In equation (2), ECp is the employees’ compensation of productive sectors, con-sisted of all the wages, salaries, and benefits of workers and managers; α is the share of supervisory labor’s compensation in ECp. In equation (3), NVp is the net value added of the productive sector, which equals to the sum of ECp, operating surplus and net taxes on production; TOt is the total output of the commerce sector, which equals to the sum of intermediate inputs, depreciation of fixed capital, employees’ compensa-tion, operating surplus and net taxes of the commerce sector; RYp and RYt are royalty
payments paid by productive sectors and the commerce sector to the finance sector as intermediate inputs, respectively.
Further, we define u as the share of surplus value extracted by unproductive sec-tors, σ as the value composition of capital, GRP as the gross rate of profit, and NRP as the net rate of profit.
u = UP⁄SV (4)
σ = K⁄VC (5)
GRP = SV⁄K (6)
NRP = (SV – UP)⁄K (7)
In equation (4), UP is the surplus value extracted by unproductive sectors. In equation (5), K is the non-residential capital stock of the enterprise sector, measured by replacement costs.
2.2. TRENDS
Figure 1 – Rate of Surplus Value, 1956/2015
2,5 3
2
1,5
1
0,5
0
1956 1958 1960 1962 1964 1966 1968 1970 1972 1974 1976 1978 1980 1982 1984 1986 1988 1990 1992 1994 1996 1998 2000 2002 2004 2006 2008 2010 2012 2014
RSV RSV estimated
Sources: Data appendix of Qi (2017).
Why did the RSV change in such a U manner? In the early stage of the reform era, the reformers undermined the incentive system within the factories of the Maoist era featured by nonmaterial incentives and encouraged the adoption of material in-centives, such as bonuses and piece wages. Workers lost some critical political rights, but still enjoyed job security and various benefits. The economic inequality between workers and cadres in factories was small, and cadres tended to pursue higher wages and more benefits for both workers and themselves. In this situation, without the stick of unemployment, material incentives were increasingly ineffective in disciplining workers and absorbing surplus labor, which is an important reason for why the RSV decreased from 1978 to the 1990s (QI, 2015).
The upturn of the RSV was possible, thanks to the expansion of the private sec-tor and the reserve army of labor. Private enterprises use harsh management prac-tices and disobey the Labor Law on signing labor contracts and restricting working hours. Thus the RSV of the private sector is higher than that of the state-owned sec-tor. The increase of the RSV echoes the falling share of the state-owned sector in the economy. In 1997, when the RSV reached its trough of the reform era, the 15th National Congress of the Communist Party of China accelerated the reform on the state-owned sector, consisted of laying off workers, privatizing small and medium-scale enterprises, and transforming large-medium-scale enterprises into shareholding com-panies. Meanwhile, due to market competition and profit motivation, state-owned enterprises tended to adopt management and employment practices similar to those of private enterprises.
The reserve army of labor emerged as migrant workers from rural areas seek jobs in cities and the state-owned enterprises laid off massively. Despite a large rural un-deremployed population, the formation of a reserve army of labor requires institu-tional changes in both the rural and urban sectors. The de-collectivization of the rural economy, the stagnation of rural household income, the expansion of the urban pri-vate sector, and the tendency of the state-owned sector to replace urban workers with migrant workers prepared the necessary conditions for the influx of migrant workers. Meanwhile, laid-off workers of the state-owned sector also expanded the reserve army of labor. One of the objectives of the drastic reform of the state-owned sector was “in-creasing efficiency by reducing employment.” In fact, workers had begun to lose their jobs even earlier; from the mid-1990s to the early 2000s, more than 30 million workers lost jobs from state-owned enterprises. Employment of state-owned and state holding industrial enterprises dropped by 6% in 1997, by 7% in 1998, and by about 10% each year from 1999 to 2003.
It is noteworthy that the RSV reached its historical peak in 20082, which was even higher than that in 1978. At the beginning of the reform era, the reformers gained support from workers by raising wages and criticizing that the distribution policies of the Maoist era failed to improve the living conditions of workers3. In 2008, when the RSV was higher than the 1978 level, it lost its momentum. One may expect that today a redistribution of income will also gain support from workers, which is likely to bring major institutional changes.
Figure 2 shows the share of surplus value extracted by unproductive sectors, u. Given that commerce and finance under the planning economy were small, they did not play a significant role in the Maoist era. In the early stage of the reform era, the share of surplus value extracted by unproductive sectors rose slightly but was still relatively small before 2000. This proportion had increased substantially from about 20% to about 30% after 2000. A fast growing RSV implies that the economy is likely to encounter the underconsumption crisis tendency. The economy had to rely more on not only investment and export but also unproductive activities such as commer-cial and financommer-cial activities to absorb surplus value and avoid an underconsumption crisis.
Figure 2 – Share of surplus value extracted by unproductive sectors, 1956/2015
1956 1958 1960 1962 1964 1966 1968 1970 1972 1974 1976 1978 1980 1982 1984 1986 1988 1990 1992 1994 1996 1998 2000 2002 2004 2006 2008 2010 2012 2014
UP UP estimated
0,4
0,35
0,3
0,25
0,2
0,15
0,1
0,05
0
Source: Data appendix of Qi (2017).
2 The RSV increased slightly from 2.55 to 2.57, from 2008 to 2011.
3 Chinese economists held five conferences on distribution from 1977 to 1979 to criticize the distribution
Figure 3 shows the value composition of capital, σ. It is noteworthy that the value composition of capital shows a slightly downward trend during the reform era before 2008. One reason for this trend is the changes in the investment priorities of the state from heavy industries to light industries; another is the expansion of the private sec-tor, which concentrates in more labor-intensive industries. After 2008, as the global market stagnated and the Chinese economy relied more on investment to sustain eco-nomic growth, the value composition of capital increased substantially, repressing the rate of profit in the overall economy.
Figure 3 – Value composition of capital, 1956/2015
2
0
1956 1958 1960 1962 1964 1966 1968 1970 1972 1974 1976 1978 1980 1982 1984 1986 1988 1990 1992 1994 1996 1998 2000 2002 2004 2006 2008 2010 2012 2014
K/VC K/VC estimated
12
10
8
6
4
Source: Data appendix of Qi (2017).
Figure 4 – Gross vs. net rate of profit, 1956/2015
0
1956 1958 1960 1962 1964 1966 1968 1970 1972 1974 1976 1978 1980 1982 1984 1986 1988 1990 1992 1994 1996 1998 2000 2002 2004 2006 2008 2010 2012 2014
0,1 0,2 0,3 0,4 0,5 0,6 0,7
Gross Rate of Profit Gross Rate of Profit estimated
Net Rate of Profit estimated Net Rate of Profit
Source: Data appendix of Qi (2017).
3. A TIME SERIES ANALYSIS OF THE FACTORS THAT AFFECT PROFITABILITY
Marxian economics sustains that, in a capitalist economy, profitability is crucial to capital accumulation and economic growth. Given that capitalism has dominated the Chinese economy, profitability is the key to answer why economic growth slowed down after 2008 and whether the slowdown is a short-term issue or a long-term trend. The last section presents two measures of profitability, i.e. the gross rate of profit and the net rate of profit. Given that the net rate of profit is the ratio of the surplus value retained by productive sectors and total fixed capital, this measure is more relevant to capital accumulation. Although the gross rate of profit is also relevant to capital accu-mulation, the numerator of the gross rate of profit (i.e. total surplus value) contains the surplus value consumed by commercial and financial activities. Thus, in this section, we analyze what factors affected the net rate of profit over the reform era.
Using a growth decomposition method, Qi (2017) analyzed the contributions of the RSV, the value composition of capital, and the share of surplus value retained by productive sectors to the growth of the net rate of profit. The main findings of the decomposition are: before 2008, the RSV was the main driving force of the increase in profitability, which offset the effect of capital composition; after 2008, the growth of capital composition became the main driving force, and its effect was much larger than that of the RSV.
time series analysis has a clear disadvantage: because the reform era has been a 38-year long period, the data has at most 38 observations; the limited number of observations might affect the robustness of econometric results and the power of unit root tests. In particular, the reform era has experienced several major institutional changes, which might bring structural breaks to the data. Despite the disadvantage, the time series analysis may provide some interesting results, which is comparable to the decomposi-tion results.
We establish the following long-run relationship:
NRPt = α0 + α1WGt + α2KVt + α3Ut + α4CUt + μt (8)
In equation (8), all variables are log-transformed. The dependent variable, NRP, is the net rate of profit. WG is the wage gap between a living wage standard and the aver-age waver-age, which captures the waver-age pressure. KV is the value composition of capital.
U is the share of surplus value extracted by unproductive sectors. CU is a measure of capacity utilization, which captures economic cyclicality. α0 is a constant. μ is the error term.
workers have more job security and obtain higher wages. We measure the average wage with the average compensation of employees in non-agricultural sectors. Thus, the wage gap is the ratio of the average urban unit wage to the average compensation of employees in non-agricultural sectors. The wage gap should have a positive effect on the net rate of profit.
The second factor is the value composition of capital. In “Das Kapital”, volume 3, Marx argued that the rate of profit has a tendency to fall as a result of the rising organic composition of capital (MARX, 1981). The organic composition of capital tends to rise because mechanization is a crucial way for individual capitalists to expand the market share and control the labor process. The value composition of capital, as a measure of the organic composition, should have a negative effect on the net rate of profit.
The third factor is the size of unproductive sectors. We measure the size of unpro-ductive sectors as the share of surplus value extracted by unprounpro-ductive sectors. Same as the second factor, this factor also comes from the decomposition of the dependent variable. Unproductive sectors can promote the realization of surplus value and ac-celerate the circulation of capital. However, unproductive sectors extract a part of the surplus value, thus reducing the amount of surplus value for accumulation. Also, the expansion of finance (real estate included) – one of the major unproductive sectors – may give rise to financialization, which has restrained real investments and job cre-ation in major capitalist economies (LAZONICK and O’SULLIVAN, 2000; DAVIS, 2013). With the commodification of housing and the downturn of the real economy, China witnessed bubbles in the housing and stock markets. Although China has not been financialized as the U.S., the overly expanding financial sector has threatened economic stability and growth sustainability. Therefore, the size of unproductive sec-tors might have a negative effect on the net rate of profit.
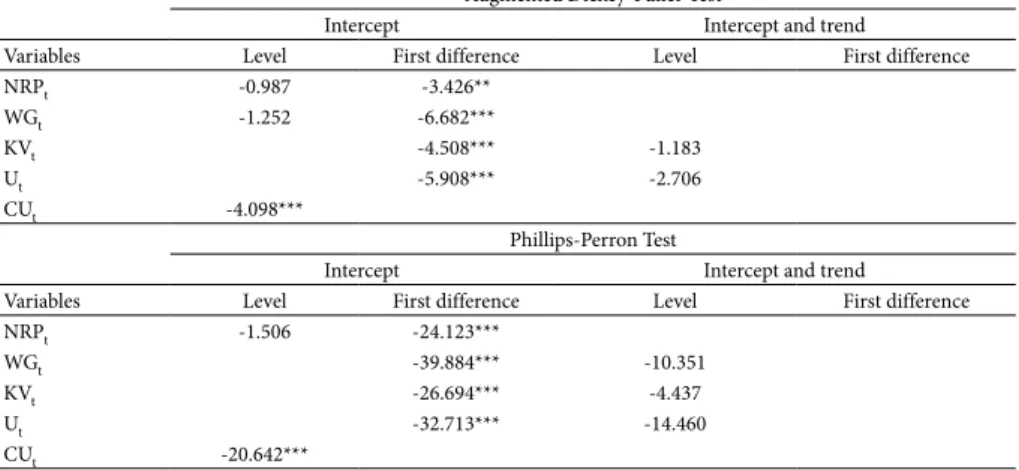
To avoid spurious regressions, all variables need to be stationary in levels, or all variables are non-stationary in their levels but stationary in first differences, and, meanwhile, they are cointegrated. Thus, the first step of the analysis is unit root tests. Table 2 gives the results of the augmented Dickey-Fuller test and the Phillips-Perron test. The results show CU is stationary in levels and all theother variables are non-stationary in levels and non-stationary in first differences, i.e. CU is I(0) and all the other variables are I(1). Given that the variables are either I(0) or I(1), the autoregressive-distributed lag (ARDL) approach to cointegration developed by Pesaran et al. (2001) is appropriate. This approach uses the bounds test to examine whether a cointegration relation exists among a group of variables that are either I(0) or I(1), which is widely used in recent empirical studies.
Table 2 – Unit Root Tests
Augmented Dickey-Fuller Test
Intercept Intercept and trend
Variables Level First difference Level First difference
NRPt -0.987 -3.426**
WGt -1.252 -6.682***
KVt -4.508*** -1.183
Ut -5.908*** -2.706
CUt -4.098***
Phillips-Perron Test
Intercept Intercept and trend
Variables Level First difference Level First difference
NRPt -1.506 -24.123***
WGt -39.884*** -10.351
KVt -26.694*** -4.437
Ut -32.713*** -14.460
CUt -20.642***
Notes: *** and ** denote rejection of the null hypothesis of a unit root at 1% significance level and 5% significance level, respectively.
Source: Author’s elaboration based on the estimation results. For the data sources of the variables, please see the data ap-pendix of Qi (2017).
According to the ARDL approach, equation (8) should incorporate the short-run adjustment process:
∆NRPt ∆NRP ∆WG ∆KV
i p t i i q t i i q t i i q = + + + + = − = − = − =
∑
∑
∑
β0 β β β
1 1 0 2 0 3 0
1 2 33
4
∑
β∆Ut i−+ + + + + + + = − − − − − −
∑
i qt i t t t t t
CU NRP WG KV U CU v
0
5 6 1 7 1 8 1 9 1 10 1
4
β∆ β β β β β tt (9)
lower bound and the upper bound of critical values. If the F-statistic is smaller than the lower bound, then there is no long-run relationship between levels of the variables; if the F-statistic is greater than the lower bound but smaller than the upper bound, then the result is inconclusive; if the F-statistic is greater than the upper bound, then there is a long-run relationship between levels of the variables.
According to the Schwarz-Bayesian information criterion, lag lengths are (1, 0, 0, 0, 1) for (p, q1, q2, q3, q4). A key assumption of the bounds test is that the residuals of
equation (9) must be serially independent. With these lag lengths, there is no serial correlation in the residuals (the p value of the Breusch-Godfrey LM test is 0.028).The results of the bounds test in Table 3 support that there is a long-run relationship be-tween levels of the variables. The F-statistic is greater than the upper bound at the 1% level of significance. The t-statistic of the error-correction term is also greater than the upper bound at the 5% level of significance.
Table 3 – ARDL Bounds Test
F-statistic 7.190***
Critical Values I(0) I(1)
1% 3.74 5.06
5% 2.86 4.01
10% 2.45 3.52
t-statistic -4.148**
Critical Values I(0) I(1)
1% -3.43 -4.60
5% -2.86 -3.99
10% -2.57 -3.66
Notes: ** and *** denotes 5% and 1% significance levels, re-spectively. The null hypothesis is there is no cointegration. Critical values are from the appendix of Narayan (2005).
Source: Author’s elaboration based on the estimation results. For the data sources of the variables, please see the data appendix of Qi (2017).
Table 4 – ARDL Regression Results
Dependent variable: NRP
NRPt-1 0.752***
(12.565)
WGt 0.256**
(2.619)
KVt -0.354***
(-4.721)
Ut -0.051
(-0.862)
CUt 0.524***
(3.153)
CUt-1 -0.555***
(-3.613)
Constant 0.224
(1.060)
Adjusted R2 0.953
Period 1984-2015
N 32
Notes: ** and *** denotes 5% and 1% level of sig-nificance, respectively. The t-statistics are in parentheses. The lag lengths of regressors are selected according to Schwarz-Bayesian information criterion. According to the ADF test and PP test, the residual of the regression is stationary. According to the Breusch-Godfrey LM test, there is no serial correlation. According to the Breusch-Pagan test, there is no heteroskedasticity.
Source: Author’s elaboration based on the estimation re-sults. For the data sources of the variables, please see the data appendix of Qi (2017).
After the ARDL regression, we further estimate the following error correction model:
∆NRPt ∆NRP ∆WG ∆KV
i p t i q t i q t i q = + + + + = − = = =
∑
∑
∑
∑
δ0 δ δ δ δ
1 1 1 0 2 0 3 0 4
1 2 3
∆
∆Ut ∆CU
i q t + =
∑
0 5 4 δ+ δ6ECt–1 + ωt (10)
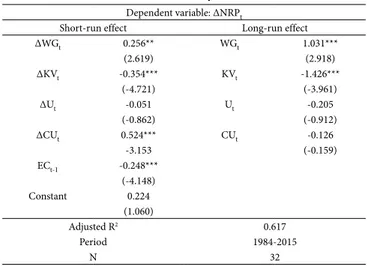
Table 5 – Error-Correction Representation Results
Dependent variable: ΔNRPt
Short-run effect Long-run effect
ΔWGt 0.256** WGt 1.031***
(2.619) (2.918)
ΔKVt -0.354*** KVt -1.426***
(-4.721) (-3.961)
ΔUt -0.051 Ut -0.205
(-0.862) (-0.912)
ΔCUt 0.524*** CUt -0.126
-3.153 (-0.159)
ECt-1 -0.248***
(-4.148)
Constant 0.224
(1.060)
Adjusted R2 0.617
Period 1984-2015
N 32
Notes: ** and *** denotes 5% and 1% level of significance, respectively. The t-statistics are in parentheses.The lag lengths of regressors are selected according to Schwarz-Bayesian information criterion. According to the ADF test and PP test, the residual of the regression is stationary. According to the Breusch-Godfrey LM test, there is no serial correlation. According to the Breusch-Pagan test, there is no heteroskedasticity. Source: Author’s elaboration based on the estimation results. For the data sources of the variables, please see the data appendix of Qi (2017).
Table 5 also gives the long-run effect of each factor. The long-run effects of WG and KVare 1.031 and 1.426, respectively, which means that 1% increase in WG (KV) will raise NRP by 1.031% (1.426). During the period from 2007 to 2015, WG dropped by 10% and KV increased by 47%, which has considerably reduced the long-run net rate of profit. These results show that rising value composition of capital was the main driver for the slowdown of profitability in the long run, which is consistent with the decomposition results of Qi (2017). The results also show that the wage pressure had considerable impacts on the long-run profitability, although it is not the most effec-tive factor. Finally, the size of unproduceffec-tive sectors and economic cyclicality had no significant effect on the long-run profitability.
4. UNDERMINED CONDITIONS FOR THE PROFITABILITY AND THE “NEW NORMAL”
question is: why has the RSV been stagnant (or the wage pressure been rising), and why has the value composition of capital been rising?
The stagnation of the RSV and the rising wage pressure is a result of the shrinking reserve army of labor. As we discussed in Section 2.2, the formation and expansion of the reserve army of labor are a key reason for the growth of the RSV in the late 1990s and early 2000s. The two primary components of the reserve army of labor are migrant workers and laid-offs of the state-owned sector. For the laid-offs, after 2004, the em-ployment of the state-owned sector turned to be stable, which implies that there was little increase in the number of laid-offs. Meanwhile, many of the workers being laid off in the 1990s quit the labor force as they reached retirement ages. The other main component of the reserve army of labor did not continue to grow after 2008 as fast as it grew before 2008. The growth of migrant workers from 2008 to 2014 continuously declined (NATIONAL BUREAU OF STATISTICS, 2013; 2015). The share of migrant workers in total urban employment was increasing in the 1990s and 2000s; by contrast, this proportion became stable after 2008, and slightly declined after 2010. Regarding wages, the economy witnessed fast real wage growth. Nevertheless, this increase does not imply that workers afford decent living conditions (LI and QI, 2014). Workers still have to rely on overtime work to meet the living wage standard and cover the wage gap. Given the shrinking reserve army and the wage gap, it is unlikely to reverse the rising trend of the real wage.
The fast growth of the RSV in the decade before 2008, on the one hand, under-pinned the growth of profitability; on the other, it could jeopardize profitability by repressing the domestic consumption demand. Thus, the accumulation model in the decade before 2008 had to resolve the value realization problem. Export and invest-ment played a crucial role in maintaining aggregate demand. Zhu and Kotz (2010) observe that the economic growth has increasingly relied on export and investment. After 2008, as the global capitalism entered into the great recession or secular stagna-tion, demand for China’s export dramatically declined. As a result, the role of invest-ment became crucial. The state launched the four trillion yuan stimulus package in response to the economic slowdown.The state-controlled banking system supported massive investment that concentrated in infrastructure, which could expand aggregate demand for enterprises in the short run and enhance productivity in the long term. However, infrastructure investment is less profitable, and its positive effect on profit-ability might concentrate in a few relevant industries (such as steel industry) in the short run. As a result, the massive investment greatly increased the value composition of capital, which further depressed profitability.
2011), the rising debt-income ratio along with massive investment might jeopardize growth sustainability. The debt-income ratio of the non-financial enterprise sector quickly rose from 195% in 2007 to 317% in 2014. The debt of the non-financial enter-prise sector as a proportion of GDP was stable from 1996 to 2008, but increased from 98% in 2008 to 149% in 2014. The debt-income ratio of the non-financial sector has been the highest among major economies of the world (LI et al., 2015).
To sum up, the massive reserve of labor underpinned the RSV from the late 1990s to 2008, which was a result of institutional and power shifts during China’s economic transition; in recent years, as the reserve army declined, the RSV stopped increasing, although it is still high. The high RSV required the economy to rely more on invest-ment and export; after 2008, investinvest-ment became crucial to expanding the aggregate demand, leading to a rising value composition of capital. The stagnant RSV and the rising value composition of capital jointly caused the slowdown of profitability. To recover profitability, China has to make consumption replace investment as the main source of aggregate demand. With a stillhigh RSV, it is unlikely to raise the consump-tion ratio of the economy (unless by increasing household debts, which is unsustain-able in the long run). Therefore, the low profitability and the “new normal” will last until China manages to lower the RSV and restructure the aggregate demand.
5. CONCLUSION
This paper has constructed homogenous series of the RSV using a Marxian approach and analyzed the relationship between the RSV and China’s “new normal” featured by falling profitability. Dynamics of theRSV resulted from changes in power relations determined by a series of economic and institutional factors such as the ownership structure of the economy, the formation of the reserve army of labor, the reform of the state-owned enterprises and so on. The main findings of this paper are: over the reform era, the RSV decreased from 1978 to 1997, increased from 1997 to 2008, and then stagnated after 2008. The stagnant RSV (or the rising wage pressure) has been an important factor that restrained profitability. Also, given the still high RSV, investment has been crucial to sustain aggregate demand after 2008, which gave rise to the drastic increase in capital composition. The rise in capital composition has been another im-portant factor that restrained profitability.
Chi-na’s exports. ChiChi-na’s economic growth fell behind the increase of wages, leading to the decline in the RSV. Secondly, as the decade-long increase of the RSV constrained workers’ capacity to maintain decent living conditions, struggles of workers for a living wage surged against this background, and the reduction in the reserve army of labor also enhanced the bargaining power of employees. Given that the massive investment led to a rising value composition of capital, which repressed profitability, and a rising debt-income ratio, which jeopardized the growth sustainability, the Chinese economy might encounter serious problems to maintain profitability in the “new normal.” Fur-thermore, the current accumulation model has also challenged the limits of environ-mental resources as air pollution has become a serious problem for the Chinese peo-ple. Capital accumulation has overused not only labor power but also environmental resources. Under this circumstance, maintaining the current accumulation model may prepare conditions for not only an economic crisis but also an ecological crisis. Major institutional changes favorable to pro-labor distribution, a wage-led growth model, and sustainable development might be a prerequisite to achieving prosperity in the future.
REFERENCES
BODDY, R.; CROTTY, J. Class conflict and macro-policy: the political business cycle. Review of Radical Political Economics, v. 7, n. 1, p. 1-19, 1975.
CAI, F.; DU, Y. Wage increases, wage convergence, and the Lewis turning point in China. China Economic Review, v. 22, n. 4, p. 601-610, 2011.
CRONIN, B. Productive and unproductive capital: a mapping of the New Zealand system of national accounts to classical economic categories, 1972‐95. Review of Political Economy, v. 13, n. 3, p. 309-327, 2001.
DAVIS, L. E. Financialization and the nonfinancial corporation: an investigation of firm-level investment behavior in the U.S. University of Masschusetts Amherst Working Paper, 2013.
KUZNETS, S. Economic growth and income inequaity. American Economic Review, v. 45, n. 1, p. 1-28, 1955.
LAZONICK, W.; O’SULLIVAN, M. Maximizing shareholder value: a new ideology for corpo-rate governance. Economy and Society, v. 29, p. 13–35, 2000.
LI, Y.; ZHANG, X.; CHANG, X. China National Balance Sheet 2015. Beijing: China Social Sci-ence Press, 2015.
LI, Z.; QI, H. Labor Process and the social structure of accumulation in China. Review of Radical Political Economics, v. 46, n. 4, p. 481-488, 2014.
LUO, G. Marx’s Theory of productive labor: two contemporary systems of national accounting and issues on the reform of China’s statistical system (in Chinese). Beijing: Economic Sci-ence Press, 1990.
MANIATIS, T. Marxian macroeconomic categories in the Greek Economy. Review of Radical Political Economics, v. 37, n. 4, p. 494-516, 2005.
MARINA, A.; MOSELEY, F. “The rate of profit in the postwar Mexican economy, 1950-1993”. In: BAIMAN, R.; BOUSHEY, H.; SAUNDERS, D. (Eds.). Political economy and contempo-rary capitalism: radical perspectives on economic theory and policy. Armonk, NY: M.E. Sharpe, 2000, p. 184-192.
MARX, K. Capital. Vol. 3. New York: Penguin Books, 1981.
MOHUN, S. On measuring the wealth of nations: the US economy, 1964-2001. Cambridge Jour-nal of Economics, v. 29, n. 5, p. 799-815, 2005.
MOHUN, S. Unproductive labor in the U.S. Economy 1964-2010. Review of Radical Political Economics, v. 46, n. 3, p. 355-379, 2013.
MOSELEY, F. The rate of surplus value in the postwar U.S. economy: a critique of Weisskopf ’s estimates. Cambridge Journal of Economics, v. 9, n. 1, p. 57-79, 1985.
NARAYAN, P. K. The saving and investment nexus for China: evidence from cointegration tests.
Applied Economics, v. 37, n. 17, p. 1979-1990, 2005.
NATIONAL BUREAU OF STATISTCS OF CHINA. Report on the survey of migrant workers in China 2012 (in Chinese). Beijing: National Bureau of Statistics of China, 2013. Available at: <http://www.stats.gov.cn/tjsj/zxfb/201704/t20170428_1489334.html>.
NATIONAL BUREAU OF STATISTCS OF CHINA. Report on the Survey of Migrant Workers in China 2014 (in Chinese). Beijing: National Bureau of Statistics of China, 2015. Available at: <http://www.stats.gov.cn/tjsj/zxfb/201504/t20150429_797821.html>.
PAITARIDIS, D.; TSOULFIDIS, L. The growth of unproductive activities, the rate of profit, and the phase-change of the U.S. economy. Review of Radical Political Economics, v. 44, n. 2, p. 213-233, 2011.
PESARAN, M. H.; SHIN, Y.; SMITH, R. J. Bounds testing approaches to the analysis of level relationships. Journal of Applied Econometrics, v. 16, n. 3, p. 289-326, 2001.
PIKETTY, T. Capital in the 21st century. Cambridge, M.A.: Harvard University Press, 2014.
QI, H. The labor share question in China. Dissertation. University of Massachusetts Amherst, Amherst, M.A., 2015.
QI, H. Dynamics of the rate of surplus value and the “new normal” of the Chinese economy.
Research in Political Economy, v. 32, n. 1, p. 105-129, 2017.
SHAIKH, A. M.; TONAK, E. A. Measuring the wealth of nations: the political economy of na-tional accounts. Cambridge, UK: Cambridge University Press, 1994.
SUMMERS, L. H. Demand side secular stagnation. American Economic Review, v. 105, n. 5, p. 60-65, 2015.
SUN, Y. On productive labor and unproductive labor and the discussion on national income and gross national product. Economic Reserch Journal (Jingji Yanjiu, in Chinese), n. 8, p. 15-24, 1981.
TSOULFIDIS, L.; TSALIKI, P. Unproductive labour, capital accumulation and profitability crisis in the Greek economy. International Review of Applied Economics, v. 28, n. 5, p. 562-585, 2014.
WEI, X. On the issue of productive labor and unproductive labor. Economic Theory and Eco-nomic Management (Jingji Lilun yu Jingji Guanli, in Chinese), p. 16-22, 1981.
YU, G. Productive labor and unproductive labor in the socialist system. Economic Issues in China (Zhongguo Jingji Wenti, in Chinese), n. 1, p. 1-8, 1981.
ZHU, A.; KOTZ, D. M. The dependence of China’s economic growth on exports and investment.